. 2015 Jan 12;27(1):72-84.
doi: 10.1016/j.ccell.2014.11.002. Epub 2014 Dec 18.

Combined MYC and P53 defects emerge at medulloblastoma relapse and define rapidly progressive, therapeutically targetable disease

Affiliations

Combined MYC and P53 defects emerge at medulloblastoma relapse and define rapidly progressive, therapeutically targetable disease

Rebecca M Hill et al. Cancer Cell. .

Abstract

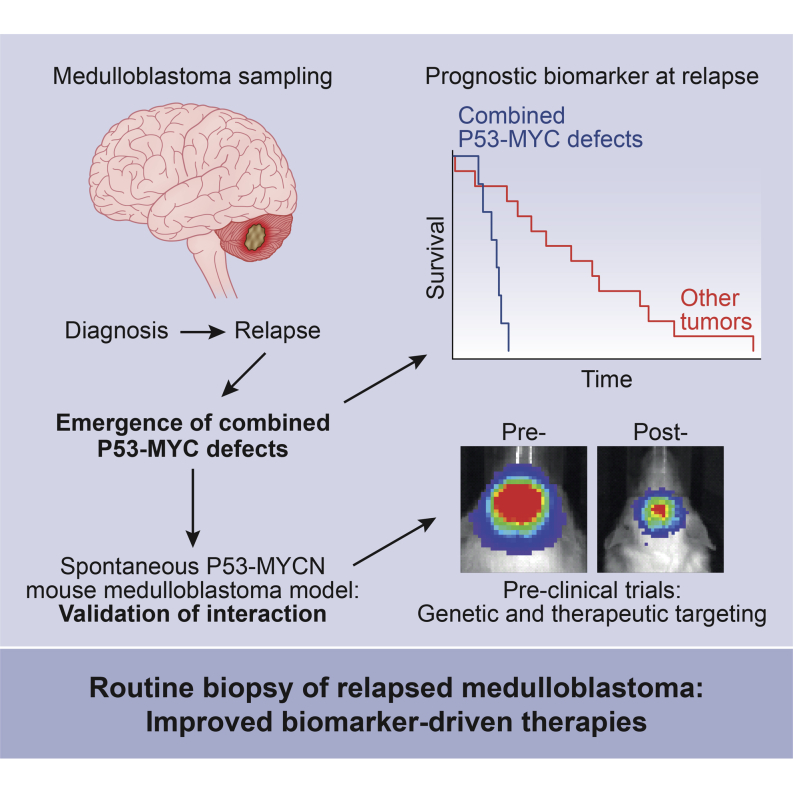
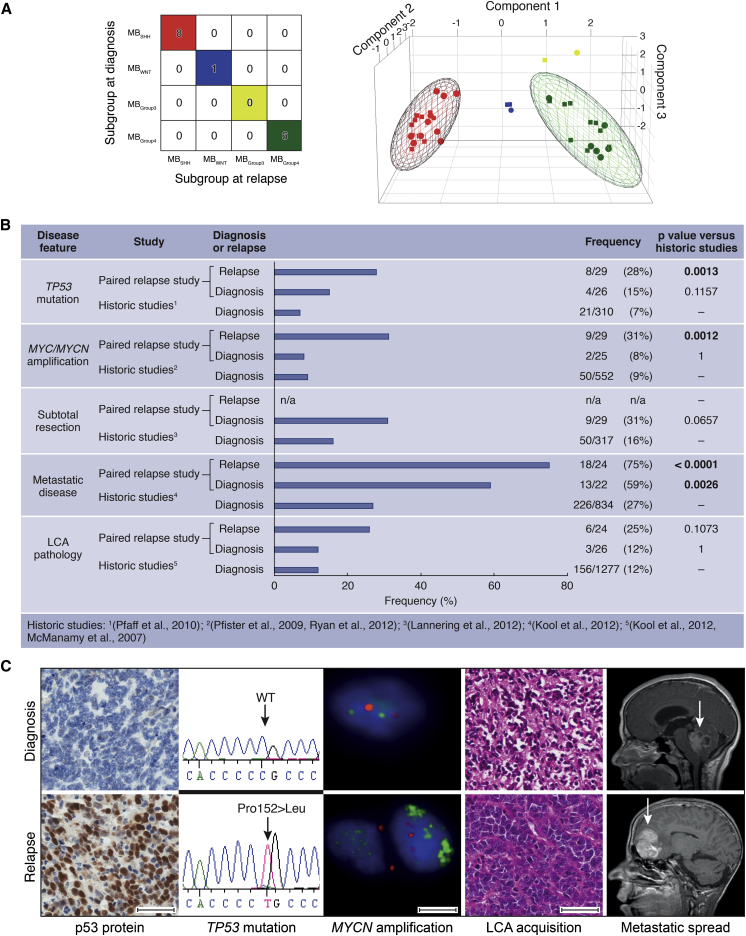
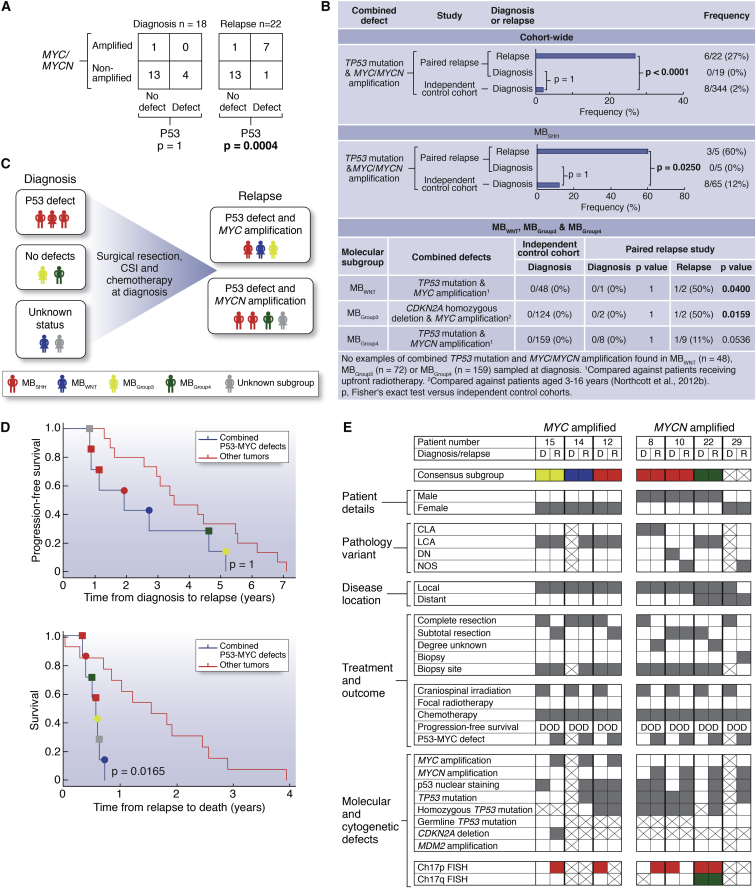
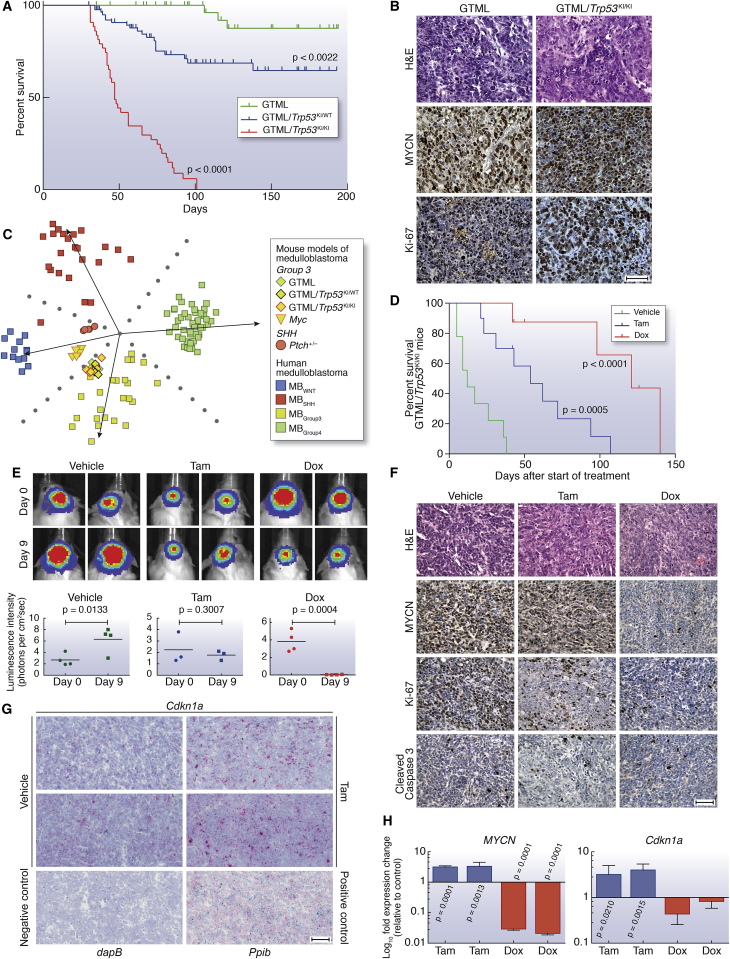
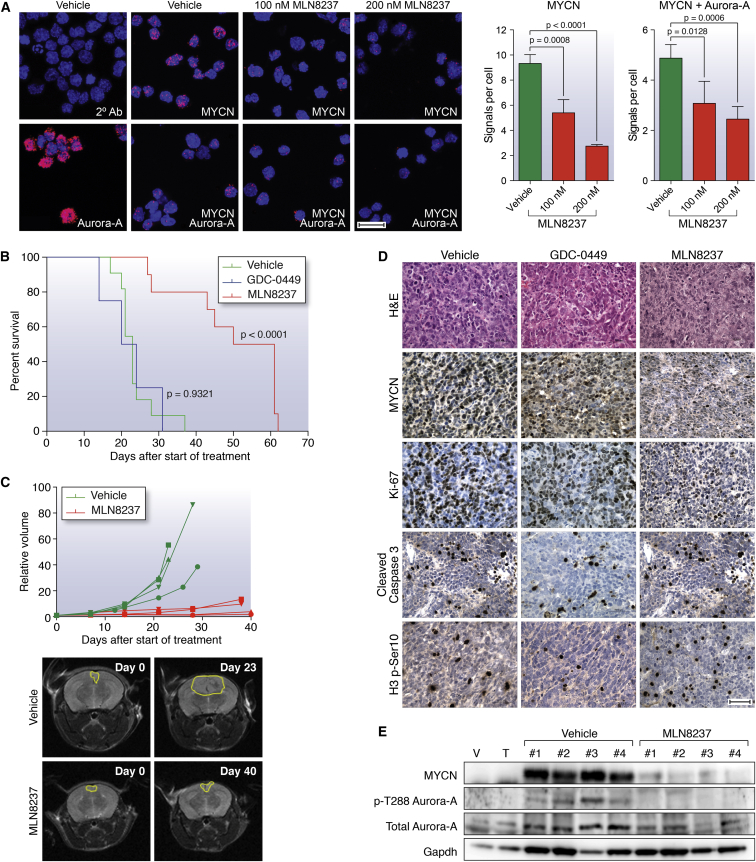
We undertook a comprehensive clinical and biological investigation of serial medulloblastoma biopsies obtained at diagnosis and relapse. Combined MYC family amplifications and P53 pathway defects commonly emerged at relapse, and all patients in this group died of rapidly progressive disease postrelapse. To study this interaction, we investigated a transgenic model of MYCN-driven medulloblastoma and found spontaneous development of Trp53 inactivating mutations. Abrogation of p53 function in this model produced aggressive tumors that mimicked characteristics of relapsed human tumors with combined P53-MYC dysfunction. Restoration of p53 activity and genetic and therapeutic suppression of MYCN all reduced tumor growth and prolonged survival. Our findings identify P53-MYC interactions at medulloblastoma relapse as biomarkers of clinically aggressive disease that may be targeted therapeutically.


Figures

None
Graphical abstract
Figure 1
Figure 1
Relapsed Medulloblastomas Maintain the Molecular Subgroup but Are Enriched for Multiple High-Risk Clinical and Molecular Features (A) Consensus clustering (left) and principal component analysis (PCA) (right) of medulloblastoma subgroups at diagnosis and relapse. Consensus molecular subgroups: red, MBSHH; blue, MBWNT; yellow, MBGroup3; green, MBGroup4. In the PCA plot, subgroups assigned at diagnosis are represented by circles, and those assigned at relapse are represented by squares. (B) Frequency of high-risk disease features within the present paired relapse study cohort sampled at diagnosis and relapse, compared to large historic cohorts sampled at disease diagnosis. p, Fisher’s exact test. (C) Acquisition of molecular and clinical disease features between diagnosis (top) and relapse (bottom). Left to right: immunohistochemical analysis of p53 protein accumulation; TP53 homozygous missense mutation (Pro152Leu); interphase fluorescence in situ hybridization (iFISH) showing MYCN amplification (green versus centromeric control (red); H&E showing LCA acquisition and magnetic resonance imaging (MRI) showing metastatic spread (arrows indicate tumor site). Scale bars, 50 μM (immunohistochemistry, H&E) or 5 μM (iFISH). See also Figure S1 and Table S3.
Figure 2
Figure 2
Combined P53 Pathway Defects and MYC/MYCN Amplification Commonly Emerge following Standard Upfront Radiotherapy and Chemotherapy and Correlate with Rapid Disease Progression after Relapse (A–C) Association (A), frequency of occurrence and distribution within molecular subgroups (B), and patterns of emergence (C), of combined P53 pathway defects and MYC/MYCN amplification at diagnosis and relapse. (D) Survival of patients with tumors harboring combined P53-MYC gene family defects versus other tumors, showing time from diagnosis to relapse (top) and relapse to death (bottom). Circle, P53-MYC; square, P53-MYCN. p, log rank test, Bonferroni corrected. (E) Detailed clinical, pathological, and molecular demographics of patients with combined P53-MYC gene family defects at relapse. D, diagnosis; R, relapse. Consensus molecular subgroup (red, MBSHH; blue, MBWNT; yellow, MBGroup3; green, MBGroup4). Pathology variant: CLA, classic; LCA, large-cell/anaplastic; DN, nodular/desmoplastic; NOS, medulloblastoma not otherwise specified. Disease location: local, M0/M1; distant, M2+. Biopsy site: gray square, primary tumor biopsied; white square, metastatic site biopsied; crossed square, biopsy sample not available. Current status: DOD, died of disease. Chromosome 17 status: red, loss; green, gain. Other categories: gray square, feature present; white square, feature absent; crossed square, data not available. See also Figure S2 and Table S4.
Figure 3
Figure 3
Aberrant Expression of MYCN in Combination with p53 Loss of Function Drives Highly Penetrant and Aggressive Medulloblastoma (A) Kaplan-Meier survival curves for GTML/Trp53KI/KI (n = 43), GTML/Trp53KI/WT (n = 83), or GTML transgenic mice (n = 50) mice as indicated. p, log rank test. (B) H&E and immunohistochemical staining indicating levels of MYCN protein and cell proliferation (Ki-67) in GTML/Trp53KI/KI and GTML transgenic mice. (C) Subgroup classification of mouse expression profiles using a support vector machine trained on human medulloblastoma expression profiles and nonnegative matrix factorization for cross-species projection. (D) Kaplan-Meier survival for GTML/Trp53KI/KI mice treated with doxycycline (Dox, n = 8) or tamoxifen (Tam, n = 10) compared to vehicle (n = 9) as indicated. p, log rank test. (E) GTML/Trp53KI/KI mice coexpressing firefly luciferase (FLuc) were treated with Tam, Dox, or vehicle for 9 days. Bioluminescent imaging of GTML/Trp53KI/KI mice after 9 days treatment with Dox or Tam as indicated (top). Luminescence intensity at days 0 and 9 are shown (bottom). Data points represent individual mice. p, unpaired t test. (F) H&E and immunohistochemical staining indicating levels of MYCN, Ki-67, or apoptosis (cleaved caspase 3) in GTML/Trp53KI/KI mice after treatment with Dox or Tam. (G) RNAscope 2-plex chromogenic assay. Cdkn1a expression (red) was analyzed on brain sections from GTML/Trp53KI/KI mice treated with either Tam or vehicle control as indicated. Samples were costained for expression of the Ubc (ubiquitin C) housekeeping gene (green). Expression of Ppib (Peptidylprolyl Isomerase B, Cyclophilin B) (red) and Polr2a (DNA-directed RNA polymerase II subunit RPB1) (green) were used as positive controls. Expression of dapB (dihydrodipicolinate) reductase gene from B. subtilis was used as a negative control. Sections were counterstained with Gill’s hematoxylin. (H) Fold difference of human MYCN or mouse Cdkn1a mRNA levels in tumor tissues treated with either Dox or Tam. (p, unpaired t test.) Scale bars, 50 μm. Error bars represent mean ± SD. See also Figure S3 and Table S5.
Figure 4
Figure 4
Therapeutic Targeting of the MYCN/Aurora-A Interaction Inhibits Tumor Growth and Prolongs Survival in GTML/Trp53KI/KI Mice (A) Proximity ligation assay (PLA) analyzing MYCN/Aurora-A complexes in GTML/Trp53KI/KI neurospheres following MLN8237 treatment (48 hr). Left panel shows close proximity (<40 nm) of antibody conjugated PLA probes that have been ligated, amplified, and detected with complementary fluorescent probes. Red dots represent the presence of MYCN or Aurora-A protein, or MYCN/Aurora-A interactions as indicated. Antibodies used are indicated by white text (2° Ab, secondary antibody control). Scale bar, 20 μm. Right panel shows mean values of signals (red dots) per cell representing MYCN expression or MYCN/Aurora-A interactions. Values are derived from triplicate biological replicates, and error bars represent SDs. p, unpaired t test. (B) Kaplan-Meier survival for GTML/Trp53KI/KI mice treated with MLN8237 (n = 10), GDC-0449 SHH antagonist (n = 4), or vehicle (n = 11) as indicated. (p, log rank test.) (C) Longitudinal MRI analysis of tumor volume (n = 4) on the axial plane (top). Representative MRIs of the axial plane of MLN8237-treated animals compared to vehicle as indicated at day 0 and last day of treatment (bottom). (D) H&E and immunohistochemical staining indicating levels of MYCN protein, cell proliferation (Ki-67), apoptosis (cleaved caspase 3), or mitotic activity as measured by phosphorylated Ser10 on histone H3 (H3 p-S10) after treatment with GDC-0449 or MLN8237. Scale bar, 50 μm. (E) Immunoblotting of MYCN protein levels, and total and phosphorylated Thr288 on Aurora-A (p-T288 Aurora-A) in MLN8237-treated tumor tissues. For (D) and (E), animals were treated with vehicle, GDC-0449, or MLN8237 for 48 hr, and samples were taken 2 hr after final administration of agent. Error bars represent mean ± SD. See also Figure S4.

References

    1. Abdi H. Bonferroni and Sidak corrections for multiple comparisons. In: Salkind N.J., editor. Encyclopedia of Measurement and Statistics. Sage; Thousand Oaks, CA: 2007.
    1. Berggren P., Kumar R., Sakano S., Hemminki L., Wada T., Steineck G., Adolfsson J., Larsson P., Norming U., Wijkstrom H., Hemminki K. Detecting homozygous deletions in the CDKN2A(p16(INK4a))/ARF(p14(ARF)) gene in urinary bladder cancer using real-time quantitative PCR. Clin. Cancer Res. 2003;9:235–242. - PubMed
    1. Brockmann M., Poon E., Berry T., Carstensen A., Deubzer H.E., Rycak L., Jamin Y., Thway K., Robinson S.P., Roels F. Small molecule inhibitors of aurora-a induce proteasomal degradation of N-myc in childhood neuroblastoma. Cancer Cell. 2013;24:75–89. - PMC - PubMed
    1. Carol H., Reynolds C.P., Kang M.H., Keir S.T., Maris J.M., Gorlick R., Kolb E.A., Billups C.A., Geier B., Kurmasheva R.T. Initial testing of the MDM2 inhibitor RG7112 by the Pediatric Preclinical Testing Program. Pediatr. Blood Cancer. 2013;60:633–641. - PMC - PubMed
    1. Carr-Wilkinson J., O’Toole K., Wood K.M., Challen C.C., Baker A.G., Board J.R., Evans L., Cole M., Cheung N.K., Boos J. High Frequency of p53/MDM2/p14ARF Pathway Abnormalities in Relapsed Neuroblastoma. Clin. Cancer Res. 2010;16:1108–1118. - PMC - PubMed

Publication types

MeSH terms

Associated data