. 2015 Jan 12;27(1):27-40.
doi: 10.1016/j.ccell.2014.11.009. Epub 2014 Dec 18.

Microbially driven TLR5-dependent signaling governs distal malignant progression through tumor-promoting inflammation

Affiliations

Microbially driven TLR5-dependent signaling governs distal malignant progression through tumor-promoting inflammation

Melanie R Rutkowski et al. Cancer Cell. .

Abstract

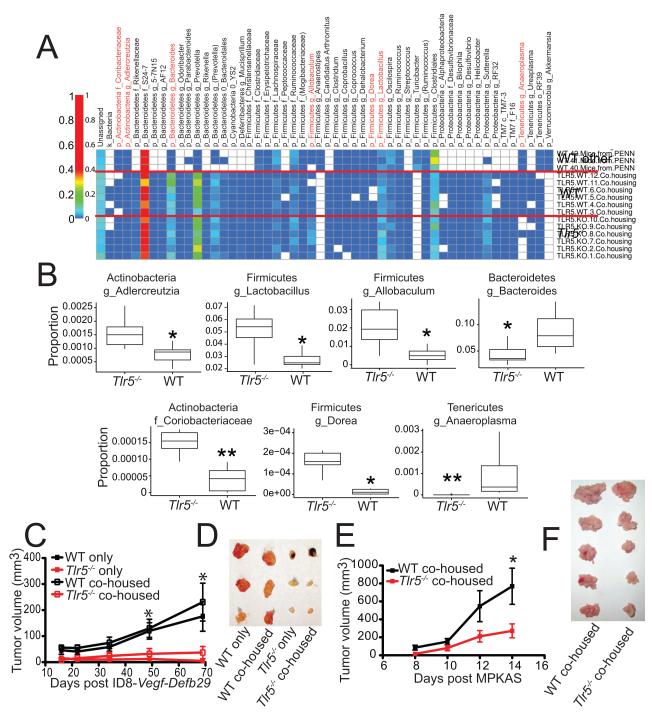
The dominant TLR5(R392X) polymorphism abrogates flagellin responses in >7% of humans. We report that TLR5-dependent commensal bacteria drive malignant progression at extramucosal locations by increasing systemic IL-6, which drives mobilization of myeloid-derived suppressor cells (MDSCs). Mechanistically, expanded granulocytic MDSCs cause γδ lymphocytes in TLR5-responsive tumors to secrete galectin-1, dampening antitumor immunity and accelerating malignant progression. In contrast, IL-17 is consistently upregulated in TLR5-unresponsive tumor-bearing mice but only accelerates malignant progression in IL-6-unresponsive tumors. Importantly, depletion of commensal bacteria abrogates TLR5-dependent differences in tumor growth. Contrasting differences in inflammatory cytokines and malignant evolution are recapitulated in TLR5-responsive/unresponsive ovarian and breast cancer patients. Therefore, inflammation, antitumor immunity, and the clinical outcome of cancer patients are influenced by a common TLR5 polymorphism.


Figures

Fig. 1
Fig. 1. Tumor-promoting inflammation is driven by TLR5-dependant signaling
(AC) Serum levels of IL-6 (A), IL-23 (B), or CCL3 (C) in TLR5-responsive (WT) and TLR5-deficient (Tlr5−/−) mice with advanced (day 64-75) flank sarcomas (Tumor; n≥15/group) or naïve littermate controls, detected by ELISA. (D-E) Proportions (D) and total numbers (E) of MDSC infiltrating into the spleens of WT or Tlr5−/− mice bearing equal sized tumors. Representative of 2 independent experiments with 5-8 animals/group. (F) IFNγ ELISPOT of sorted antigen-specific CD8 T cells from the draining lymph node (inguinal) of mice bearing day 64 hind flank sarcomas incubated with tumor-lysated pulsed BMDCs (pulsed) or BMDCs only (unpulsed). Data are representative of two experiments with at least 3 mice per group. (G) Representative images of tumors and growth curve of Tlr5−/− or WT transgenic mice administered subcutaneous adenovirus-Cre into the hind flank. Data are representative of 5 individual experiments with at least 6-10 mice/group. (H) Representative final tumor volume and resected ID8-Vegf-Defb29 tumors 27 days after injection into the axillary flank. Data are representative of two individual experiments with at least 5-8 mice/group. (I) Growth curve and representative resected UPK10 (p53/K-ras-dependent ovarian) tumors 43 days after challenge in the axillary flank. Data are representative of two individual experiments with at least 4-6 mice/group. (J) Survival proportions of Tlr5−/− and WT mice bearing syngenic ID8 ovarian tumor cells (≥5/group with two repetitions). All data represent mean ± SEM. * p < .05, *** p < .001 Tlr5−/− compared to WT using the Mann Whitney test and Log-rank test for survival. See also Figure S1
Fig. 2
Fig. 2. The absence of TLR5 signaling results in a divergent microbial composition and reduced tumor progression
(A) Heat map of operational taxonomic units of commensal bacteria phyla from WT or Tlr5−/− mice co-housed for four weeks, compared to naïve WT mice housed in a different animal facility (WT other). (B) Proportions of the indicated bacterial phyla in co-housed WT and Tlr5−/− mice. Boxes represent the interquartile range (bottom; 25th percentile; top, 75th percentile) and the line inside represents the median. Whiskers denote the lowest and highest values within 1.5 × the interquartile range. Kruskal-Wallis one-way analysis of variance was used to calculate significance. (C) Tumor growth kinetics of ID8-Vegf-Defb29 injected into the axillary flank of WT and Tlr5−/− mice co-housed for four weeks prior to the injection. Data are representative of one experiment with at least 5 mice/group. (D) Tumors from co-housed mice in (C) resected after 69 days. (E) Growth kinetics of MPKAS sarcomas injected in the axillary flank of WT and Tlr5−/− mice co-housed for three weeks prior to the injection. Data are representative of one experiment with at least 5 mice per group. (F) Resected tumors from co-housed mice in (C) 14 days after injection. All data represents the mean ± SEM. * p < .05, ** p < .01, *** p < .001. Unless stated otherwise, the Mann Whitney test was used.
Fig. 3
Fig. 3. Commensal microbiota modulate TLR5-dependent tumor growth through increased IL-6 and γδ T cells
(A) IL-6 serum levels of WT or Tlr5−/− mice 14 days after transplanted with the MPKAS sarcoma cell line. (B) Tumor volume of MPKAS in Tlr5−/− or WT mice at day 14 (n≥26/group). (C-E) WT and Tlr5−/− mice were gavaged daily for two weeks with an antibiotic cocktail (ABX) to eliminate the commensal microbiota or with autoclaved H2O prior to the initiation of MPKAS tumors, antibiotic depletion was continued throughout the course of tumor progression. IL-6 serum levels in mice 14 days after initiation of MPKAS tumors (C), tumor growth kinetics (D), and total γδ T cells in the draining axillary and brachial lymph node in mice 14 days after initiation of MPKAS tumors (E) are shown. Data are representative of at least three experiments with 5 mice/group. (F) Growth kinetics of MPKAS tumors in Tcrd−/− or Tlr5−/−/Tcrd−/− mice compared to the appropriate WT and Tlr5−/− littermate controls. Data are representative of 2 individual experiments with at least 5-8 mice/group. (G) Volume of tumors 14 days after transplantation of MPKAS tumor cells alone or together with WT or Tlr5−/− tumor-associated γδ T cells into the auxiliary flank of naïve WT mice. (H) Tumor growth curve of MPKAS cells admixed with tumor-associated γδ T cells sorted from WT or Tlr5−/− tumor-bearing mice injected into the axillary flank of Tcrd−/− or Tlr5−/−/Tcrd−/− mice and representative resected tumors 14 days after the implantation. (I) Total galectin-1+ γδ T cells from tumor draining lymph nodes of WT or Tlr5−/− mice with advanced autochthonous sarcomas. (J) γδ T cells were sorted from the draining lymph nodes of WT or Tlr5−/− mice bearing advanced autochthonous sarcomas and cultured for 6 hr with PMA/Ionomycin. Supernatants were collected and assayed for galectin-1 levels. All data represents the mean ± SEM. * p < .05, ** p < .01, *** p < .001 using Mann Whitney test. See also Figure S2.
Fig 4
Fig 4. Galectin-1 producing γδ T cells are sufficient to promote accelerated TLR5-mediated malignant progression
(A-B) Scatter plots (A) and MFI (B) of intracellular galectin-1 expression of naïve γδ T cells sorted from pooled axillary and inguinal lymph nodes of WT mice and incubated directly (Cell:Cell) or separated by a transwell insert (Transwell) for 5 days with MDSC sorted from the spleens of WT mice carrying advanced autochthonous sarcomas or with bone marrow derived dendritic cells from naïve WT mice (BMDC). (C) MFI of intracellular galectin-1 expression from naive γδ T cells co-cultured with monocytic- (Ly6C+Ly6G) and granulocytic- (Ly6ClowLy6G+) MDSCs from tumor-bearing WT mice or with total MDSC from tumor-bearing Tlr5−/− mice. PMN and Monocytes were sorted from the spleens of naïve WT mice as controls. (D) Total galectin-1+ γδ T cells in the draining lymph nodes of WT MPKAS tumor-bearing mice depleted of MDSCs (αGr1). (E) Representative MPKAS tumor growth curve in WT mice depleted of MDSCs. (F) Representative tumor growth curve after reconstitution of Trp53flx/flx;LSL-KrasG12D/+ mice with bone marrow from WT or Lgals1−/− mice admixed (1:1) with Tcrd−/− bone marrow, followed by tumor initiation with adenovirus-Cre. (G-H) γδ T cells sorted from the draining lymph nodes of WT or Tlr5−/− mice bearing advanced autochthonous sarcomas or D14 MPKAS tumors and were incubated at a 10:10:1 ratio with Cell-tracker violet-labeled endogenous tumor-reactive T cells sorted from advanced sarcoma-bearing mice incubated with MPKAS-pulsed dendritic cells (G) or OT-1 T cells and BMDCs pulsed with full-length Ovalbumin (H) and proliferation of tumor-reactive T cells was measured by flow cytometric analysis five days later. Data are representative of 2 independent experiments (5 mice, total). All data represent mean ± SEM. * p < .05, ** p < .01, *** p < .001 (Mann Whitney). See also Figure S3.
Fig. 5
Fig. 5. Tumor- and leukocyte-derived IL-6 drives tumor growth in TLR5-responsive mice
(A) Growth kinetics of the mammary tumor cell line A7C11 in WT or Tlr5−/− mice. (B) Serum IL-6 level of WT or Tlr5−/− mice bearing advanced A7C11 (day 14-16) tumors. (C) ELISA quantification of IL-6 production by indicated tumor cell lines 72 hr after over-night incubation with 100 ng/ml recombinant mouse IL-6 followed by washing of wells and the addition of fresh media. (D) Growth kinetics of MPKAS expressing IL-6 shRNA or scrambled shRNA in WT mice. (E) Serum levels of IL-6 in WT mice 14 days after injection with MPKAS expressing IL-6 shRNA or scrambled control. Representative of two independent experiments (8 mice/group, total). (F-H) Proportions of tumor-associated Gr1+CD11b+ MDSCs (F), galectin-1-producing γδ T cells (G), and IFNγ-producing CD8 T cells (H) from dissociated tumors (F) and tumor-draining lymph-nodes (G-H) 14 days after injection of WT mice with MPKAS tumor cell lines expressing IL-6 shRNA or scrambled shRNA. (I) Tumor kinetics of WT mice reconstituted with IL-6-deficient (Il6−/−) or WT BM followed by challenge with the MPKAS tumor cell line. (J) Tumor kinetics of WT or Tlr5−/− mice administered with IL-6 neutralizing antibody (α-IL-6) or isotype control IgG challenged with MPKAS tumors. All data represent mean ± SEM. * p < .05, ** p < .01, *** p < .001 (Mann Whitney). See also Figure S4.
Fig 6
Fig 6. Tumor growth for IL-6 unresponsive tumors is mediated by IL-17 induced by interactions with commensal microbiota
(A-C) Serum levels of IL-17 from WT or Tlr5−/− mice bearing advanced A7C11 mammary tumors (A), advanced MPKAS tumors (B), or advanced autochthonous sarcomas or from naïve controls (C). (D) A7C11 growth kinetics in WT and Tlr5−/− mice administered IL-17 neutralizing antibody (α-IL-17) or Ig control (IgG). (E) MPKAS tumor kinetics in WT or Tlr5−/− mice treated with α-IL-17 or IgG. (F) Growth kinetics of MPKAS tumors expressing IL-6 shRNA or scrambled shRNA in Tlr5−/− mice administered with α-IL-17 or IgG. (G) Growth kinetics of MPKAS expressing IL-6 shRNA or scrambled shRNA in Tlr5−/− mice and representative resected tumors from Tlr5−/− mice. (H) Serum levels of IL-17 in antibiotic (ABX) or vehicle treated MPKAS or A7C11 tumor-bearing mice 14 days (MPKAS) or 16 days (A7C11) post tumor initiation. (I) Growth kinetics of A7C11 tumors from WT and Tlr5−/− mice treated with ABX or vehicle. All data are representative of at least 2 repetitions with at least 4 animals/group. All data represent mean ± SEM. * p < .05, ** p < .01, *** p < .001 using Mann Whitney test. See also Figure S5.
Fig. 7
Fig. 7. TLR5-deficient patients diagnosed with breast cancer have accelerated malignant progression and increased intratumoral IL-17 levels
(A) CXCL8 transcript levels in CD14+CD45+ myeloid cells sorted from 3 heterozygous TLR5R392X or 3 TLR5-responsive advanced ovarian tumors and incubated with 500 ng/ml of flagellin for 72 hr. CXCL8 transcript levels were calculated relative to 18S expression. (B) Survival analysis of TCGA datasets for ER+ breast cancer. Differences in overall survival were calculated with Log-Rank. (C-D) Quantification of IL17A (C) or IL6 (D) transcripts relative to 18S expression in 9 frozen ER+ breast tumor specimens from TLR5R392X carriers, ≥10 randomly selected ER+ breast tumors from patients homozygous for the ancestral allele, 5-6 stage III/IV ovarian carcinoma specimens from TLR5R392X carriers and ≥15 randomly selected ovarian carcinoma specimens homozygous for the ancestral allele. (E) Serum IL-6 levels in patients homozygous for the ancestral allele of TLR5 diagnosed with ER+ breast carcinoma vs. ovarian carcinoma. All data represent mean ± SEM. * p < .05, ** p < .01, *** p < .001 (Mann Whitney). See also Figure S6.
Fig. 8
Fig. 8. Higher proportions of long-term survivors and decreased galectin-1 expression are found in TLR5-deficient patients diagnosed with ovarian cancer
(A) Survival analysis of TCGA datasets for ovarian cancer. Difference was calculated with Log-Rank. (B) Fishers’ exact test of the proportions of ovarian cancer patients surviving greater than or equal to 6 years after initial diagnosis with or without the TLR5R392X polymorphism or with or without the non-deleterious TLR5F822L polymorphism. (C) Transcript levels of LGALS1 relative to 18S levels from 6 ovarian tumor samples with TLR5R392X and 91 randomly selected ovarian tumor samples homozygous for the ancestral allele of TLR5. (D) Galectin-1 protein expression of 5 TLR5R392X ovarian tumor samples and 4 randomly selected ovarian tumor samples from patients homozygous for the ancestral allele of TLR5. Corresponding densitometric analysis of band intensities for galectin-1 normalized to vinculin. (E) γδ T cell immunohistochemistry from a frozen ovarian tumor specimen homozygous for the TLR5 ancestral allele. Scale bars, 100 μm. (F) Representative gating strategy for flow cytometric analysis of galectin-1 expressing tumor-infiltrating γδ T cells. Numbers represent the proportions of live cells gated from CD45+CD3+γδ TCR+ tumor-associated microenvironmental leukocytes, compared to isotype control. (G) Frequency of galectin-1 producing γδ T cells in the ovarian cancer microenvironment from 3 ovarian tumors from TLR5R392X carriers, PBMCs from 4 healthy donors of, and 12 randomly selected ovarian tumor samples from patients homozygous for the ancestral allele. (H) Histogram of galectin-1 expression from tumor-associated γδ T cells from the three available disassociated ovarian tumor samples from TLR5R392X carriers and 3 randomly selected ovarian tumor samples from patients homozygous for the ancestral allele of TLR5. All data represent mean ± SEM. * p < .05, ** p < .01, *** p < .001 (Mann Whitney). See also Figure S7.

Comment in

References

    1. Abt M, Osborne L, Monticelli L, Doering T, Alenghat T, Sonnenberg G, Paley M, Antenus M, Williams K, Erikson J, et al. Commensal bacteria calibrate the activation threshold of innate antiviral immunity. Immunity. 2012;37:158–170. - PMC - PubMed
    1. Casanova JL, Abel L, Quintana-Murci L. Human TLRs and IL-1Rs in host defense: natural insights from evolutionary, epidemiological, and clinical genetics. Annu Rev Immunol. 2011;29:447–491. - PubMed
    1. Clarke T, Davis K, Lysenko E, Zhou A, Yu Y, Weiser J. Recognition of peptidoglycan from the microbiota by Nod1 enhances systemic innate immunity. Nature medicine. 2010;16:228–231. - PMC - PubMed
    1. Conejo-Garcia JR, Benencia F, Courreges MC, Kang E, Mohamed-Hadley A, Buckanovich RJ, Holtz DO, Jenkins A, Na H, Zhang L, et al. Tumor-infiltrating dendritic cell precursors recruited by a beta-defensin contribute to vasculogenesis under the influence of Vegf-A. Nat Med. 2004;10:950–958. - PubMed
    1. Cubillos-Ruiz J, Engle X, Scarlett U, Martinez D, Barber A, Elgueta R, Wang L, Nesbeth Y, Durant Y, Gewirtz A, et al. Polyethylenimine-based siRNA nanocomplexes reprogram tumor-associated dendritic cells via TLR5 to elicit therapeutic antitumor immunity. The Journal of clinical investigation. 2009;119:2231–2244. - PMC - PubMed

Publication types

MeSH terms

Associated data