. 2015 Feb 6;290(6):3720-31.
doi: 10.1074/jbc.M114.577486. Epub 2014 Dec 22.

K+ congeners that do not compromise Na+ activation of the Na+,K+-ATPase: hydration of the ion binding cavity likely controls ion selectivity

Affiliations

K+ congeners that do not compromise Na+ activation of the Na+,K+-ATPase: hydration of the ion binding cavity likely controls ion selectivity

Yasser A Mahmmoud et al. J Biol Chem. .

Abstract

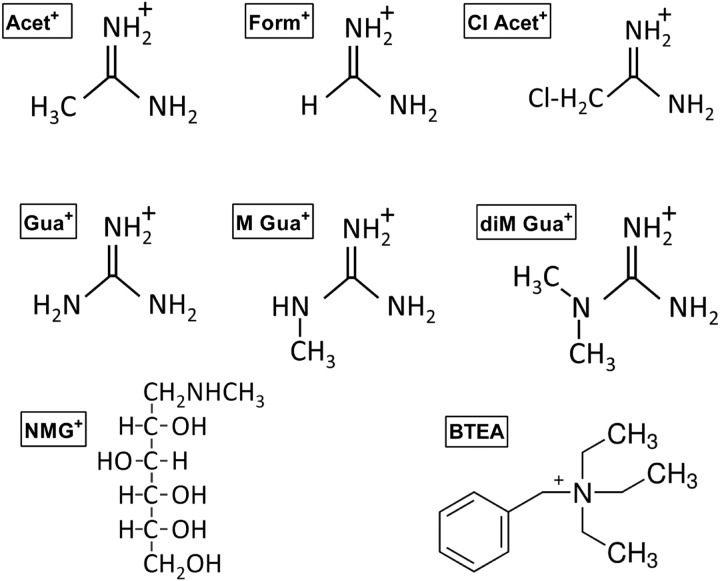
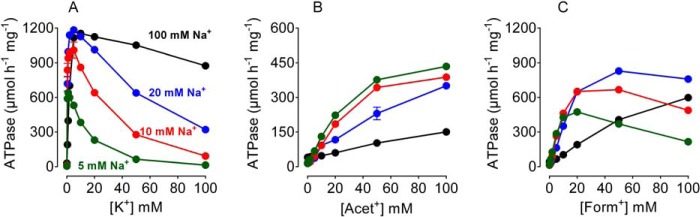
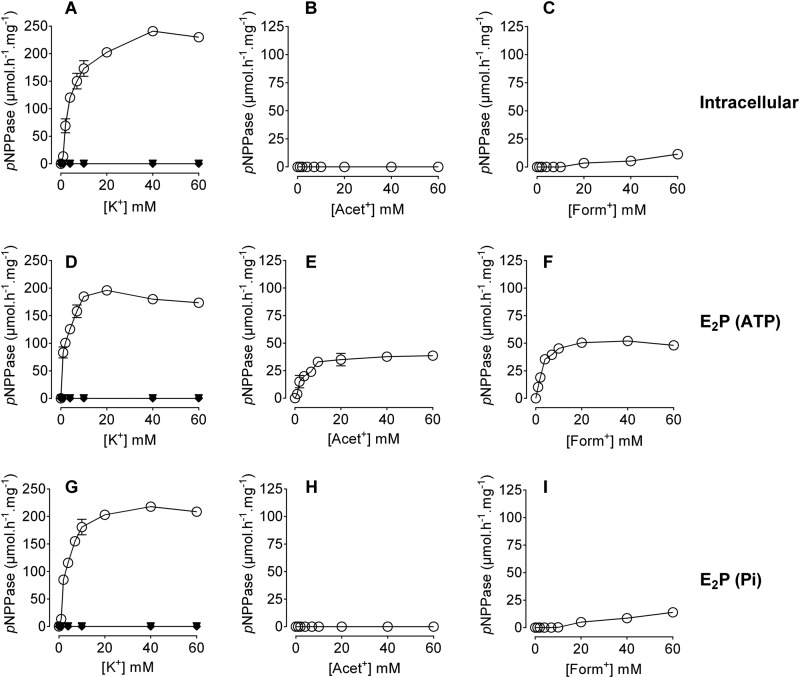
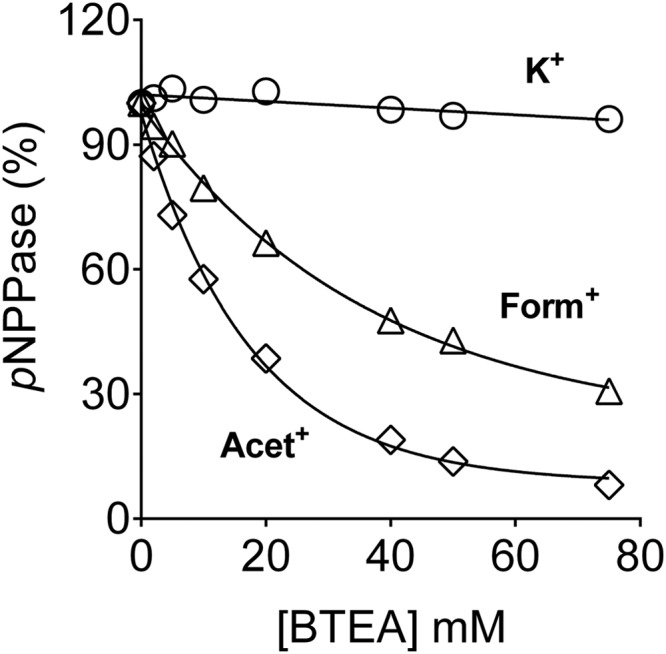
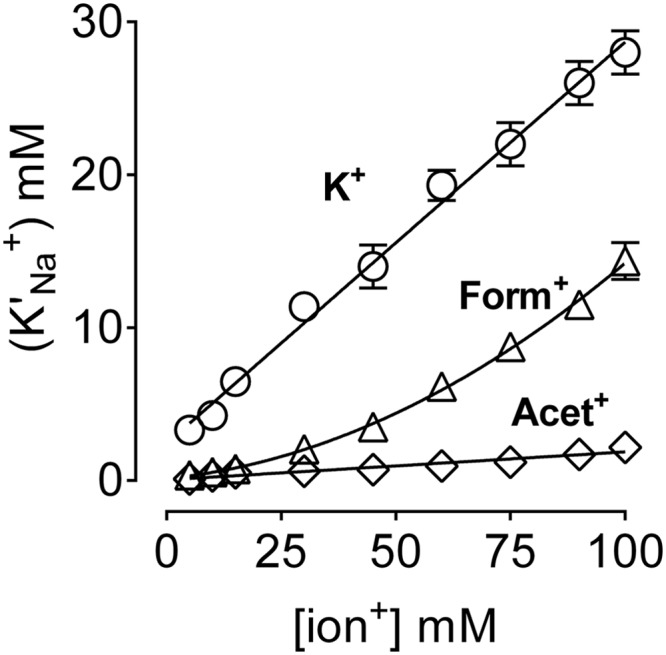
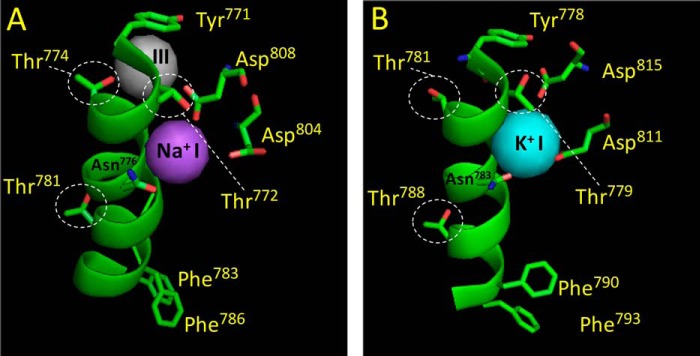
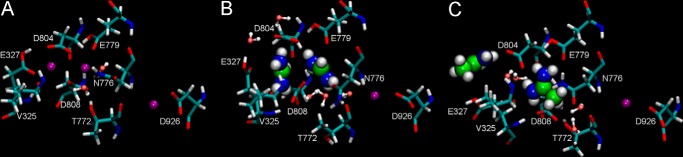
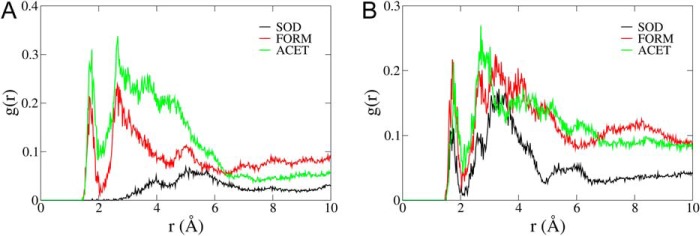
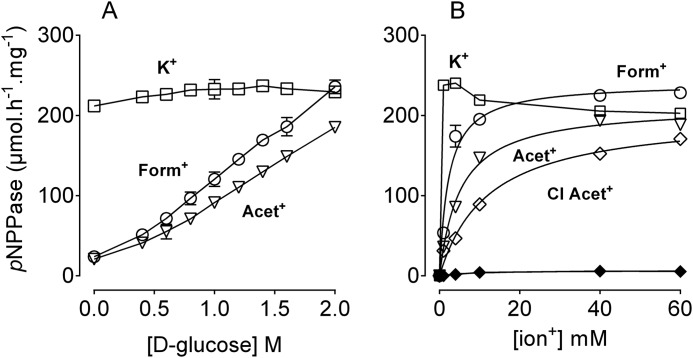
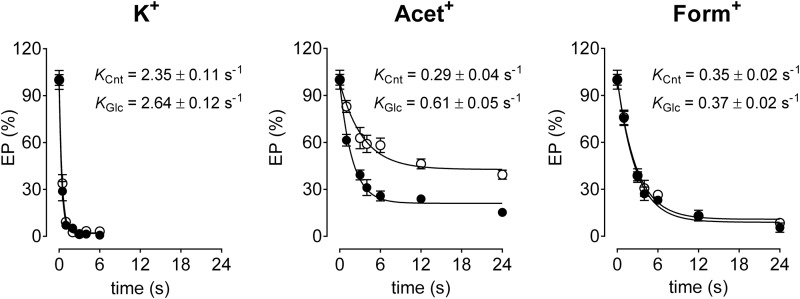
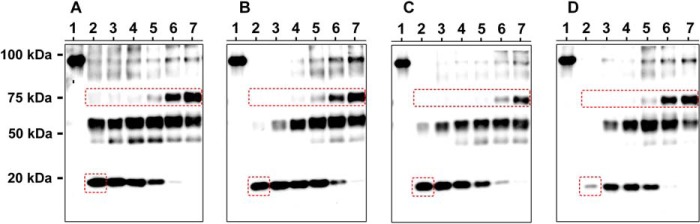
The Na(+),K(+)-ATPase is essential for ionic homeostasis in animal cells. The dephosphoenzyme contains Na(+) selective inward facing sites, whereas the phosphoenzyme contains K(+) selective outward facing sites. Under normal physiological conditions, K(+) inhibits cytoplasmic Na(+) activation of the enzyme. Acetamidinium (Acet(+)) and formamidinium (Form(+)) have been shown to permeate the pump through the outward facing sites. Here, we show that these cations, unlike K(+), are unable to enter the inward facing sites in the dephosphorylated enzyme. Consistently, the organic cations exhibited little to no antagonism to cytoplasmic Na(+) activation. Na(+),K(+)-ATPase structures revealed a previously undescribed rotamer transition of the hydroxymethyl side chain of the absolutely conserved Thr(772) of the α-subunit. The side chain contributes its hydroxyl to Na(+) in site I in the E1 form and rotates to contribute its methyl group toward K(+) in the E2 form. Molecular dynamics simulations to the E1·AlF4 (-)·ADP·3Na(+) structure indicated that 1) bound organic cations differentially distorted the ion binding sites, 2) the hydroxymethyl of Thr(772) rotates to stabilize bound Form(+) through water molecules, and 3) the rotamer transition is mediated by water traffic into the ion binding cavity. Accordingly, dehydration induced by osmotic stress enhanced the interaction of the congeners with the outward facing sites and profoundly modified the organization of membrane domains of the α-subunit. These results assign a catalytic role for water in pump function, and shed light on a backbone-independent but a conformation-dependent switch between H-bond and dispersion contact as part of the catalytic mechanism of the Na(+),K(+)-ATPase.

Keywords: ATPase; Membrane Enzyme; Membrane Protein; Na+/K+-ATPase; Potassium Transport.


Figures

FIGURE 1.
FIGURE 1.
Schematic structure of the organic cations used in this study. Organic cations that bind and occlude in the K+ sites of the Na+,K+-ATPase are acetamidinium, formamidinium, and chloroacetamidinium. Organic cations that do not occlude in the pump but inhibit K+ interaction are guanidinium (Gua), methyl guanidinium (M Gua+), dimethyl guanidinium (diM Gua), N-methyl-d-glucamine, and BTEA.
FIGURE 2.
FIGURE 2.
ATPase activity in the presence of K+/congeners. Ouabain-dependent ATPase activity was measured at 37 °C in the presence of 3 mm MgATP, 30 mm histidine buffer, pH 7.2, 2 μg of protein, and the indicated concentrations of K+, Acet+, or Form+. All reactions were performed in the presence of four different Na+ concentrations as indicated. Data are mean ± S.E. (smaller than symbol sizes) of four measurements. A representative of three independent measurements is shown.
FIGURE 3.
FIGURE 3.
Ion-dependent pNPPase activity. pNPPase assays were performed in the presence of 50 mm Tris-HCl, 7 mm pNPP, 7 mm MgCl2, 5 μg of protein, and the indicated concentrations of ions. Panels A–C depict activity of the dephosphorylated enzyme (intracellular) in the presence of the indicated concentrations of K+ (A), Acet+ (B), or Form+ (C). Panels D–F depict activity of enzyme phosphorylated from ATP (E2P-ATP), in the presence of the indicated concentrations of K+ (D), Acet+ (E), or Form+ (F). Panels G–I depict activity of enzyme phosphorylated from inorganic phosphate (E2P-Pi), in the presence of the indicated concentrations of K+ (G), Acet+ (H), or Form+ (I). Data are presented as μmol of pNPP h−1 (mg protein)−1 and are mean ± S.E. of three measurements. Closed squares, circles, diamonds, and triangles (superimposed) indicate pNPPase activity measured in the presence of the same concentrations of NMG, Gua+, M-Gua+, and diM-Gua+, respectively. A representative of four independent measurements is shown.
FIGURE 4.
FIGURE 4.
Effect of blocking the outward facing sites with BTEA on residual pNPPase activity. Assays were performed as described in the legend to Fig. 3, D–F, but in the presence of 25 mm K+, Acet+, or Form+, and the indicated concentrations of BTEA. Data are presented as percentage of control, measured in the absence of BTEA, and are mean ± S.E. of three measurements. A representative of three independent measurements is shown.
FIGURE 5.
FIGURE 5.
Kinetic analysis of inhibition of cytoplasmic Na+ activation. Na+ activation curves were performed in the presence of 50 mm Tris-HCl, pH 7.2, 3 mm MgATP, different K+/congener concentrations, and Na+ concentrations ranging from 0 to 100 mm. The apparent affinity of Na+ (KNa+) was calculated as previously described (6) and plotted against the K+/congener concentration, as indicated. The curves of K+ and Acet+ were analyzed using the straight line equation: KNa = KoNa + (KoNa/KK) (see text). Data are mean ± S.E. of four KNa values.
FIGURE 6.
FIGURE 6.
Rotamer transitions revealed by the high-resolution crystal structures of the Na+,K+-ATPase. Site I coordination in the E1·AlF4·ADP·3Na+ structure (A, PDB code 3WGU, Ref. 18), and the E2·MgF42−·2K+ structure (B, PDB code 2ZXE, Ref. 30). The figure shows site I and the position of important M5 residues as well as the side chains of Thr781, Phe783, and Phe786 (kidney sequence), located near the extracellular surface. A, the hydroxyl group of Thr772 is coupled to a Na+ in site I. The hydroxyl group of Thr774 is contacting a Na+ in site III (shown in gray). The side chains of Phe783 and Phe786 bend toward the extracellular side. B, the methyl group of Thr772 is connected to a K+ in site I through water molecules. The side chain of Thr781 is disconnected from “empty site III.” The side chains of Phe790 and Phe793 (shark sequence) are moved toward the cytoplasm (compare with their position to that in the E1 structure). Note that the side chain of Thr781 (Thr788 in the shark sequence), located away from the cytoplasmic side, does not adopt rotamer transition, i.e. the side chain has the identical position in both structures. Note the close proximity of Asp808 (Asp815 in the shark sequence) to the Na+ in site I compared with its position in the E2 structure, this insertion (likely facilitated by the movement of M6) seems to regulate the traffic of water molecules into the binding cavity around site I. Note also that the side chain of Asn776 also seems to adopt a rotation, directing the side chain hydroxyl toward K+ in site I in the E2 structure (Asn783 in shark sequence). The figure was made using PyMOL.
FIGURE 7.
FIGURE 7.
Last snapshots (t = 50 ns) from the simulated systems viewed from the cytoplasm: A, sodium; B, FORM; C, ACET. Bound sodium ions are shown as purple spheres. Note the deflection of the third Na+ ion toward Asp926, with respect to its location in the crystal structure (18). Ion binding residues are shown in licorice and organic cations as bigger spheres (carbon is shown in green, nitrogen in red, and hydrogen in white). Water molecules within the binding sites are shown as small red (oxygen)-white (hydrogen) spheres.
FIGURE 8.
FIGURE 8.
Radial distribution functions between (A) Asp804 and (B) Asp808 and water molecules. Both residues are significantly more hydrated in the presence of the organic cations.
FIGURE 9.
FIGURE 9.
Dehydration facilitates organic cation interaction with the outward facing sites. A, assays were performed as described in the legend to Fig. 3, D–F, but in the presence of 25 mm K+/congener, 5 μg of protein (stabilized in the E2P form, see “Experimental Procedures”), and the indicated concentrations of d-glucose. B, assays were performed in the presence of 2 m glucose, and the indicated concentrations of ions. Open and closed diamonds indicate Cl-Acet+-mediated pNPPase activity in the presence or absence of glucose. A representative of four independent measurements is shown.
FIGURE 10.
FIGURE 10.
Effect of ions and dehydration on the dephosphorylation rate. Pig kidney enzyme was phosphorylated as described under “Experimental Procedures.” Phosphorylated enzyme was diluted for the indicated time intervals in media containing K+, Acet+, or Form+, producing a final cation concentration of 1 mm (open circles), as indicated. Closed circles indicate dephosphorylation of the enzyme as above, but with diluting solution containing glucose, producing a final concentration of 15%. Data were analyzed using a monoexponential decay function, giving the indicated rate constants of phosphoenzyme hydrolysis for control (KCnt) or in the presence of glucose (KGlc).
FIGURE 11.
FIGURE 11.
Exhaustive trypsin cleavage of the α-subunit in the presence of K+/congeners. Immunoblot showing proteolytic cleavage patterns of the α-subunit in the presence of the different ions, using an antibody against the C terminus of the α-subunit. Lanes 1 indicate controls where water replaced trypsin (intact α-subunit). Lanes 2–7 indicate proteolytic reactions performed in the presence of 0, 6.48, 12.24, 16.48, 22.24, and 28.48% glucose, respectively. The indicated approximate molecular weights of the fragments were estimated by using Bio-Rad precision plus protein standard, as indicated. Note the almost complete cleavage of the 19-kDa fragment in the case of Cl-Acet+ (D, red square) and the dehydration-mediated exposure of an N-terminal site in the α-subunit, producing a 75-kDa fragment (red rectangles). The intensity (normalized to that obtained with 30 mm K+) of the 19-kDa fragment in the absence of glucose is 100, 69 ± 5, 86 ± 6, and 3 ± 1% for panels A–D, respectively. A representative of three independent measurements is shown.

References

    1. Kühlbrandt W. (2004) Biology, structure, and mechanism of P-type ATPases. Nat. Rev. Mol. Cell Biol. 5, 282–295 - PubMed
    1. Kaplan J. H. (2002) Biochemistry of the Na+,K+-ATPase. Annu. Rev. Biochem. 71, 511–535 - PubMed
    1. Geering K. (2008) Functional roles of Na+,K+-ATPase subunits. Curr. Opin. Nephrol. Hypertens. 17, 526–532 - PubMed
    1. Jorgensen P. L., Pedersen P. A. (2001) Structure-function relationships of Na+, K+, ATP, or Mg2+ binding and energy transduction in Na+,K+-ATPase. Biochim. Biophys. Acta 1505, 57–74 - PubMed
    1. Yu H., Ratheal I. M., Artigas P., Roux B. (2011) Protonation of key acidic residues is critical for the K+ selectivity of the Na+/K+-pump. Nat. Struct. Mol. Biol. 18, 1159–1163 - PMC - PubMed

Publication types