. 2015 Feb 13;290(7):4163-77.
doi: 10.1074/jbc.M114.626929. Epub 2014 Dec 22.

The FBXL10/KDM2B scaffolding protein associates with novel polycomb repressive complex-1 to regulate adipogenesis

Affiliations

The FBXL10/KDM2B scaffolding protein associates with novel polycomb repressive complex-1 to regulate adipogenesis

Takeshi Inagaki et al. J Biol Chem. .

Abstract

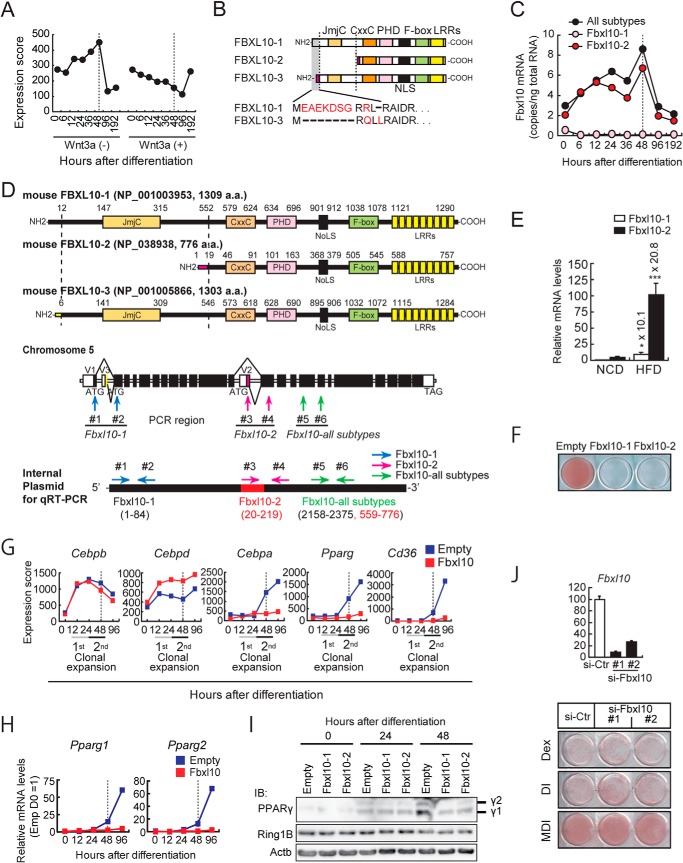
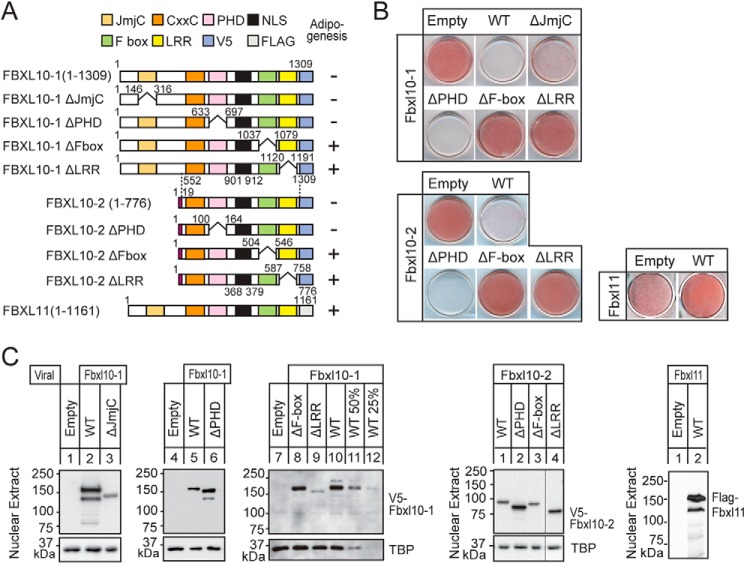
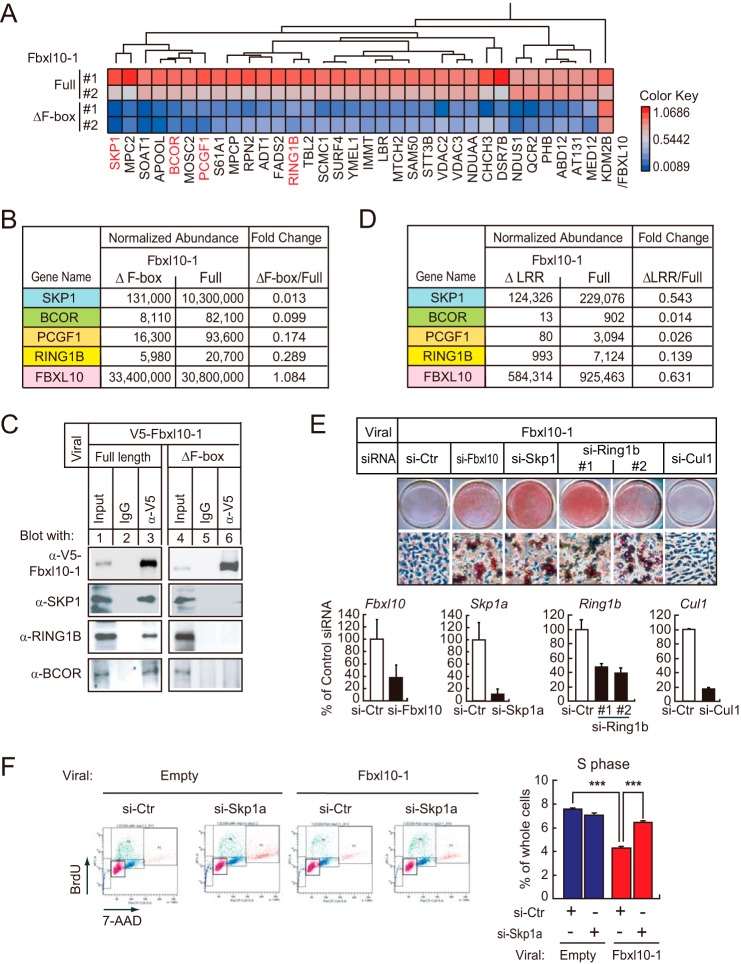
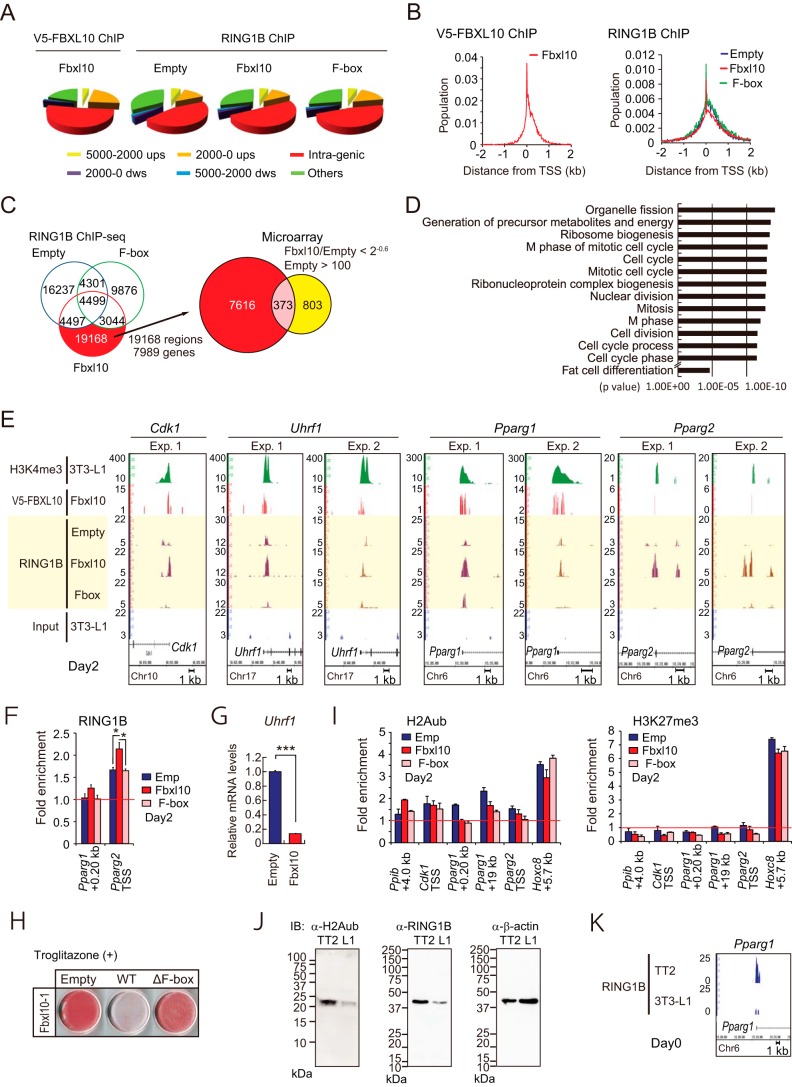
Polycomb repressive complex 1 (PRC1) plays an essential role in the epigenetic repression of gene expression during development and cellular differentiation via multiple effector mechanisms, including ubiquitination of H2A and chromatin compaction. However, whether it regulates the stepwise progression of adipogenesis is unknown. Here, we show that FBXL10/KDM2B is an anti-adipogenic factor that is up-regulated during the early phase of 3T3-L1 preadipocyte differentiation and in adipose tissue in a diet-induced model of obesity. Interestingly, inhibition of adipogenesis does not require the JmjC demethylase domain of FBXL10, but it does require the F-box and leucine-rich repeat domains, which we show recruit a noncanonical polycomb repressive complex 1 (PRC1) containing RING1B, SKP1, PCGF1, and BCOR. Knockdown of either RING1B or SKP1 prevented FBXL10-mediated repression of 3T3-L1 preadipocyte differentiation indicating that PRC1 formation mediates the inhibitory effect of FBXL10 on adipogenesis. Using ChIP-seq, we show that FBXL10 recruits RING1B to key specific genomic loci surrounding the key cell cycle and the adipogenic genes Cdk1, Uhrf1, Pparg1, and Pparg2 to repress adipogenesis. These results suggest that FBXL10 represses adipogenesis by targeting a noncanonical PRC1 complex to repress key genes (e.g. Pparg) that control conversion of pluripotent cells into the adipogenic lineage.

Keywords: 3T3-L1 cells; Adipocyte; Adipogenesis; Cell Differentiation; FBXL10/KDM2B/JHDM1B; Mitotic Clonal Expansion (MCE); Peroxisome Proliferator-activated Receptor (PPAR); Polycomb; Polycomb Repressive Complex 1 (PRC1); RING1B.


Figures

FIGURE 1.
FIGURE 1.
FBXL10 is a novel anti-adipogenic factor. A, Fbxl10 gene expression during 3T3-L1 adipogenesis. Total RNA was extracted from 3T3-L1 cells at indicated time points of differentiation (0, 12, 24, 48 and 96 h after induction of differentiation), and transcriptional analyses were carried out using a microarray. B, schematic representations of three FBXL10 isoforms (FBXL10-1; NP_001003953, FBXL10-2; NP_038938, and FBXL10-3; NP_001005866). C and D, expression of Fbxl10 isoforms during 3T3-L1 preadipocytes differentiation (C). The PCR data were quantified based on standard curves generated by using serial dilutions of internal plasmid DNA containing both unique sequences of FBXL10-1 and FBXL10-2 and common sequences for all subtypes (D) as described under “Experimental Procedures.” The data were converted to copy the number/ng of total RNA (C). D, transcript variants of mouse FBXL10. JmjC, jumonji C domain; CxxC, ZF-CXXC domain; PHD, plant homeodomain; NoLS, nucleolar localization signal; LRR, leucine-rich repeat (top). The exons and introns of mouse Fbxl10 are shown in the middle panel. The first exon of each variant is indicated as V1, V2, and V3. Coding region is indicated as filled column and noncoding region is indicated as open column. Primers for qPCR (#1, #2 for FBXL10-1-specific; #3, #4 for FBXL10-2-specific, and #5, #6 for Fbxl10 all subtypes common sequence) are indicated by arrows (middle panel). Internal control plasmid for qPCR is indicated in the bottom panel. Internal sequences (nucleotides 1622–1651) of FBXL10-1 are replaced by FBXL10-2-specific nucleotides (nucleotides 20–49). E, Fbxl10 is expressed in white adipose tissue (WAT) of mice and down-regulated in diet-induced obese mice. Matched littermates were fed with a normal (NCD) or HFD for 8 weeks, and gene expressions of FBXL10-1 and FBXL10-2 in white adipose tissue were analyzed with qPCR (n = 6 mice per group). Ppib serves as the internal control for qPCR. Error bars represent ± S.E. (*, p < 0.05; ***, p < 0.001). F, ORO staining of 3T3-L1 preadipocytes stably expressing FBXL10-1, FBXL10-2, or empty vector was performed on day 8 of differentiation. G, transcriptional changes of adipogenic genes in FBXL10-1-transduced preadipocytes during adipogenesis. Cells were harvested at the indicated times of differentiation, and transcriptional analyses were carried out using a microarray. H, mRNA levels of Pparg1 and Pparg2 in 3T3-L1 preadipocytes stably expressing FBXL10-1 or empty vector at indicated time points during differentiation were measured by qPCR The mRNA values are depicted relative to mRNA in empty 3T3-L1 preadipocytes at day 0 of differentiation, which was arbitrarily defined as 1. Data represent mean ± S.E. of three technical replicates (error bars are too tiny to see). I, PPARγ and RING1B protein levels in FBXL10-overexpressing 3T3-L1 preadipocytes. Whole cell lysates from 3T3-L1 preadipocytes stably expressing FBXL10-1, FBXL10-2, or empty vector at indicated hours after induction for differentiation were subjected to immunoblot (IB) analysis. J, 3T3-L1 cells were reverse-transfected at a density of 3 × 10⁵ cells/6-well plates with siRNAs for Fbxl10 (si-Fbxl10 #1 and #2) (20 nm) or the siRNA negative control (si-Ctr) using Lipofectamine RNAi MAX (Invitrogen). Knockdown efficiency of Fbxl10 in each 3T3-L1 preadipocyte was determined by qPCR. Data are presented as relative percentage of control siRNA-transfected cells (top panel). Cells were induced to differentiate with dexamethasone (DEX), DEX plus insulin (DI), or MDI and were stained with ORO at day 8 of differentiation (bottom panel).
FIGURE 2.
FIGURE 2.
Effects of FBXL10 expression on cell growth and mitotic clonal expansion of 3T3-L1 preadipocytes. A and B, effect of FBXL10 expression on cell growth of 3T3 L1 cells (A) and mitotic clonal expansion (B). 3T3-L1 preadipocyte overexpressions of FBXL10-1 (left panel) or FBXL10-2 (right panel) were plated at densities of 5 × 10⁴ cells in 6-well plates, and cell numbers were counted every 24 h. To examine the effect of FBXL10 expression on mitotic clonal expansion, 2 days post-confluent transduced 3T3-L1 preadipocytes were induced for differentiation, and cell numbers were counted every 12 h. C and D, fluorescence-activated cell sorting analysis (FACS) performed with 3T3-L1 preadipocytes overexpressing FBXL10-1 (C) or FBXL10-2 (D) in comparison with those overexpressing empty vector as described under “Experimental Procedures.” Purple indicates cells at G0/G1 phase; green indicates cells at S phase; blue indicates cells at G2/M phase (C and D, left panels). The ratios of the cells at S phase of FBXL10-1 (C, right panel) or FBXL10-2 (D, right panel)-overexpressed 3T3-L1 preadipocytes during differentiation are shown. Data represent ± S.E. of three technical replicates. **, p < 0.01 compared with control. E, cell cycle analysis using FACS with 3T3-L1 preadipocytes overexpressing FBXL10-1 (left panel) or FBXL10-2 (right panel) at day 2 of differentiation, as described in B and C, showing the ratio of the cells at G2/M phase. Data represent mean ± S.E. of three technical replicates. *, p < 0.05 compared with control. F, expression of genes involved in the cell cycle in FBXL10-1-transduced 3T3-L1 preadipocytes. At 48 h of induction, cells were harvested for isolation of total RNA and used for reverse transcription and qPCR. Mouse cyclophilin mRNA was used as the invariant control. The mRNA values are depicted relative to mRNA in empty vector transduced 3T3-L1 preadipocytes, which are arbitrarily defined as 1. Each bar represents mean ± S.E. of three technical replicates. *, p < 0.05; **, p < 0.01; ***, p < 0.001 compared with control.
FIGURE 3.
FIGURE 3.
F-box and LRR-dependent inhibition of adipogenesis by FBXL10. A, schematic representations of wild-type FBXL10-1 and -2 isoforms and their different mutants and FBXL11. B, 3T3-L1 preadipocytes overexpressing V5-tagged wild-type FBXL10-1, -2, their mutants, and FLAG-tagged FBXL11 were induced for differentiation with MDI mixture as described, and ORO was performed at day 8. C, expressions of transduced proteins were assessed by immunoblot analysis with anti-V5 or anti-FLAG. In lanes 9–12, sequentially diluted lysates from 3T3-L1 preadipocytes expressing full-length FBXL10-1 are shown as the standard to estimate the protein level of ΔLRR-FBXL10-1. Equal loading of the proteins were confirmed by the detection of nuclear protein TATA-binding protein (TBP).
FIGURE 4.
FIGURE 4.
FBXL10/KDM2B forms a noncanonical PRC1 complex in 3T3-L1 preadipocytes containing RING1B and SKP1 via F-box and LRRs. A–D, FBXL10 in 3T3-L1 associates with a variant PRC1 complex containing RING1B, BCOR/BCORL1, PCGF1, and SKP1. 3T3-L1 preadipocytes overexpressing either V5-tagged full-length FBXL10 (Full) or F-box deletion mutant (ΔF-box) were immunoprecipitated by anti-V5 and then subjected to mass spectrometry as described under “Experimental Procedures.” A, heat map representing identified protein whose abundance was 3-fold higher in full-length FBXL10 relative to that in ΔF-box (n = 2). B and D, abundance of peptides co-immunoprecipitated was normalized by ProgenesisTM software (Nonlinear Dynamics, Newcastle, UK) using those of the FBXL10 peptide peaks (LAGLDITDVSLR(2+), ASSLQTSPGSSSHLS(3+), IKESEGVVNDELPNC(3+)) as a control. B, normalized abundance of SKP1, BCOR, PCGF1, or RING1B co-immunoprecipitated with either full-length or ΔF-box FBXL10. C, immunoblot analysis verifying that FBXL10 interacts with RING1B, SKP1, and BCOR. Full-length or ΔF-box FBXL10-1 was immunoprecipitated by anti-V5 or mouse IgG cross-linked with Dynabeads protein G. Aliquots of protein were subjected to SDS-PAGE followed by immunoblot analysis using anti-V5, anti-SKP1 (#2156), anti-BCOR (SAB4502272), or anti-RING1B (#5694). D, identified proteins (SKP1, BCOR, PCGF1, and RING1B) that interact with FBXL10 dependently of LRRs domain of FBXL10. 3T3-L1 preadipocytes overexpressing V5-tagged full-length FBXL10 (Full) and LRR deletion mutant (ΔLRR) were immunoprecipitated with anti-V5 and then subjected to mass spectrometry and the abundance of peptides were normalized. E, 3T3-L1 preadipocyte-transduced FBXL10-1 was transfected with siRNA specifically targeting Fbxl10, Skp1, Ring1b, or Cul1 or control siRNA. Cells were induced to differentiate with MDI and were stained with ORO at day 8 of differentiation (top panel). Knockdown efficiency of Fbxl10, Skp1, Ring1b, and Cul1 in 3T3-L1 preadipocytes overexpressing FBXL10-1 at day 0 of differentiation was determined by qPCR. Data were presented as relative percentage of control siRNA-transfected cells (bottom panel). F, cell cycle analysis using FACS performed with FBXL10-1 overexpressed 3T3-L1 preadipocytes in comparison with those overexpressing empty vector transfected with control siRNA or siRNA targeting Skp1 at 48 h of induction by MDI mixture as described in the legends to Fig. 2, C and D (left panel). The ratio of the cells at S phase of cells at 48 h after induction are shown (right panel). Data represent S.E. of three technical replicates. ***, p < 0.001 compared with control.
FIGURE 5.
FIGURE 5.
FBXL10 represses Cdk1, Uhrf1, Pparg1, and Pparg2 expression via F-box-dependent recruitment of RING1B. A and B, genome-wide distributions of binding sites of V5-FBXL10 in 3T3-L1 preadipocytes transduced with V5-FBXL10-1 (A) or those of RING1B in 3T3-L1 preadipocytes transduced with empty, wild type, or ΔF-box FBXL10 (B) as determined by ChIP-seq. ups, upstream; dws, downstream. C and D, Ring1B ChIP-seq and transcriptional microarray analysis performed in 3T3-L1 preadipocytes stably expressing wild-type (FBXL10) or F-box deletion (ΔF-box) FBXL10-1 or empty vector (Empty) at day 2 of differentiation. C, Venn diagram showing number of RING1B-binding sites identified with SICER in transduced 3T3-L1 preadipocytes (left panel). Full-length FBXL10-1-induced RING1B-binding sites (19168 sites) were annotated to 7,989 genes. The number of RING1B-binding genes depending on V5-tagged wild-type FBXL10-1 expression and the number of genes suppressing more than 2−0.6 in FBXL10-1 transduced cells are shown in the Venn diagram in the right panel. All transcripts with average difference call below 100 in empty 3T3-L1 preadipocytes were excluded. D, histogram displaying fold enrichment values for GO term analysis of the genes that are down-regulated more than 2−0.6 in FBXL10-1-overexpressing 3T3-L1 preadipocytes relative to those of control cells. E, ChIP-seq profiles for H3K4me3, V5-FBXL10, and RING1B on Cdk1, Uhrf1, Pparg1, and Pparg2 genomic regions. 3T3-L1 preadipocytes stably expressing wild-type (FBXL10) or F-box deletion mutant (ΔF-box) FBXL10-1, or empty vector (Empty) at day 2 of differentiation were subjected to ChIP-seq analysis. ChIP-seq using anti-RING1B antibody was performed twice (Exp. 1 and Exp. 2) and presented with ChIP-seq profiles for H3K4me3 and V5-FBXL10. Scale bars indicate 1 kb. F, ChIP-qPCR analysis of RING2B on the Pparg1 and Pparg2 genes using set of primers that amplifies TSS (as listed in Table 2) in 3T3-L1 preadipocytes at day 2. Data are normalized to precipitated DNA (fold enrichment). Error bars represent ± S.E. of three technical replicates. *, p < 0.05 compared with control. G, qPCR of Uhfr1 in 3T3-L1 preadipocytes stably expressing FBXL10-1 or empty vector. The mRNA values are depicted relative to mRNA in the control group (empty vector), which is arbitrarily defined as 1. Data represent ± S.E. of three technical replicates. ***, p < 0.001 compared with control. H, 3T3-L1 preadipocytes overexpressing wild type or ΔF-box FBXL10 were induced for differentiation with MDI and 1 μm troglitazone, and ORO was performed at day 8. I, ChIP-qPCR analysis of H2Aub (left panel) and H3K27me3 (right panel) on the Ppib, Cdk1, Pparg1, Pparg2, and HoxC8 genes using set of primers as listed in Table 2 in 3T3-L1 preadipocytes at day 2. Data are normalized to precipitated DNA (fold enrichment). Error bars represent ± S.E. of three technical replicates. J, immunoblot (IB) analysis of H2AK119ub (left panel) and RING1B (middle panel) in 3T3-L1 preadipocytes and TT2 ES cells using either anti-H2Aub (catalog no. 8240, Cell Signaling Technology) or anti-H3K27me3 (catalog no. 07449, Millipore) antibody. Equal loading of the proteins was confirmed by the detection of β-actin (ACTB; A5441) (right panel). K, ChIP-seq profiles of RING1B on PPARg1 genomic region in TT2 ES cells or 3T3-L1 preadipocytes (day 0). Scale bars indicate 1 kb.

References

    1. Rosen E. D., MacDougald O. A. (2006) Adipocyte differentiation from the inside out. Nat. Rev. Mol. Cell Biol. 7, 885–896 - PubMed
    1. Wu Z., Rosen E. D., Brun R., Hauser S., Adelmant G., Troy A. E., McKeon C., Darlington G. J., Spiegelman B. M. (1999) Cross-regulation of C/EBPα and PPARγ controls the transcriptional pathway of adipogenesis and insulin sensitivity. Mol. Cell 3, 151–158 - PubMed
    1. Tang Q. Q., Otto T. C., Lane M. D. (2003) Mitotic clonal expansion: a synchronous process required for adipogenesis. Proc. Natl. Acad. Sci. U.S.A. 100, 44–49 - PMC - PubMed
    1. MacDougald O. A., Lane M. D. (1995) Transcriptional regulation of gene expression during adipocyte differentiation. Annu. Rev. Biochem. 64, 345–373 - PubMed
    1. Rosen E. D., Spiegelman B. M. (2006) Adipocytes as regulators of energy balance and glucose homeostasis. Nature 444, 847–853 - PMC - PubMed

Publication types

MeSH terms