. 2015 Feb 27;290(9):5582-91.
doi: 10.1074/jbc.M114.592741. Epub 2014 Dec 22.

Insulin regulates nitric oxide production in the kidney collecting duct cells

Affiliations

Insulin regulates nitric oxide production in the kidney collecting duct cells

Gaurav Pandey et al. J Biol Chem. .

Abstract

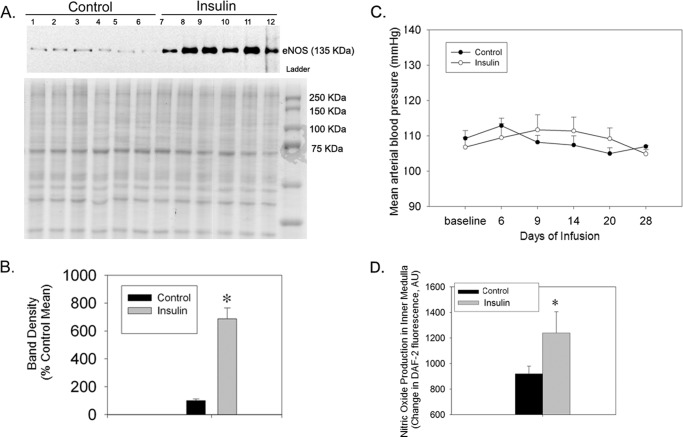
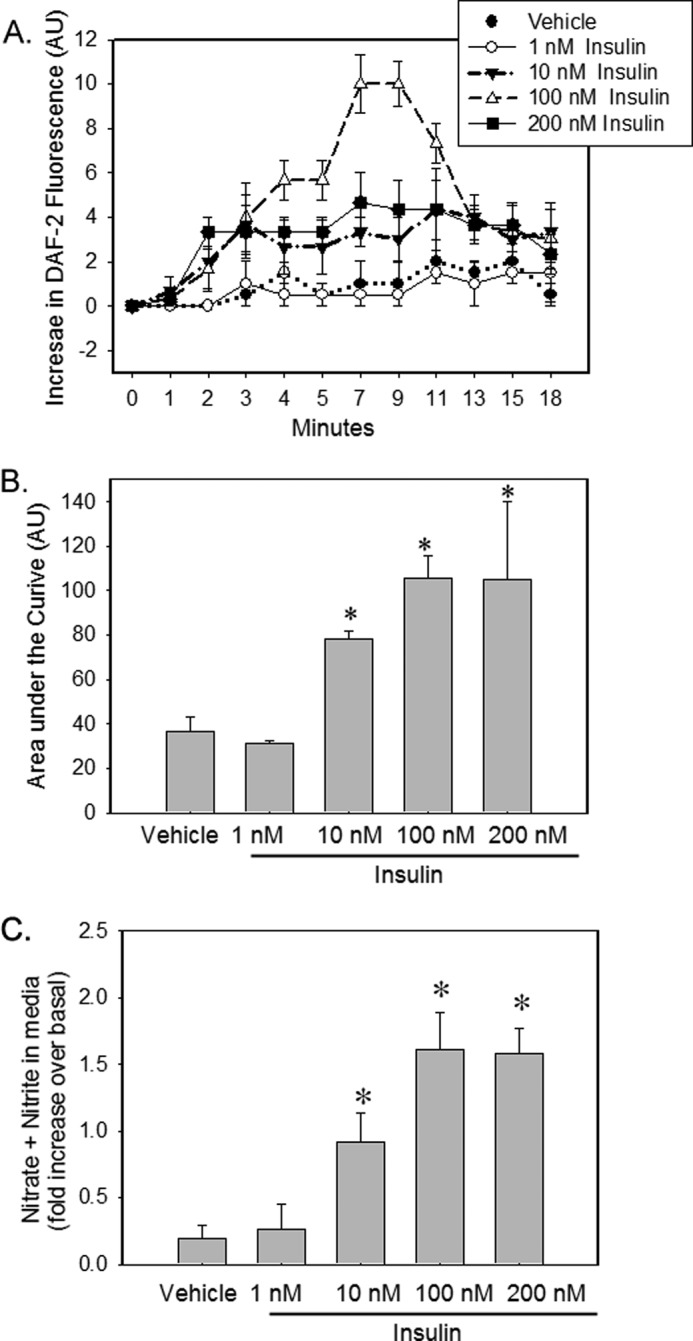
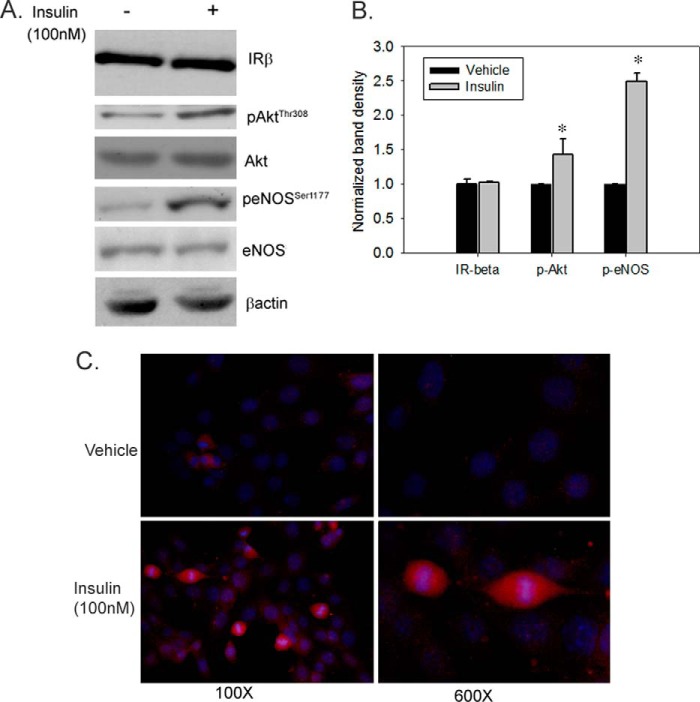
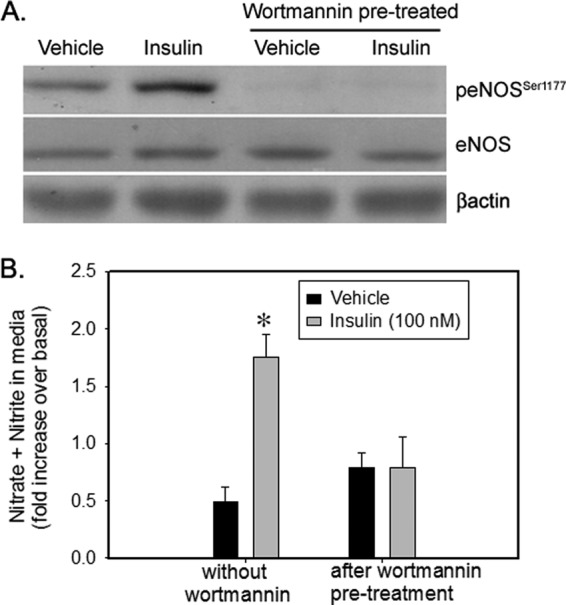
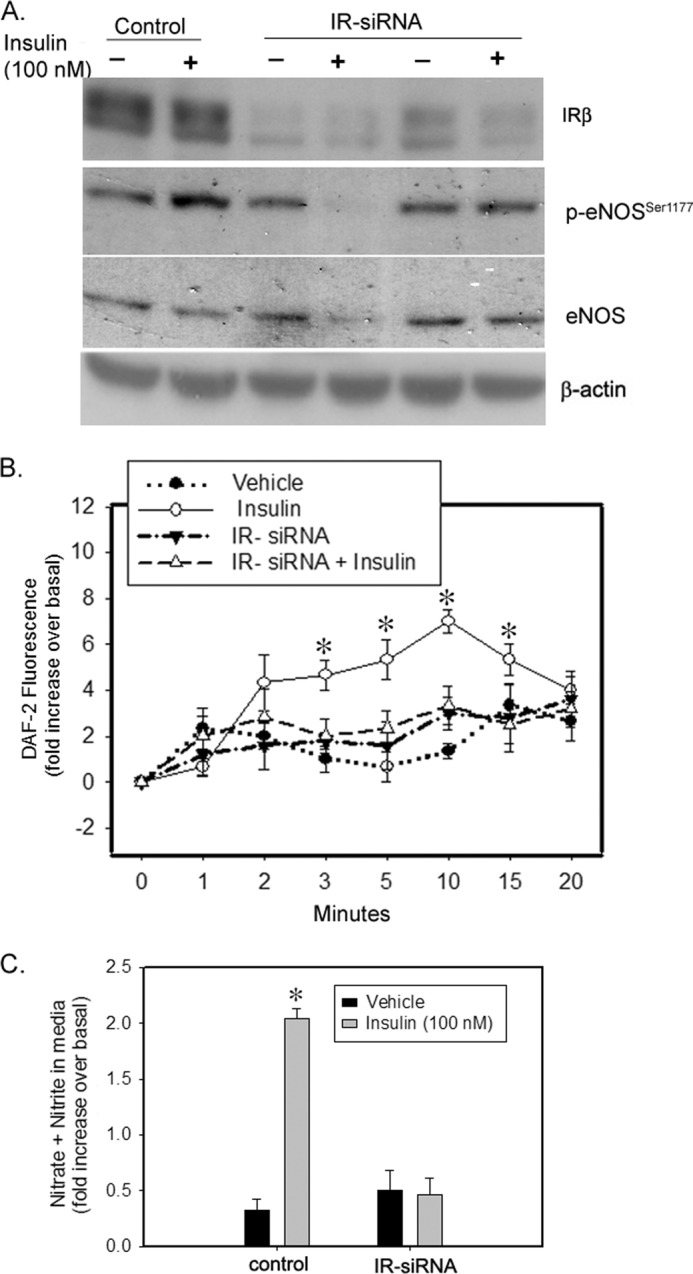
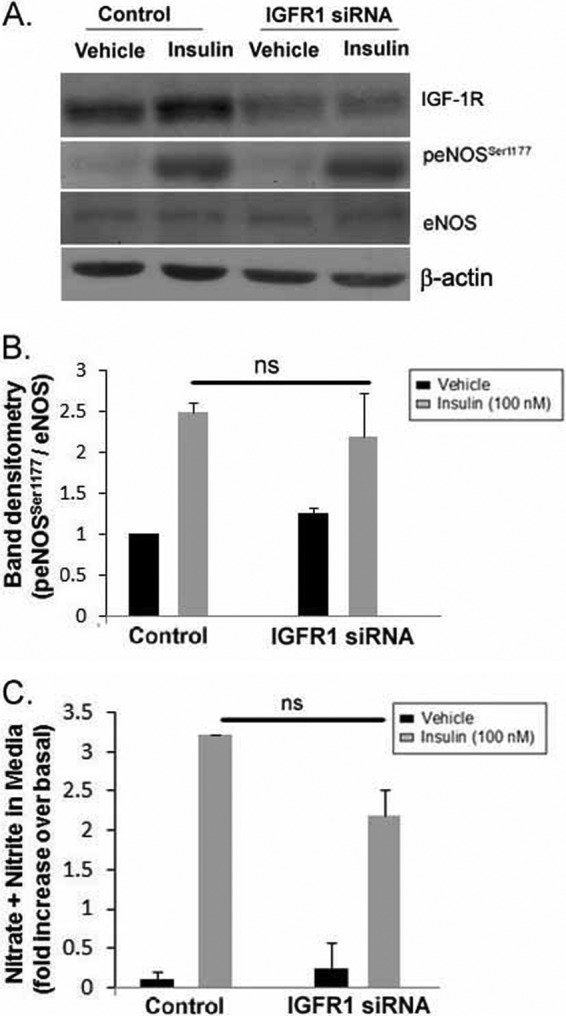
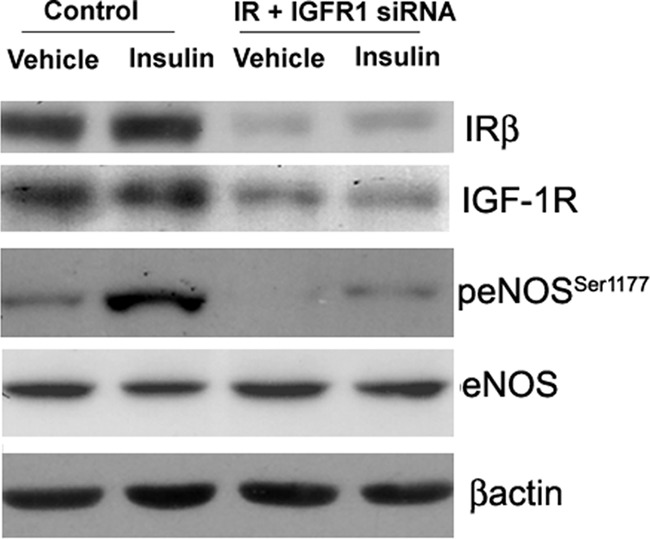
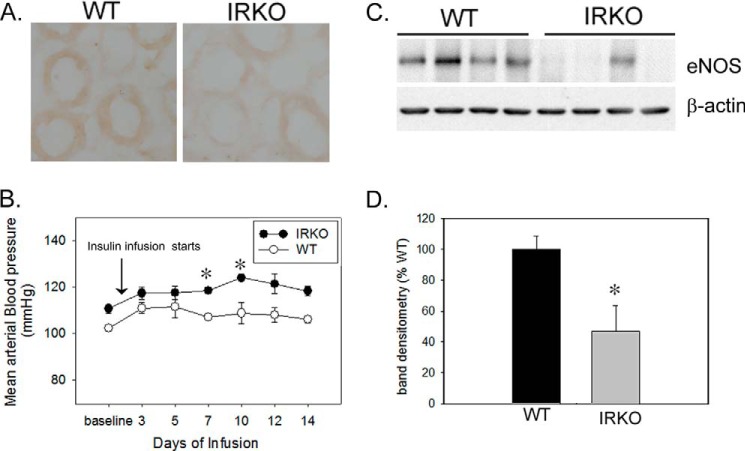
The kidney is an important organ for arterial blood pressure (BP) maintenance. Reduced NO generation in the kidney is associated with hypertension in insulin resistance. NO is a critical regulator of vascular tone; however, whether insulin regulates NO production in the renal inner medullary collecting duct (IMCD), the segment with the greatest enzymatic activity for NO production in kidney, is not clear. Using an NO-sensitive 4-amino-5-methylamino-2',7'-difluorofluorescein (DAF-FM) fluorescent dye, we found that insulin increased NO production in mouse IMCD cells (mIMCD) in a time- and dose-dependent manner. A concomitant dose-dependent increase in the NO metabolite (NOx) was also observed in the medium from insulin-stimulated cells. NO production peaked in mIMCD cells at a dose of 100 nm insulin with simultaneously increased NOx levels in the medium. At this dose, insulin significantly increased p-eNOS(Ser1177) levels in mIMCD cells. Pretreatment of cells with a PI 3-kinase inhibitor or insulin receptor silencing with RNA interference abolished these effects of insulin, whereas insulin-like growth factor-1 receptor (IGF-1R) silencing had no effect. We also showed that chronic insulin infusion to normal C57BL/6J mice resulted in increased endothelial NOS (eNOS) protein levels and NO production in the inner medulla. However, insulin-infused IRKO mice, with targeted deletion of insulin receptor from tubule epithelial cells of the kidney, had ∼50% reduced eNOS protein levels in their inner medulla along with a significant rise in BP relative to WT littermates. We have previously reported increased baseline BP and reduced urine NOx in IRKO mice. Thus, reduced insulin receptor signaling in IMCD could contribute to hypertension in the insulin-resistant state.

Keywords: Epithelial Cell; Gene Silencing; Hypertension; Insulin Receptor; Insulin Resistance; Kidney; Kidney Tubule Cells; Nitric Oxide Synthase; Phosphatidylinositide 3-Kinase.


Figures

FIGURE 1.
FIGURE 1.
Increased eNOS expression in inner medulla from mice infused with insulin or maintained in the control state. A, representative Western blot of eNOS (top) in control mice and mice infused with insulin for 28 days (50 units/kg of body weight). Below is the Coomassie Blue-stained loading gel. B, densitometry summary. * indicates a significant (p < 0.05) difference from control by unpaired t test (n = 6/group). C, mean arterial blood pressure of mice infused with vehicle or insulin for a period of 4 weeks (n = 5/group). D, insulin-induced nitric oxide production in the IMCD-enriched suspension from mouse kidney tissue (n = 4/group); *, p < 0.05 as compared with vehicle. Error bars in B–D indicate S.E.
FIGURE 2.
FIGURE 2.
Insulin stimulates NO production in mouse IMCD cells. A, IMCD cells were loaded with DAF-FM for 60 min followed by vehicle or increasing concentration of insulin (1–200 nm) stimulation. Increase in fluorescence from baseline (mean ± S.E.) was plotted for each data point (n = 3). *, p < 0.05 versus vehicle for same time of incubation. AU, arbitrary units. B, area under the curve over the period of 18 min for above graph. C, after 15 min of vehicle or insulin stimulation, medium from these cells were analyzed for increase in NO metabolite (nitrate + nitrite, NOx) levels over the medium from the same cells before stimulation. Treatment was plotted as the mean ± S.E. of three independent experiments; *, p < 0.05 as compared with vehicle.
FIGURE 3.
FIGURE 3.
Insulin stimulates eNOS phosphorylation in IMCD cells. IMCD cells were treated with vehicle or insulin (100 nm) for 15 min. A, representative lanes are shown from immunoblots of cell lysate probed with the antibody against p-AktTh308, Akt, p-eNOSSer1177, eNOS, and IR-β; β-actin was used as a loading control. B, summary of band densities, normalized to β-actin (n = 5/treatment). *, p < 0.05 versus vehicle for same time of incubation. Error bars indicate mean ± S.E. C, representative microscopic images evaluating insulin-stimulated phosphorylation of eNOS at Ser-1177 by immunofluorescence using antibody against p-eNOSSer1177 (red color). Hoechst stain (blue color) was used for nuclear staining (100× and 600×).
FIGURE 4.
FIGURE 4.
PI 3-kinase inhibitor Wortmannin inhibited NO production and eNOS phosphorylation in IMCD. IMCD cells were preincubated with vehicle (dimethyl sulfoxide (DMSO)) or wortmannin (500 nm) for 30 min followed by stimulation with vehicle or insulin (100 nm) for 15 min. A, representative lanes are shown from immunoblots of cell lysate probed with the antibody against p-eNOSSer1177 and re-probed with eNOS and β-actin. B, NO metabolite (nitrate + nitrite, NOx) levels in the medium from the above cells. Data are presented as mean ± S.E. from three independent experiments; *, p < 0.05 as compared with vehicle.
FIGURE 5.
FIGURE 5.
siRNA-mediated knockdown of IR attenuated insulin-induced NO production in IMCD cells. Cells were treated with scrambled siRNA or IR siRNA for 48 h and then loaded with DAF-FM dye for 30 min followed by vehicle or insulin (100 nm) stimulation. A, representative lanes are shown from immunoblots of cell lysate probed with the antibody against IR-β, p-eNOSSer1177, and re-probed with eNOS and β-actin. B, increase in fluorescence from baseline was plotted for each data point as mean ± S.E.; n = 3; *, p < 0.05 versus vehicle for same time of incubation. C, after 15 min of vehicle or insulin stimulation, medium from these cells were analyzed for increase in NO metabolite (nitrate + nitrite) levels over the medium from the same cells before stimulation. Treatment was plotted as the mean ± S.E. of three independent experiments; *, p < 0.05 as compared with vehicle.
FIGURE 6.
FIGURE 6.
siRNA-mediated knockdown of IGF-1R in IMCD did not affect insulin-induced eNOS activation in IMCD cells. Cells were transfected with scrambled control siRNA or IGF-1R siRNA for 48 h followed by vehicle or insulin (100 nm) stimulation for 15 min. A, representative lanes are shown from immunoblots of cell lysate probed with the antibody against IGF-1R, p-eNOSSer1177, eNOS, and β-actin. B, summary of band densities for p-eNOSSer1177 normalized to eNOS. (n = 3/treatment). C, after 15 min of vehicle or insulin stimulation, medium from these cells were analyzed for increase in NO metabolite (nitrate + nitrite) levels over the medium from the same cells before stimulation. Treatment was plotted as the mean ± S.E. of three independent experiments; *, p < 0.05 as compared with vehicle. ns, not significant.
FIGURE 7.
FIGURE 7.
siRNA-mediated dual knockdown of IR and IGF-1R in IMCD reduced insulin-induced eNOS activation in IMCD cells. Cells were transfected with scrambled control siRNA or IR plus IGF-1R siRNA for 48 h followed by vehicle or insulin (100 nm) stimulation for 15 min. Representative lanes are shown from immunoblots of cell lysate probed with the antibody against IR-β, p-eNOSSer1177, followed by re-probing with IGF-1R, eNOS, and β-actin.
FIGURE 8.
FIGURE 8.
Impaired eNOS regulation in inner medulla from IRKO mice. A, reduced p-eNOSSer1177 expression in renal inner medulla of IRKO mice versus wild type littermates (WT) by immunohistochemistry; n = 3/genotype; total magnification, 600×. B, mean arterial blood pressure (MAP) of WT and IRKO, chronically infused with insulin over a period of 2 weeks. * indicates a significant (p < 0.05) difference from baseline MAP. By the second week, insulin-infused IRKO mice showed significant rise in MAP relative to their baseline MAP (n = 3/genotype, p = 0.03). C, eNOS protein levels in inner medulla from the kidneys of insulin-infused IRKO and WT littermates. Representative lanes are shown from immunoblots of inner medullary homogenates probed with the antibody against eNOS and β-actin. D, summary of band densities, normalized to β-actin (n = 7/genotype; p = 0.04). Error bars in B and D indicate S.E.

References

    1. Venkatesan N., Davidson M. B. (1995) Insulin resistance in rats harboring growth hormone-secreting tumors: decreased receptor number but increased kinase activity in liver. Metabolism 44, 75–84 - PubMed
    1. Grote C. W., Groover A. L., Ryals J. M., Geiger P. C., Feldman E. L., Wright D. E. (2013) Peripheral nervous system insulin resistance in ob/ob mice. Acta Neuropathol. Commun. 1, 15. - PMC - PubMed
    1. Rojas F. A., Hirata A. E., Saad M. J. (2003) Regulation of insulin receptor substrate-2 tyrosine phosphorylation in animal models of insulin resistance. Endocrine 21, 115–122 - PubMed
    1. Boden G., Chen X., Ruiz J., Heifets M., Morris M., Badosa F. (1994) Insulin receptor down-regulation and impaired antilipolytic action of insulin in diabetic patients after pancreas/kidney transplantation. J. Clin. Endocrinol. Metab. 78, 657–663 - PubMed
    1. Garvey W. T., Olefsky J. M., Marshall S. (1986) Insulin induces progressive insulin resistance in cultured rat adipocytes: sequential effects at receptor and multiple postreceptor sites. Diabetes 35, 258–267 - PubMed

Publication types

MeSH terms