. 2015 Jan 15;160(1-2):299-312.
doi: 10.1016/j.cell.2014.11.050. Epub 2014 Dec 18.

Long-term culture of genome-stable bipotent stem cells from adult human liver

Affiliations

Long-term culture of genome-stable bipotent stem cells from adult human liver

Meritxell Huch et al. Cell. .

Abstract

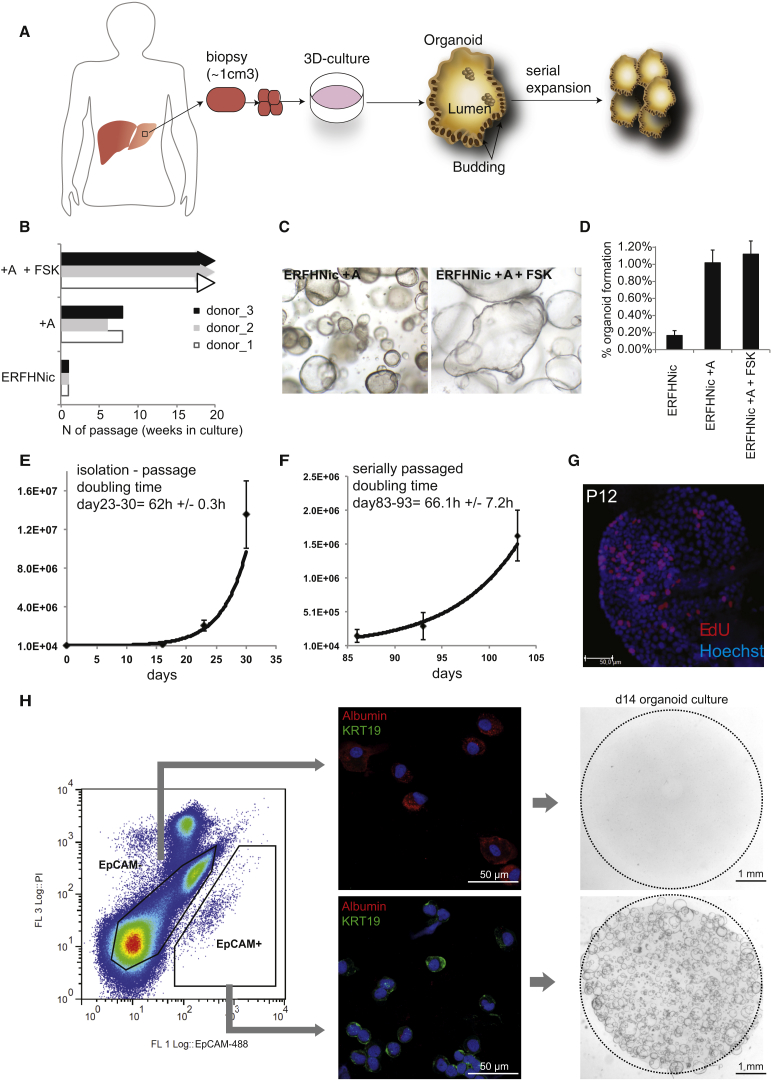
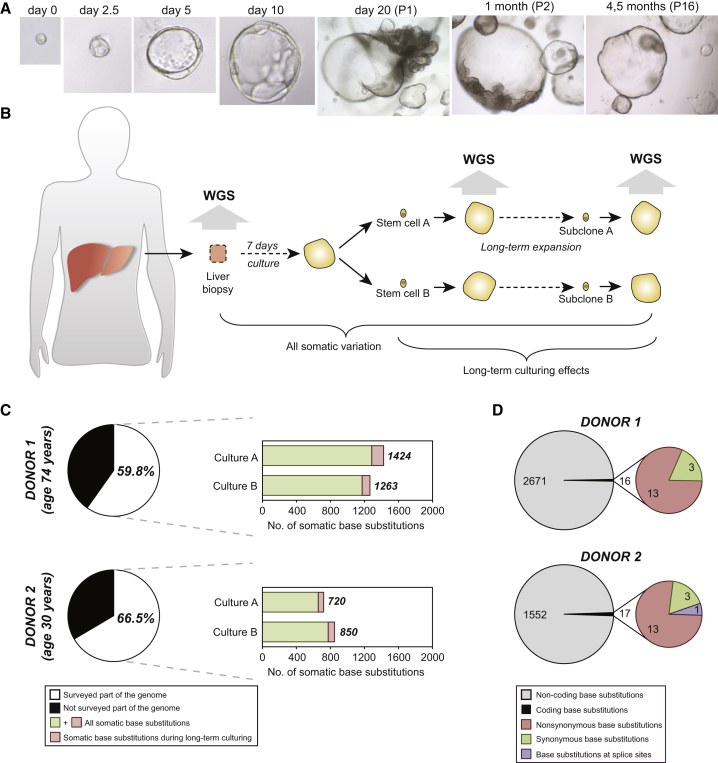
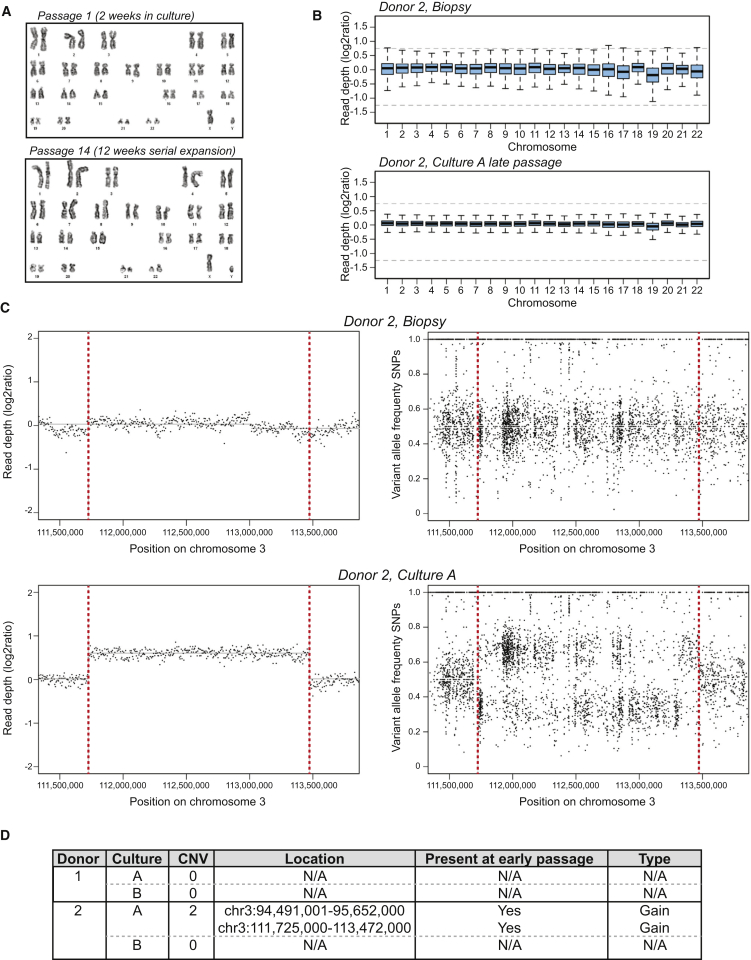
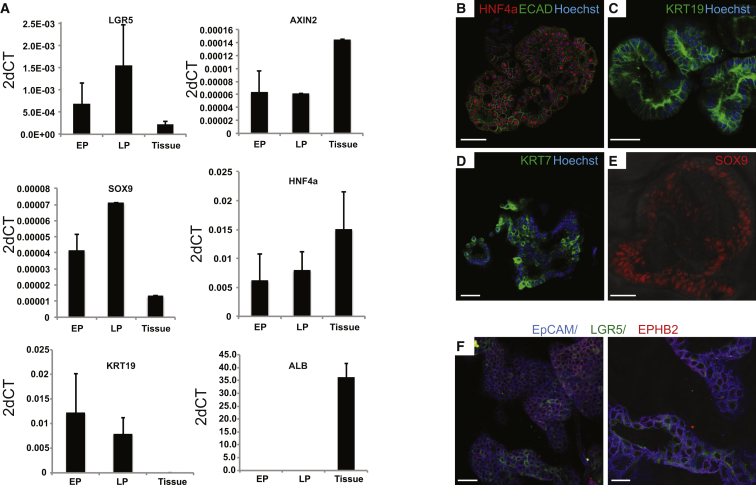
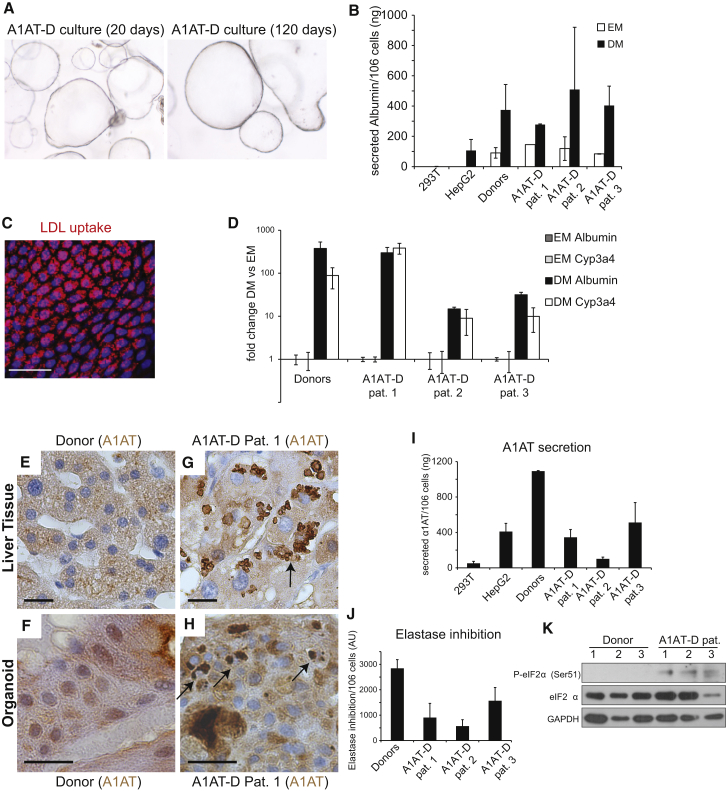
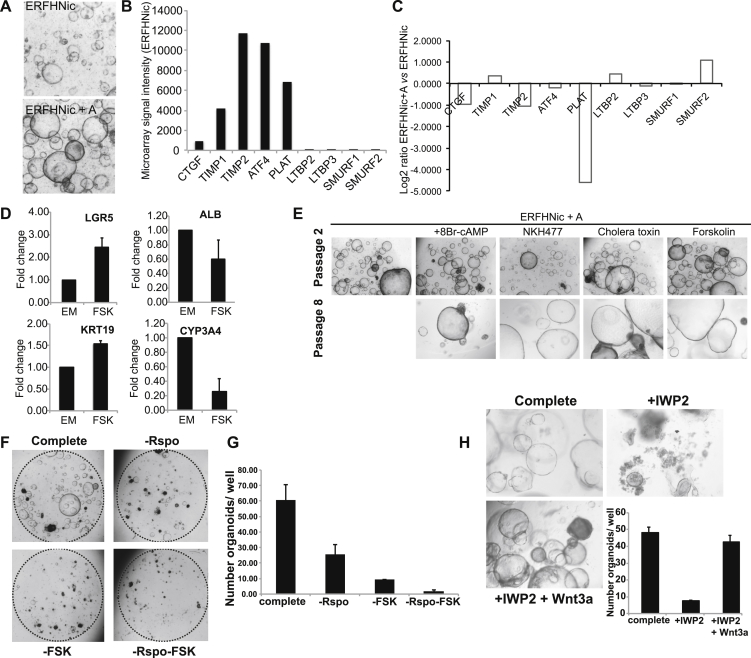
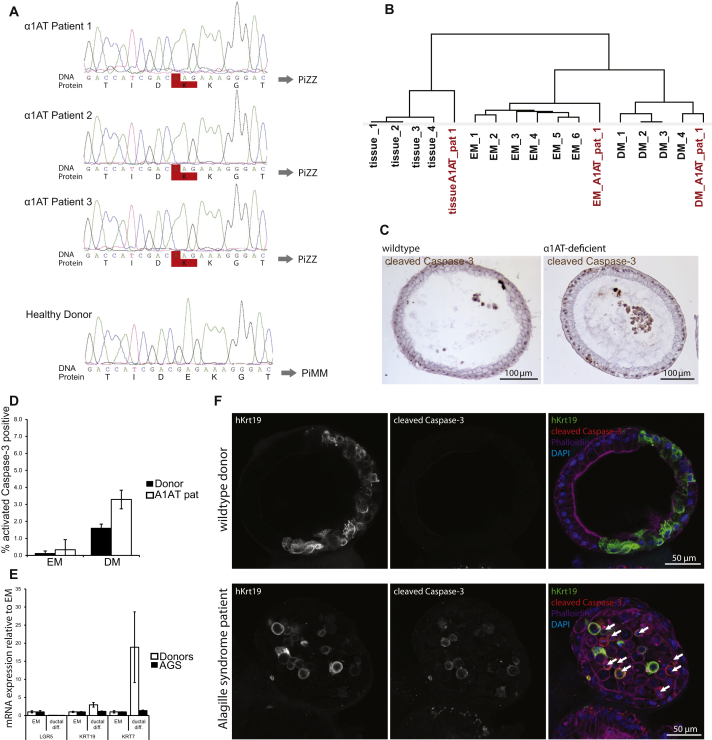
Despite the enormous replication potential of the human liver, there are currently no culture systems available that sustain hepatocyte replication and/or function in vitro. We have shown previously that single mouse Lgr5+ liver stem cells can be expanded as epithelial organoids in vitro and can be differentiated into functional hepatocytes in vitro and in vivo. We now describe conditions allowing long-term expansion of adult bile duct-derived bipotent progenitor cells from human liver. The expanded cells are highly stable at the chromosome and structural level, while single base changes occur at very low rates. The cells can readily be converted into functional hepatocytes in vitro and upon transplantation in vivo. Organoids from α1-antitrypsin deficiency and Alagille syndrome patients mirror the in vivo pathology. Clonal long-term expansion of primary adult liver stem cells opens up experimental avenues for disease modeling, toxicology studies, regenerative medicine, and gene therapy.


Figures

None
Graphical abstract
Figure 1
Figure 1
Growing Liver Organoids from Ductal Cells 3,000 or 10,000 human primary liver cells were seeded per well in a 48-well plate in different culture conditions, as indicated. (A) Scheme of the experimental protocol. (B) Mouse liver culture medium (ERFHNic) or medium supplemented with A8301 (A) or A8301 and Forskolin (FSK). The cultures were split every week 7–10 days at a ratio of 1:4−1:6 dilution. Supplementing with A8301 and FSK significantly increased the expansion efficiency to grow for >18 passages at a split ratio of 1:4–1:6 every 7–10 days for >5 months. Experiments were performed in triplicate. Each bar indicates a different donor. (C) DIC images of organoids treated with mouse liver medium with A8301 and with (right) or without (left) FSK. Magnification, 4×. (D) Percentage of colony formation efficiency in the presence or absence of A8301 and/or FSK. Experiments were performed in triplicate and for five donors. Results are expressed as mean ±SEM of five independent experiments. (E–G) Expansion rates, in vitro growth curves, and EdU incorporation were analyzed at early and late passages in EM. (E and F) Graphs illustrate the number of cells counted per well at each passage from P1–P4 (E) to P16–P18 (F). Results are expressed as mean ±SEM of three independent cultures. The doubling time was calculated as described in the Extended Experimental Procedures. (G) EdU incorporation was still detected at late passages. (H) Human liver cell suspensions were separated into EpCAM+ ductal cells and larger EpCAM− hepatocytes (for exact gating strategy, see Figure S2C). Identity of the populations was confirmed by staining for Albumin and KRT19. Sorted cells were grown for 14 days. Organoids were exclusively derived from EpCAM+ ductal cells. See also Figures S1 and S2.
Figure 2
Figure 2
Human Organoids Are Genetically Stable in Culture (A) Clonal cultures were obtained by seeding sorted cells at one cell per well. DIC images at magnifications: 40× (days 0–10), 4× (day 20 onward). (B) Schematic overview of the experimental setup. Two independent donor liver biopsies were cultured for 1 week. Single cells were then clonally expanded to obtain two independent organoid cultures per donor (cultures A and B). After long-term expansion, a second clonal expansion step was performed. The resulting organoid cultures were subjected to WGS analysis. To obtain all somatic variation, variants were filtered for presence in the original biopsy. To determine the effect of long-term culturing on genomic stability, somatic variation was filtered for presence in earlier passages. (C) The pie chart indicates the percentage of the genome that was surveyed per donor. The right panels indicate the absolute numbers of base substitution observed in the surveyed part of the genome. Indicated are the total number of somatic base substitutions per culture and the number induced by long-term culturing. (D) Left panels indicate the total number of somatic base substitutions per donor, and the right panel indicates those affecting protein-coding DNA. See also Figure S3.
Figure 3
Figure 3
Structural Variation in Human Liver Organoids (A) Representative karyotyping image of organoids cultured for 16 days (P1) and 90 days (P14), illustrating a normal chromosomal count (n = 46). No major chromosomal aberrations were observed in any of the samples analyzed (n = 15). Detailed chromosomal counts for different donors are shown in Figure S4. (B) Read-depth analysis of whole-genome sequencing data over the different chromosomes for the biopsy (top) and organoid culture A (bottom) that were derived from donor 2. Read depth was corrected for GC content and normalized for genome coverage. Gray dotted lines indicate log2 values associated with a gain or deletion. (C) Copy number analysis of a region at chromosome 3 found to harbor a heterozygous gain in culture A of donor 2. Left panels indicate read-depth analysis of the indicated region in 5 kb bins, corrected for GC content and normalized for genome coverage, of the biopsy (top) and organoid culture (bottom). Right panels show the variant allele frequencies of informative nonreference single-nucleotide polymorphisms (SNPs) in the indicated region for the biopsy (top) and organoid culture (bottom). (D) Summary of copy number analysis of the different organoid cultures of the two donors. Somatic CNVs were exclusively observed in culture A derived from donor 2 and were already present in the parental culture. See also Figure S4.
Figure 4
Figure 4
Marker Expression of Human Liver Organoids (A and B) Gene expression was analyzed by RT-PCR (A) and immunofluorescence (B) in human liver cultures grown in EM. (A) Gene expression was analyzed at early (EP) and late (LP) passages. Human liver cultures expressed progenitor (LGR5, SOX9), ductal (KRT19, SOX9), and hepatocyte (HNF4A) markers, but no albumin (ALB). Results are indicated as 2-dCt (2ΔΔCT). Values represent mean ±SEM of three independent experiments in five independent donor-derived cultures. 2ΔΔCT were calculated using the housekeeping gene GAPDH as reference gene. Tissue, whole-liver lysate. (B–F) Confocal images stained for ECAD and the hepatocyte marker HNF4 (B) and the ductal markers (KRT19 [C], KRT7 [D], and SOX9 [E]). Nuclei were counterstained with Hoechst. (F) Confocal image stained for EPCAM (blue). The stem cell marker Lgr5 (green) was restricted to a subset of the cells staining for the Wnt target gene EPHB2 (red). Scale bars, 50 μm (B–E and F, left); 25 μm (F, right). See also Figure S5.
Figure 5
Figure 5
Differentiation of Organoids into Hepatocytes Human liver cultures expanded for >1 month were transferred to DM. (A) Experimental strategy. (B and C) Expression of hepatocyte genes determined by immunofluorescence (B) or qPCR (C) after 11 days. (B) Immunofluorescence for albumin (ALB, red) and ZO-1 (green). Scale bar: 25 μm, left; 30 μm, right. (C) qPCR analysis for albumin and cytochrome p450 3A4. Graphs indicate mean ±SEM of three independent experiments for three independent donors. Tissue: whole lysate from human liver. ∗∗p < 0.01 when comparing EM versus DM. (D) Whole-genome transcriptome analysis of human liver cultures grown in EM or after being cultured 11 days in DM. Heat map indicates cluster of genes highly expressed in liver tissue and in differentiated organoids. Of note, this cluster contains genes essential for liver function, as indicated in red. Green, downregulated; red, upregulated. See also Figure S5.
Figure 6
Figure 6
Liver Cultures Exhibit Hepatocyte Functions In Vitro and In Vivo (A) Glycogen accumulation was determined by PAS (Periodic-Acid Schiff) staining in organoids grown in EM or DM for 11 days. PAS staining (pink) was exclusively observed after differentiation (DM), indicating the capacity to accumulate glycogen. Magnification, 10×. (B) LDL uptake was analyzed using Dil-ac-LDL fluorescent substrate (red) after EM (left) or DM (right) culture for 11 days. Only cultures maintained in DM incorporated the substrate (red). Nuclei were counterstained with DRAQ5. Scale bar, 25 μm. (C) Albumin production during 24 hr was measured in supernatant. Results are expressed as mean ±SEM of two independent experiments in four independent donor-derived cultures. (D) CYP3A4 activity was measured in cultures kept in DM for 11 days. Results are expressed as RLU per ml per million cells. HEK293T cells and HepG2 cells were used as negative and positive controls, respectively. Note that DM organoids upon DM exhibit similar the CYP3A4 activity as freshly isolated hepatocytes (see Figure S2A). Triplicates for each condition were analyzed. Results are shown as mean ±SEM of two independent experiments in four independent donor-derived cultures. (E) Midazolam metabolism is performed exclusively by functional CYP3A3/4/5 enzymes. Three different organoid cultures from two different donors and HepG2 cells were cultured for 11 days as described. Midazolam was added to the medium (5 μM), and after 24 hr, concentrations of 1-OH midazolam and 1-OH midazolam glucuronide were determined. Duplicates for each condition and donor were analyzed. Results are shown as mean ±SEM of two independent experiments. (F) Bile acid production shown as ±SEM of two independent experiments in two independent donor-derived cultures. Duplicates for each condition and donor were analyzed. (G) Ammonia elimination, shown as ±SEM of n = 3 independent experiments in two independent donor-derived cultures, given as nM/h/million cells. (H) Retrorsine/CCl4-treated Balbc/nude mice were transplanted with 1–2 × 106 human liver organoid cells and were sacrificed after 120 days. The presence of foci of human Albumin+/ KRT19 hepatocytes demonstrates engraftment and differentiation in mouse liver. (I) Serum levels of human Albumin after transplantation. Results are shown as ±SEM of two vehicle control animals, two primary hepatocyte transplanted mice, and six human liver organoid transplanted animals. ∗∗p < 0.01 and p < 0.05 when comparing EM versus DM. See also Figures S5 and S6.
Figure 7
Figure 7
Human A1AT Deficiency Liver Cultures as an In Vitro Disease Model (A) A1AT-deficieny patient-derived liver organoids at passage 2 and passage 11 (4× magnification). (B) Albumin secretion in supernatant from donor and A1AT-deficient patient organoids in EM or after 11 days in DM. Results are expressed as mean ±SEM of two independent experiments. (C) A1AT-deficient organoids were differentiated for 11 days and incubated with DiI-Ac-LDL. Fluorescence microscopy shows robust LDL uptake in patient organoids. Scale bar, 50 μm. (D) Fold induction of Albumin and CYP3A4 mRNA levels after 11 days of differentiation of donor and A1AT-deficient organoids. Results are expressed as mean ±SEM of two independent experiments. (E–H) Immunohistochemistry for A1AT on liver tissue (E and G) and liver-derived organoids from a healthy donor (F) and a representative A1AT deficiency patient (H) Arrows indicate A1AT protein aggregates in patient-derived liver tissue (G) and organoids (H). Scale bar, 20 μm. (I) ELISA measurement of A1AT secretion in supernatants from donor and patient organoids after 11 days of differentiation. Results are expressed as mean ±SEM of two independent experiments. (J) Enzymatic measurement of elastase inhibition by supernatants of differentiated donor and patient-derived organoids. Results are expressed as mean ±SEM of two independent experiments. (K) Western blot of lysates from donor and A1AT deficiency patient organoids after 11 days of differentiation. Increased eIF2α phosphorylation at Ser51 was detected in the three patients. Representative image is shown. Pat, patient. See also Figure S7.
Figure S1
Figure S1
TgFb Inhibition, Active Wnt Signaling, and cAMP Activation Are Essential for the Long-Term Expansion of Human Liver Cells, Related to Figure 1 (A–E) Liver tissue was digested using collagenase dissociation as described in Material and Methods. Single cell suspensions were counted and 3000 or 10000 cells were seeded per well in a 48well plate. Cells were cultured in mouse liver medium containing Egf, Rspo, Fgf10, Hgf and Nicotinamide (ERFHNic) or the same medium supplemented with A8301 (+A) or forskolin (+FSK) or the indicated compounds. (A) Representative images of organoid cultures grown in the mouse medium (ERFHNic) or medium supplemented wiht A8301 (+A). (B) Gene expression of TGFb target genes, sequesters and inhibitors in 2 weeks old cultures maintained in mouse medium. Results are expressed as microarray signal of the specific gene after normalization. (C) Gene expression of the specific TGFb genes downregulated upon A8301 treatment. Results are expressed as log2 fold change when comparing cutlures treated vs non-treated. (D) Gene expression of LGR5, KRT19, ALB and CYP3A4 upon FSK treatment. (E) Images of organoid cultures treated for up to 8 passages with the indicated cAMP activators. (F) Expanding human liver organoids grown in complete medium as described in Methods were maintained in that medium (complete) or transferred to a medium without Rspo (-Rspo), without FSK (-FSK) or both (-Rspo-FSK). After withdrawal the cultures deteriorated and could no longer be passaged. Representative image of 1 donor material 7 days after withdrawal. (G) Quantification of the number of organoids per well after a 7 days withdrawal of Rspo or FSK or both. Results are expressed as the mean +/- SEM of 2 independent human donor material and 2 independent experiements. (H) Addition of the porcupine inhibitor (IWP2) to the medium resulted in growth arrest evident as early as 5 days after the treatment. That effect could be rescued by the exogenous addition of Wnt into the medium (+Wnt3a). Representative images taken 12 days after treatment. Organoid numbers were counted 12 days after the treatment. Graph indicating the number of organoids in the presence/absence of the indicated compounds. Results are expressed as mean +/- SEM of 2 independent human liver cultures.
Figure S2
Figure S2
Human Liver Cultures Are of Ductal Origin, Related to Figure 1 (A) Cyp3A4 activity of Percoll purified primary human hepatocytes after 4 days in culture in comparison to HepG2 cells (Mean ± SEM of 3 replicates). (B) EpCAM marks bileducts in human liver sections. Hepatocytes are EpCAM negative. (C) sorting strategy to purify EpCAM+ ductal cells and Hepatocytes. In the first step, singlets were gated to avoid contamination by cell aggregates. Subsequently, large debris and erythrocytes were excluded. From this population, EpCAM+ PI- (viable) cells were sorted as the ductal population. For hepatocyte sorting large EpCAM- cells were selected. (D) Organoid formation efficiency of sorted ductal and hepatocyte populations after 14 days. Organoids bigger than 100 μm were scored. (E) EpCAM+ sort derived organoids at passage 0 and passage 6. (F) Organoid formation efficiency of unsorted, Percoll purified hepatocytes (Mean ± SEM of 3 replicates) and (G) the respective percentage of residual EpCAM+ cells.
Figure S3
Figure S3
Filtering Steps and FNR of All Sequenced Samples, Related to Figure 2 (A) Total number of base substitutions after various filtering steps: (1) Multi-sample called (biopsy, 2 parental cultures, 2 subclonal cultures for both donors) base substituions with UnifiedGenotyper from GenomeAnalysis toolkit version 2.8-1. (2) First quality control was performed with VariantFiltration from GenomeAnalysis toolkit version 2.8-1 with settings: --clusterWindowSize 10 --filterExpression “MQ0 >= 4 && ((MQ0 / (1.0 DP)) > 0.1)” --filterName “HARD_TO_VALIDATE” --filterExpression “QUAL < 100.0 ” --filterName “LowQual” --filterExpression “QD < 1.5 ” --filterName “LowQD” (3) Base substitutions with a coverage of at least 20X in all samples. (4) Base substitutions at autosomal chromosomes. (5) Base substitutions without any evidence in the biopsy sample (somatic events). (6) Base substitutions were called if PNR >= 0.3 in the subclones. Base substitutions that were called and also have evidence in the other subclone of the same individual are removed if the 0 < PNR < 0.3 and the number of alternative reads is >1. (7) Base substitutions without a dbSNP_137 identifier. (8) Base substitutions without evidence in the other individual. (B) Estimation of False Negative Rate (FNR). The germline SNP sets consist of base substitutions that pass filter steps 1-4, are called in the biopsy of the donor with a PNR >= 0.3 and number of alternative alleles > 1. Subsequently, base substitutions were called in the subclonal cultures that passed filter steps 1-4 and 6. Germline SNPs that were missed in the subclonal cultures are used to calculate the FNR.
Figure S4
Figure S4
Genetic Stability of Human Liver Stem Cell Cultures, Related to Figure 3 (A) Chromosome numbers were counted on a total of 76 metaphases from 2 different donors. B-D: Genetic stability was evaluated on clonally expanded cultures from 1 donor by WGS. Absence of DNA-Copy number alterations in human liver stem cell cultures clonally expanded long-term in culture. Box plots display the Log2 intensity ratios for the original biospy (B), clone 3 (C) or subclone of the clone 3 (D) for chromosomes 1 to 22.
Figure S5
Figure S5
Analysis of Organoids during Expansion and upon Differentiation, Related to Figures 5 and 6 (A) Representative image of RT-PCR analysis of indicated genes in 2 independent human liver donor-derived organoid cultures maintained in Expansion medium (EM) for 2 months in culture. Note expression of progenitor marker PROM1 and ductal marker OC2 (ONECUT2). (B) Heat map of genes >2 fold differentally expressed between human liver tissue and organoid in expansion medium. Red, upregulated. Green, downregulated, Black, not differentially expressed. (C) Representative image of RT-PCR analysis of indicated genes in 1 donor derived culture maintained under complete expansion medium (EM) or after withdrawal of Rspondin (Rspo) or Forskolin (FSK). (D) Representative image of RT-PCR analysis of CYP3A4 in 1 donor derived culture maintained under complete differentiation medium (DM, complete) for 11 days, or after withdrawal of the indicated components, DAPT and/or Dexamethasone (Dexa). (E) Representative image of RT-PCR analysis of indicated genes in 2 independent human liver donor derived organoid cultures maintained in Expansion medium (EM) for 2 months in culture or after 11 days in Differentiation medium (DM). Note expression of hepatocyte markers TAT and cytochromes exclusively upon differentiation. (A-E) + control, human liver lysate (F-G) EpCAM+ cell derived organoids were differentiated for 11 days according to our differentiation protocol. (F) Immunofluorescent Albumin and Krt19 staining show presence of differentiated cells of biliary and hepatocyte lineage. (G) qRT-PCR for differentiation markers of the hepatocyte (Alb and Cyp3A) and ductal (Krt19 and Krt7) lineage show successful differentiation of EpCAM+ cell derived organoids to hepatocytes.
Figure S6
Figure S6
Transplantation of Human Liver Organoids into Damaged Mouse Liver, Related to Figure 6 (A) Control staining for human specific Albumin (hAlbumin) and Kertatin-19 (hKrt19) antibodies. hAlbumin recognises human but not mouse hepatocytes, whereas hKrt19 stains human but not mouse bile ducts. (B) Liver sections of mice sacrificed 2 hours or 2 days after human liver organoid cell transplantation stained for hKrt19. After 2 hours human cells are mostly seen in blood vessels in and around portal veins, whereas cells start to engraft in the tissue 2 days after the transplant. (C) Example singlet or doublet human Albumin positive hepatocytes observed in the liver of human liver organoid transplanted Balbc/nude mice. (D) Human serum Albumin levels of individual transplanted mice over 120 days. (E) Average human serum alpha-1-antitrypsin levels of transplanted mice over 120 days. Results are shown as Mean ± SEM of 2 vehicle control animals and 3 human liver organoid transplanted animals.
Figure S7
Figure S7
Organoids from A1AT Deficiency and AGS Patients Mimic Disease Phenotypes In Vitro, Related to Figure 7 (A) SERPIN1A Sanger Sequencing of Donor #1 and α1AT Patient #1. Chromatograms of 3 A1AT-deficient patients (PiZZ) and 1 donor with wildtype SERPINA1 (PiMM). The homozygous G to A mutation causes an amino acid change from glutamic acid to lysine at position 342. (B) Clustering analysis of the different donors (1-5) and α1AT Patient (A1AT_pat) organoids and tissues. Note that, regarding differentiation ability, the behaviour of α1AT Patient derived organoids resembles donor derived organoids. i.e. organoids in EM cluster cluster with donor EM organoids and α1AT-D organoids cultured in DM cluster with donor derived organoids cultured in DM conditions. (C) histological staining for cleaved caspase-3 in donor and α1AT Patient derived organoids differentiated in DM for 11 days. (D) quantification of apoptotic cells in wildtype and α1AT Patient derived organoids in EM and after differentiation in DM. Results are shown as Mean ± SEM of 6 random sections of organoids per 2 independent donors and patients. (E) qRT-PCR of Lgr5 and ductal markers (Krt19 and Krt7) in EM and after ductal differentiation. AGS patients fail to upregulate ductal markers upon differentiation. Results are shown as Mean ± SEM of 3 independent experiments. (F) Immunofluorescence of differentiated wildtype and AGS patient organoids. Krt19 positive cells in AGS patient organoids do not integrate into the epithelium and show signs of apoptosis (arrows). EM, expansion medium. DM, differentiation medium, ductal diff, ductal differentiation medium (see text). AGS, Alagille syndrome.

Comment in

References

    1. Abyzov A., Mariani J., Palejev D., Zhang Y., Haney M.S., Tomasini L., Ferrandino A.F., Rosenberg Belmaker L.A., Szekely A., Wilson M. Somatic copy number mosaicism in human skin revealed by induced pluripotent stem cells. Nature. 2012;492:438–442. - PMC - PubMed
    1. Baker D.E., Harrison N.J., Maltby E., Smith K., Moore H.D., Shaw P.J., Heath P.R., Holden H., Andrews P.W. Adaptation to culture of human embryonic stem cells and oncogenesis in vivo. Nat. Biotechnol. 2007;25:207–215. - PubMed
    1. Barker N., van Es J.H., Kuipers J., Kujala P., van den Born M., Cozijnsen M., Haegebarth A., Korving J., Begthel H., Peters P.J., Clevers H. Identification of stem cells in small intestine and colon by marker gene Lgr5. Nature. 2007;449:1003–1007. - PubMed
    1. Barker N., Huch M., Kujala P., van de Wetering M., Snippert H.J., van Es J.H., Sato T., Stange D.E., Begthel H., van den Born M. Lgr5(+ve) stem cells drive self-renewal in the stomach and build long-lived gastric units in vitro. Cell Stem Cell. 2010;6:25–36. - PubMed
    1. Bayart E., Cohen-Haguenauer O. Technological overview of iPS induction from human adult somatic cells. Curr. Gene Ther. 2013;13:73–92. - PMC - PubMed

Supplemental References

    1. Boeva V., Popova T., Bleakley K., Chiche P., Cappo J., Schleiermacher G., Janoueix-Lerosey I., Delattre O., Barillot E. Control-FREEC: a tool for assessing copy number and allelic content using next-generation sequencing data. Bioinformatics. 2012;28:423–425. - PMC - PubMed
    1. DePristo M.A., Banks E., Poplin R., Garimella K.V., Maguire J.R., Hartl C., Philippakis A.A., del Angel G., Rivas M.A., Hanna M. A framework for variation discovery and genotyping using next-generation DNA sequencing data. Nat. Genet. 2011;43:491–498. - PMC - PubMed
    1. Huch M., Gros A., Jose A., Gonzalez J.R., Alemany R., Fillat C. Urokinase-type plasminogen activator receptor transcriptionally controlled adenoviruses eradicate pancreatic tumors and liver metastasis in mouse models. Neoplasia. 2009;11:518–528. - PMC - PubMed
    1. Rausch T., Zichner T., Schlattl A., Stütz A.M., Benes V., Korbel J.O. DELLY: structural variant discovery by integrated paired-end and split-read analysis. Bioinformatics. 2012;28:i333–i339. - PMC - PubMed

Publication types

Associated data