. 2015 Feb;100(2):178-87.
doi: 10.3324/haematol.2014.114405. Epub 2014 Dec 22.

Dexamethasone targeted directly to macrophages induces macrophage niches that promote erythroid expansion

Affiliations

Dexamethasone targeted directly to macrophages induces macrophage niches that promote erythroid expansion

Mario Falchi et al. Haematologica. 2015 Feb.

Abstract

Cultures of human CD34(pos) cells stimulated with erythroid growth factors plus dexamethasone, a model for stress erythropoiesis, generate numerous erythroid cells plus a few macrophages (approx. 3%; 3:1 positive and negative for CD169). Interactions occurring between erythroblasts and macrophages in these cultures and the biological effects associated with these interactions were documented by live phase-contrast videomicroscopy. Macrophages expressed high motility interacting with hundreds/thousands of erythroblasts per hour. CD169(pos) macrophages established multiple rapid 'loose' interactions with proerythroblasts leading to formation of transient erythroblastic island-like structures. By contrast, CD169(neg) macrophages established 'tight' interactions with mature erythroblasts and phagocytosed these cells. 'Loose' interactions of CD169(pos) macrophages were associated with proerythroblast cytokinesis (the M phase of the cell cycle) suggesting that these interactions may promote proerythroblast duplication. This hypothesis was tested by experiments that showed that as few as 103 macrophages significantly increased levels of 3-(4,5-dimethylthiazolyl-2)-2,5-diphenyltetrazolium bromide incorporation frequency in S/G2/M and cytokinesis expressed by proerythroblasts over 24 h of culture. These effects were observed also when macrophages were co-cultured with dexamethasone directly conjugated to a macrophage-specific CD163 antibody. In conclusion, in addition to promoting proerythroblast proliferation directly, dexamethasone stimulates expansion of these cells indirectly by stimulating maturation and cytokinesis supporting activity of macrophages.


Figures

Figure 1.
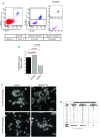
Figure 1.
Dex promotes both generation of macrophages and cell-cell interactions in HEMA culture. (A) FACS analyses for CD36/CD235a expression of cells in the aggregate gate of day 14 HEMA cultures with or without Dex, as indicated. Results are representative of those obtained in 5 separate experiments. (B) Phase-contrast observations of cells present at day 14 in parallel HEMA cultures established with (right panel) or without (left panel) Dex, as indicated (4×10⁵ cells/mL in both cases). The apparently greater cell density observed in the right panel is due to the fact that Erys obtained with Dex moved toward each other establishing large cell aggregates, while those obtained without Dex did not (see Table 1, Online Supplementary Movies 1 and 2).
Figure 2.
Figure 2.
Dynamics of interactions occurring among macrophages and Erys in HEMA culture. Comparison of interactions established between macrophages and Erys at day 14 of HEMA culture identified in snap shots of cytospins stained by May-Grunwald and in time-lapse observations. Photographs were taken with a camera with a 10× lens mounted on a microscope with a 20× objective (final magnification 200×). In both cases, macrophages were identified either isolated or in ‘loose’ and ‘tight’ contacts with Erys. Dynamics of ‘loose’ and ‘tight’ interaction are depicted in Online Supplementary Figure S4 and Online Supplementary Movies 3 and 5.
Figure 3.
Figure 3.
Co-culture with low numbers of macrophages increases proliferation and frequency in G2/S of prospectively isolated proErys. (A) Cell purification strategy. FSC-A/Sytox Blue and CD36pos/CD235aneg gating used to prospectively isolate macrophages (red dots), proErys (blue contour) and mature Erys (purple contour) from cells obtained at day 10–11 of HEMA culture. The purity of sorted cells was assessed by FACS reanalysis and May-Gruwald staining. Prospectively isolated cells were used in co-culture experiments presented in B-D. (B) MTT incorporation by proErys cultured in HEMA for 24 h either alone or with increasing numbers of macrophages (straight line). Levels of MTT incorporated by increasing numbers of macrophages cultured alone (dotted line) and by non-purified cell populations (2×10⁵ cells/well) (bar graph) are reported for comparison. Results are presented as mean (±SD) of those obtained in 4 separate experiments performed in duplicate. *P<0.01 with respect to proErys cultured without macrophages. (C) Levels of MTT incorporated by proErys alone (dotted line) or by proErys co-cultured with macrophages (straight line) without or with increasing concentration of the FAK inhibitor PF-562271. Results are presented as mean (±SD) of 3 experiments performed in triplicate. (D) Cell cycle analysis of proErys present in the total population generated at day 10 in HEMA culture (top panel) and of proErys prospectively isolated from these cells cultured either alone (middle panel) or with 103 macrophages (bottom panel). All the cells had been cultured for 24 h under standard HEMA conditions. The frequency of cells in G1 (green peak), S (yellow peak) and G2/M (blue peak) was calculated with FlowJo software.
Figure 4.
Figure 4.
Macrophages promote proEry cytokinesis in HEMA culture. (A) Dynamics of cell interactions and of cytokinetic events occurring in cultures of prospectively isolated proEry (2×10⁵/mL) cultured for 7 h in HEMA either alone (top panels) or with prospectively isolated macrophages (2×10³/well)(bottom panels). Areas indicated by rectangles are presented at greater magnification in the panels below (original magnification 100 × and 150 ×, respectively). Frames selected from 7h of image recording. The yellow and blue arrows indicate macrophages and cytokinesis events of proEry doublets, respectively. Similar results were observed in one additional experiment (see Online Supplementary Movies 8 and 9). (B) Number of cytokinesis events observed over time in cultures of purified proErys cultured either alone or with 2×10³ CD14pos macrophages (Φ) purified from the same HEMA culture. All the cultures were stimulated with concentrations of SCF, IL-3, EPO and Dex that stimulate optimal growth of proErys.
Figure 5.
Figure 5.
Macrophages that stimulate proEry proliferation express CD169 and CD163. (A) Flow cytometry determinations of the frequency of macrophages at day 10 of HEMA culture. Macrophages were characterized on the basis of CD16, CD14, CD163 and CD169 expression. (B) Levels of MTT incorporated by proErys cultured either alone or in the presence of CD169pos or CD169neg macrophages, as indicated. Results are presented as mean (±SD) of those observed in 2 separate experiments performed in triplicate. (C) Cell interactions occurring when prospectively isolated proErys or mature Erys (2×10⁵/mL for both) are co-cultured in HEMA with prospectively isolated CD169pos or CD169neg macrophages (2×10³/mL for both), as indicated. Yellow arrow: macrophage. (D) Number of cytokinesis events observed over time in cultures of purified proErys cultured either alone or with 2×10³ CD169pos or CD169neg macrophages (Φ) purified from the same HEMA cultures. *Values statistically different by Wilcoxon-Mann-Whitney test (P<0.05). Cultures with CD169neg macrophages were observed only for 2 h because the macrophages lost motility and appear dead after the first hour of observation. Results are representative of those obtained in 3 different experiments.
Figure 6.
Figure 6.
Dex stimulates macrophages to sustain Ery proliferation. (A) Reverse-phase protein array for proteins involved in cell interaction in Erys expanded from 3 different adult blood donors (1, 2 and 3) with or without Dex. The differentially enriched signal intensities were analyzed with Wilcoxon rank test and then expressed as ratio between values observed without Dex and those expressed with Dex (FC: fold change). Signals significantly (P<0.05) up-regulated (FC<1) or down-regulated (FC>1) by Dex are indicated in red and green fonts, respectively. In the case of the inhibitory T24/T32 modification, the FC<1 indicates that Dex activates FOXO1/O3. (B) Levels of MTT incorporated by 105 proErys cultured either alone or with 2×10³ macrophages. Before being added to the co-culture, macrophages were incubated for 30 min with SCF, IL-3 and EPO supplemented or not with Dex. Results are expressed as relative MTT incorporation using the levels incorporated by proErys preincubated with Dex cultured alone as 1 and are presented as mean (±SD) of 4 independent experiments performed in triplicate. (C) Levels of MTT incorporated by cells harvested from day 10 of HEMA culture, growth factor deprived for 4 h and then cultured for additional 24 h either in media (None) or with SCF, IL-3 and EPO (+GF) or with GF plus Dex (10−6 M), CD163 or CD163 directly conjugated with Dex (Dex/CD163, at a concentration equivalent to 10−6 M Dex). The amount of natural glucocorticoids present in these experiments was minimized by the use of media containing charcoal-treated FBS. Results are presented as mean (±SD) of 3 independent experiments performed in triplicate and P values calculated with Anova. (D) Numbers of cytokinesis events observed over time when the unfractionated population present at day 10 in HEMA culture is cultured without Dex, with Dex, with free CD163 antibody (anti-CD163) or with a CD163 antibody directly conjugated with four molecules of Dex (Dex-anti-CD163). *Values statistically different by Wilcoxon-Mann-Whitney test (P<0.05). Results are representative of those obtained in 2 separate experiments.

References

    1. Gursoy A, Dogruk Unal A, et al. Polycythemia as the first manifestation of Cushing’s disease. J Endocrinol Invest. 2006;29(8):742–744. - PubMed
    1. Bauer A, Tronche F, Wessely O, et al. The glucocorticoid receptor is required for stress erythropoiesis. Genes Dev. 1999;13(22): 2996–3002. - PMC - PubMed
    1. Dolznig H, Grebien F, Deiner EM, et al. Erythroid progenitor renewal versus differentiation: genetic evidence for cell autonomous, essential functions of EpoR, Stat5 and the GR. Oncogene. 2006; 25(20):2890–2900. - PMC - PubMed
    1. Migliaccio G, Masiello F, Tirelli V, et al. Under HEMA conditions, self-replication of human erythroblasts is limited by autophagic death. Blood Cells Mol Dis. 2011;47(3):182–197. - PubMed
    1. Varricchio L, Masselli E, Alfani E, et al. The dominant negative beta isoform of the glucocorticoid receptor is uniquely expressed in erythroid cells expanded from polycythemia vera patients. Blood. 2011; 118(2):425–436. - PMC - PubMed

Publication types

MeSH terms