. 2014 Dec 22;207(6):767-82.
doi: 10.1083/jcb.201408049.

Osmotic surveillance mediates rapid wound closure through nucleotide release

Affiliations

Osmotic surveillance mediates rapid wound closure through nucleotide release

William J Gault et al. J Cell Biol. .

Abstract

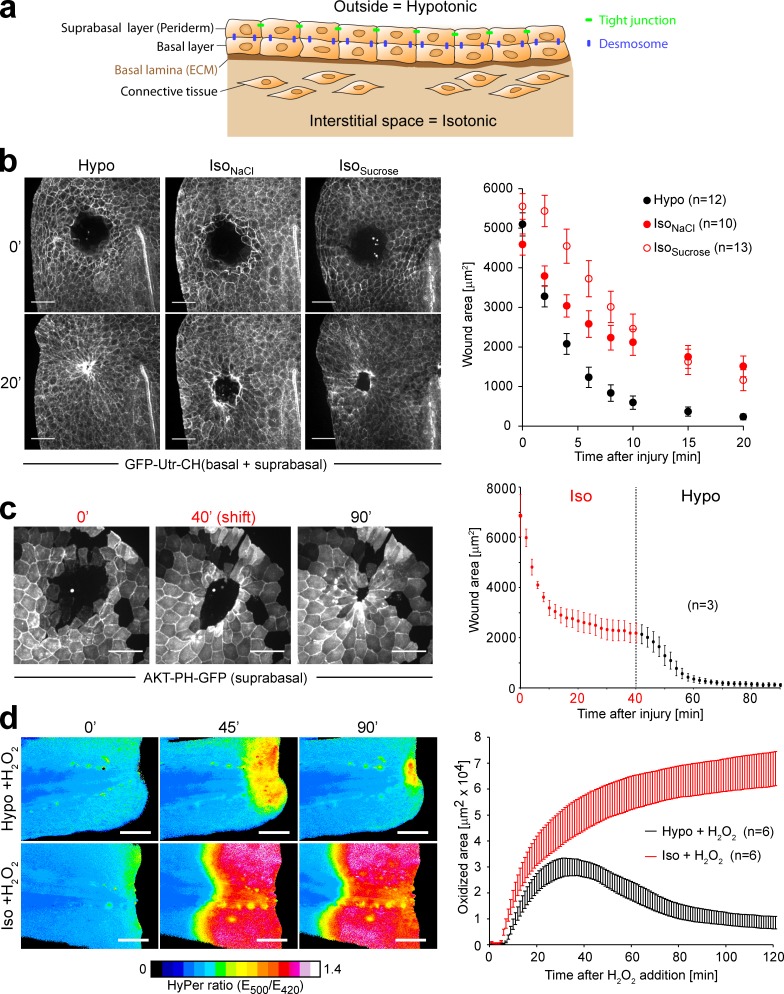
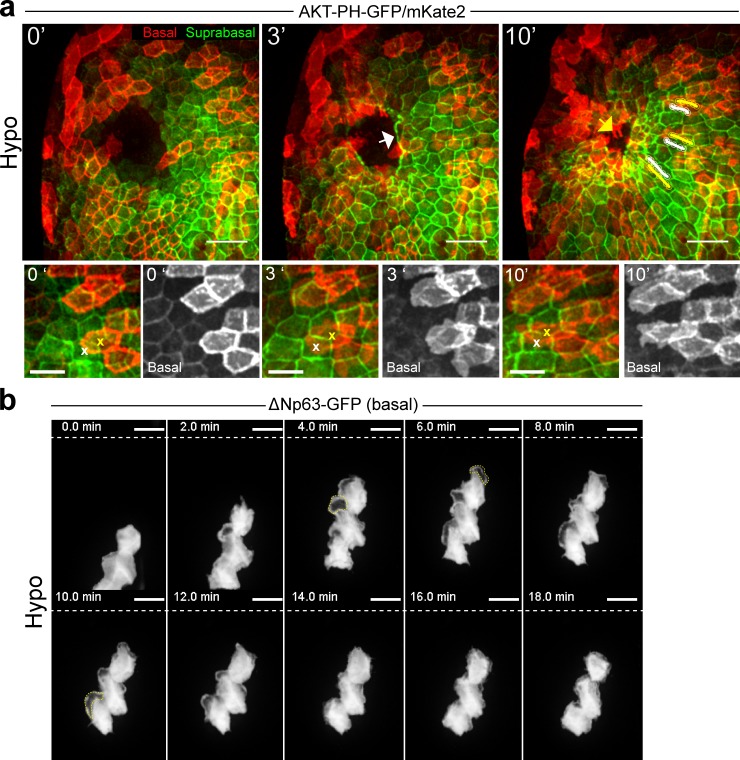
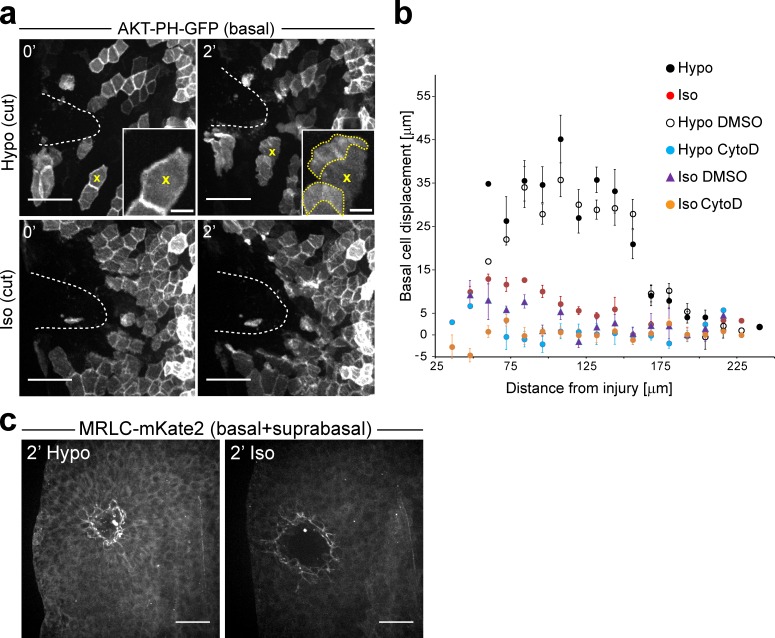
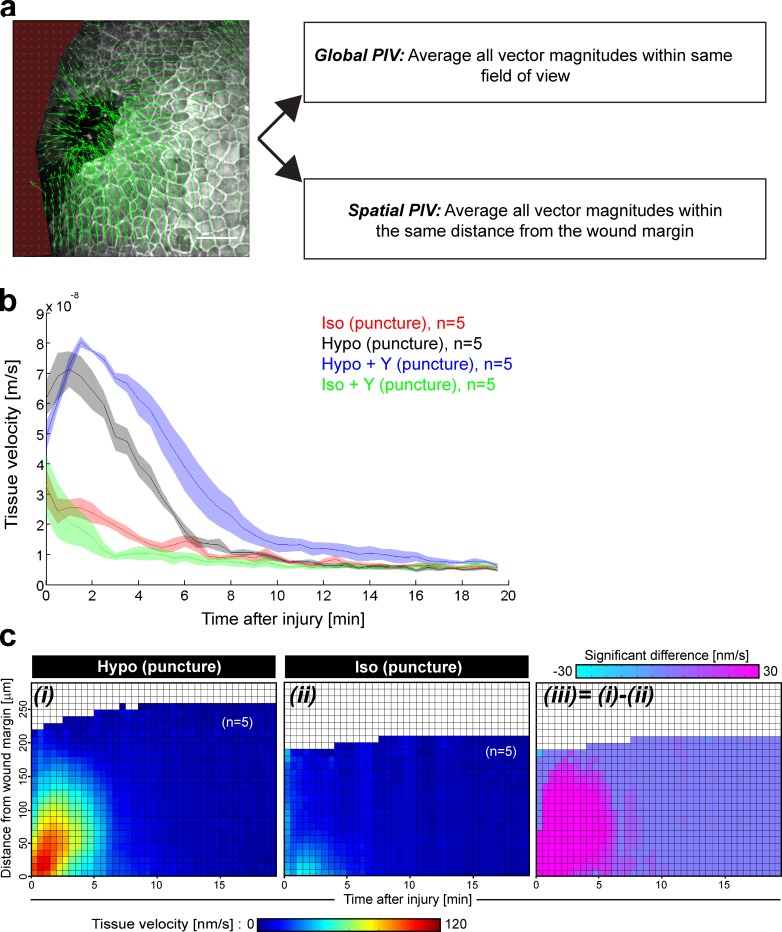
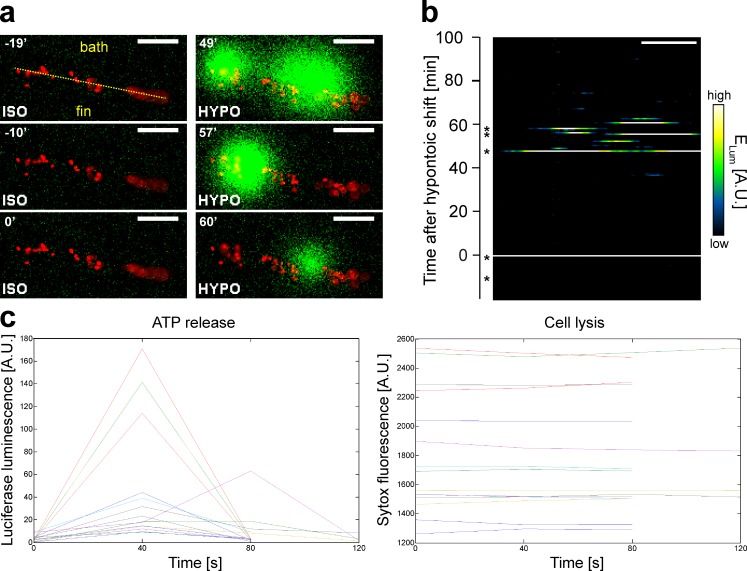
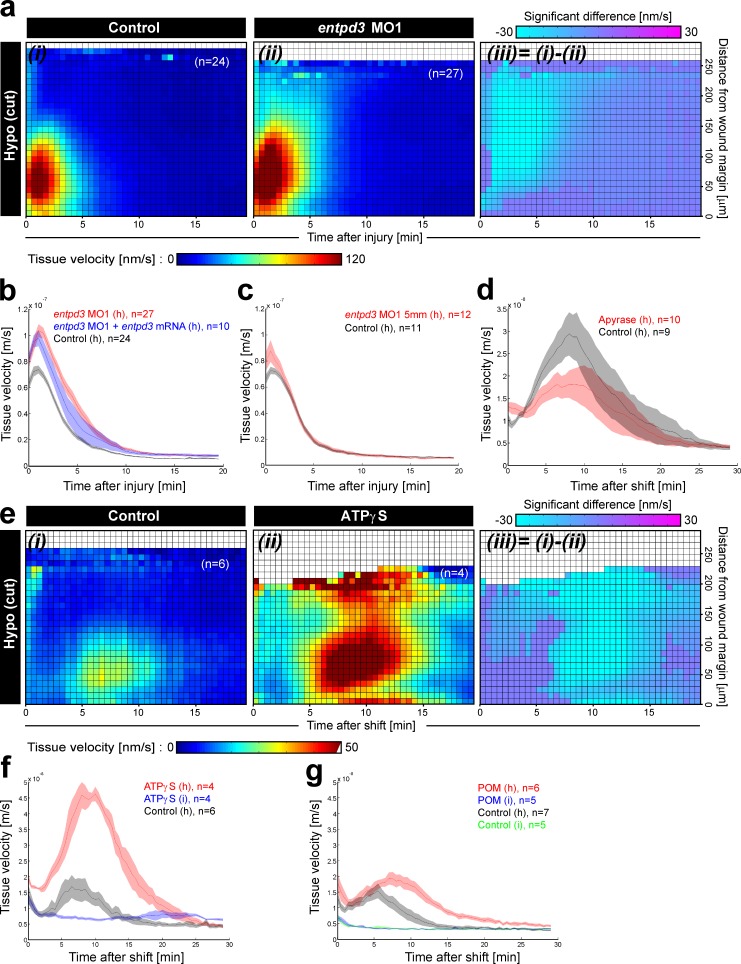
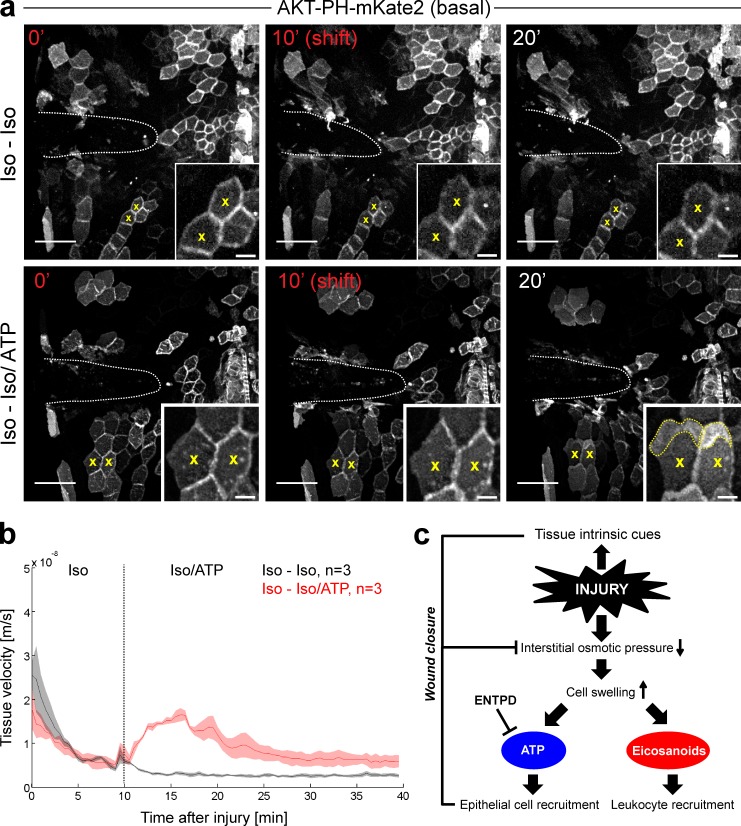
Osmotic cues from the environment mediate rapid detection of epithelial breaches by leukocytes in larval zebrafish tail fins. Using intravital luminescence and fluorescence microscopy, we now show that osmolarity differences between the interstitial fluid and the external environment trigger ATP release at tail fin wounds to initiate rapid wound closure through long-range activation of basal epithelial cell motility. Extracellular nucleotide breakdown, at least in part mediated by ecto-nucleoside triphosphate diphosphohydrolase 3 (Entpd3), restricts the range and duration of osmotically induced cell migration after injury. Thus, in zebrafish larvae, wound repair is driven by an autoregulatory circuit that generates pro-migratory tissue signals as a function of environmental exposure of the inside of the tissue.


Figures

Figure 1.
Figure 1.
A transepithelial osmotic pressure gradient is required for rapid wound closure and barrier reconstitution of zebrafish tail fin wounds. (a) Simplified scheme of larval zebrafish tail fin epithelium ∼3 dpf. Putative cell–cell contacts are indicated. (b, left) Representative time-lapse montage of zebrafish larvae immersed in hypotonic (Hypo) or isotonic (IsoNaCl, IsoSucrose) solutions at the indicated times after UV laser puncture injury. The actin cytoskeleton is labeled with GFP-Utr-CH. Bars, 50 µm. (b, right) Quantification of wound area as a function of time after injury. (c, left) Time-lapse montage of suprabasal AKT-PH-GFP (plasma membrane PIP3) expressing zebrafish larvae wounded and incubated in isotonic mounting agar (0′–40’), and overlaid with hypotonic fish bathing solution (40’–90’). Bars, 50 µm. (c, right) Quantification of wound area as a function of time after injury. Red indices, isotonic conditions. (d, left) Representative time-lapse montage of Tg(actb2:HyPer) larvae subjected to 1 mM H2O2 in hypotonic or isotonic bathing medium 1 h after tail fin tip amputation in isotonic bathing medium. The HyPer probe is reversibly oxidized by H2O2 that enters the fish through the wound, increasing the HyPer (E500/E420) emission ratio and probing for wound permeability as a function of time after injury. HyPer emission ratios are color-coded. Bars, 100 µm. (d, right) Quantification of oxidized tissue area as defined by high HyPer ratios (>0.64). Error bars indicate SEM of indicated (n) number of larvae. See Videos 1–3.
Figure 2.
Figure 2.
Epithelial cell layers within the larval zebrafish epidermis exhibit distinct morphological wound closure mechanisms. (a) Time-lapse images of a representative 2.5–3-dpf zebrafish larva at the indicated times after UV laser–induced injury. (a, top) Transgenic Tg(krt4:AKT-PH-GFP) expression of AKT-PH-GFP driven in the suprabasal cell layer (green) is observed simultaneously with mosaic AKT-PH-mKate2 in underlying basal epidermal cells (4–8-cell-stage mRNA injection; red) after puncture wounding in hypotonic E3 medium. Basal cells form lamellipodia and translocate collectively toward the wound, whereas the suprabasal cells translocate and elongate without visible lamellipodia. Note that basal cells at the margin can protrude across the wound opening (yellow arrow), whereas suprabasal cells at the margin align to form a smooth wound edge indicative of contractile “purse string” closure (white arrow). Basal and suprabasal cells maintain a largely consistent proximity; representative center of mass tracks for basal (yellow) and suprabasal (white) cells are shown (10’, top right panel). Bars, 50 µm. (a, bottom) Enlargement of a region in the top panel; basal cell (yellow x) and neighboring suprabasal cell (white x) correspond to upper tracks in top right panel. Bars, 25 µm. All images are from a partial z projection to capture an individual epidermal bilayer. See Video 4. (b) Representative images of a 2.5–3-dpf zebrafish larva mosaically expressing GFP under the control of a basal cell–specific ΔNp63 promoter, immersed in hypotonic bathing solutions shown at indicated times after UV laser cut injury. Broken white line, position of wound. Broken yellow lines, outlines of representative lamellipodial protrusions. Bars, 25 µm.
Figure 3.
Figure 3.
A drop in interstitial osmotic pressure after injury stimulates basal cell migration. (a) Representative images of 2.5–3-dpf zebrafish larvae mosaically expressing AKT-PH-GFP in basal cells (4–8-cell-stage mRNA injection), immersed in hypotonic or isotonic bathing solutions at the indicated times after UV laser cut injury. Broken white lines, wound margin. Yellow x, representative cell developing a lamellipodium (yellow dotted line) in response to a wound-induced exposure to hypotonicity. (b) Quantification of basal cell migration in zebrafish larvae mosaically labeled by one-cell stage actb2:Akt-PH-GFP DNA injections. Cell migration was tracked for ∼19 min after wounding in hypotonic medium (Hypo), isotonic medium (Iso), and hypotonic medium supplemented with 100 µM cytochalasin D (Hypo CytoD) to probe actin-dependent motility, DMSO control (Hypo DMSO), isotonic medium supplemented with 100 µM cytochalasin D (Iso CytoD), or Iso DMSO control (Iso DMSO). Mean basal cell displacement as a function of initial distance to the wound is shown for n = 123 cells/8 tail fins (Hypo), 114 cells/8 tail fins (Iso), 62 cells/5 tail fins (Hypo DMSO), 86 cells/6 tail fins (Hypo Cyto D), 79 cells/7 tail fins (Iso DMSO), and 122 cells/8 tail fins (Iso CytoD). Error bars indicate SEM. (c) Representative images of myosin II recruitment 2 min after UV-puncture injury in hypotonic (left) or isotonic (right) medium. Myosin recruitment is visualized by mKate2-labeled myosin regulatory light chain (one-cell stage mRNA injection). Bars: (a, main panels) 50 µm; (a, insets) 10 µm; (c) 50 µm.
Figure 4.
Figure 4.
Quantitative analysis of wound-induced epithelial sheet movement by PIV. (a) Representative example of PIV analysis (PIVlab, MATLAB) of epithelial sheet movement after UV puncture injury of a Tg(krt4:AKT-PH-GFP) larva exhibiting plasma membrane labeling in the suprabasal layer. Green arrows, velocity vectors derived by comparing particle movements between subsequent frames. Red area, extra-tissue area excluded from analysis. Bar, 50 µm. (b) Global PIV analysis of UV-puncture wounded Tg(krt4:AKT-PH-GFP) larvae immersed in solutions of indicated composition (Y = Y27632, Rho-kinase inhibitor, 100 µM). The graph displays the mean of all velocity vector magnitudes within the unmasked field of view as a function of time after injury. (c) Spatial PIV analysis representing the Iso and Hypo datasets from b as spatially resolved 3D plots. (i and ii) Averaged spatial PIV plots of the indicated number of Tg(krt4:AKT-PH-GFP) larvae after UV-laser puncture injury in hypotonic or isotonic medium. Tissue velocities are color-coded (blue to green to yellow to red), and represented as a function of time after injury (x axis) and distance from injury site (y axis). (iii) Differential plot derived by subtraction of the indicated velocimetry plots, and t test filtering of statistically significant differences between groups (unpaired t test, P < 0.05 = significant difference). Statistically significant velocity differences are color-coded (turquoise to pink). Pink, positive values. Turquoise, negative values.
Figure 5.
Figure 5.
A drop in interstitial osmotic pressure triggers ATP release in wounded tail fins. (a) Representative fluorescence/luminescence images from a zebrafish larva at the indicated times after tail fin amputation in isotonic mounting agarose. After 20 min of isotonic incubation (left), the fish was overlaid with a bolus of hypotonic bathing solution (right). Red, SYTOX orange. Green, luminescence. Orientation of the tissue relative to the wound margin (yellow broken line) is indicated. Bars, 100 µm. (b) Representative kymograph (n = 6 for 20 min isotonic preincubation, n = 4 for 10 min isotonic preincubation) of luminescence emissions acquired by line scans of the wound margin (yellow broken line in Fig. 5 a). Asterisks mark the representative time points (shown in a) on the kymograph. White/yellow, high luminescence emission. Blue/green, low luminescence emission. Bar, 100 µm. (c) Representative intensity plots of the time-lapse data shown in panel a displaying either luciferase luminescence (left) or SYTOX orange fluorescence (right); plots correspond to intensity measurements taken within a 100-µm-diameter region of interest around the center of each ATP luminescent flash. Measurements start one frame before, and end 1–2 frames after each luminescence peak (40 s per frame). Color-coded traces correspond to matching measurements of respective luminescence and fluorescence. The intensity measurements were performed on one representative sample from the dataset depicted in a.
Figure 6.
Figure 6.
Epithelial movements in response to hypotonic injury are regulated by extracellular NTP hydrolysis. (a, i and ii) Spatial PIV analysis of the indicated number of Tg(krt4:AKT-PH-GFP) larvae subjected to UV laser cut injury in hypotonic medium, with or without translation morpholino-mediated knockdown of entpd3 mRNA (entpd3 MO1; ∼19 ng). (b) Global PIV analysis of the datasets in panel a additionally including morpholino-rescue data (blue curve). (c) Global PIV analysis of MO1 five-nucleotide mismatched control morpholino (entpd3 MO1 5 mm; ∼19 ng). (d) Global PIV analysis of Tg(krt4:AKT-PH-GFP) larvae subjected to mechanical tail fin tip amputation in isotonic solution ± potato apyrase (50 U/ml). After a 10-min preincubation in isotonic mounting agarose with or without apyrase, fish were overlaid with a bolus of hypotonic solution (to initiate the wound response) with or without apyrase. Note that velocimetry analysis does not include the isotonic preincubation period (i.e., t = 0’ in plot is 10’ after injury). (e, i and ii) Spatial PIV analysis of the indicated number of Tg(krt4:AKT-PH-GFP) and Tg(krt4:AKT-PH-mKate2) larvae subjected to UV laser cut injury in hypotonic medium, with or without ATPγS to globally inhibit extracellular NTP hydrolysis. After a 10-min preincubation in isotonic mounting agarose ± 5 mM ATPγS (in the interface drop), fish were overlaid with a bolus of hypotonic solution (to initiate the wound response) ± 5 mM ATPγS. As in d, the velocimetry analysis does not include the isotonic preincubation period. (e, iii) Differential plot derived by subtraction of the indicated velocimetry plots, and t test filtering of statistical significant differences between experimental groups. Statistically significant velocity differences are color-coded (turquoise to pink). Pink, positive values. Turquoise, negative values. (f) Global PIV analysis of the above datasets including data representing the effect of ATPγS after isotonic injury (blue curve). (g) Global PIV analysis of Tg(krt4:AKT-PH-GFP) larvae subjected to UV laser cut injury in isotonic/hypotonic solution ± POM (ENTPD inhibitor, 100 µM). After a 10-min preincubation period in isotonic mounting agarose ± POM, fish were overlaid with a bolus of hypotonic (to initiate the wound response) or isotonic solution ± POM. Note that velocimetry analysis does not include the isotonic preincubation period (i.e., t = 0’ in the plot is 10’ after injury). See also Video 8.
Figure 7.
Figure 7.
ATP reconstitutes basal cell migration and epithelial sheet movement in the absence of a transepithelial osmotic gradient. (a) Representative time-lapse images of zebrafish larvae exhibiting mosaic plasma membrane AKT-PH-mKate2 labeling of predominately basal cells (4–8-cell-stage mRNA injection). Larvae were subjected to UV-laser-cut wounding in isotonic mounting agarose. After 10 min of isotonic preincubation (red time indices), a bolus of isotonic solution ± 5 mM ATP was added to the imaging dish. Yellow x, representative morphological response after addition of isotonic solution ± 5 mM ATP. Note that formation of AKT-PH-mKate2–rich membrane protrusions (yellow broken line) after iso-iso/ATP, but not iso-iso shifting. The same representative iso-iso control and data set were used in Fig. S5 a. See also Video 9. Bars: (main panels) 50 µm; (inset) 10 µm. (b) Global PIV analysis of the indicated number of larvae exhibiting ubiquitous plasma membrane labeling (one-cell stage AKT-PH-mKate2 mRNA yolk injection). Larvae were subjected to UV-laser-cut wounding in isotonic mounting agarose. After 10 min of isotonic incubation, a bolus of isotonic medium ± 5 mM ATP was added to the sample. (c) Proposed circuitry scheme of tissue intrinsic and environmentally triggered branches of the wound response in zebrafish tail fins. Tissue-intrinsic mechanisms include purse-string contraction (not depicted). Environmentally dependent osmotic surveillance through secretion of nucleotides (epithelial cells) and eicosanoids (leukocytes) is depicted.

References

    1. Abreu-Blanco M.T., Verboon J.M., and Parkhurst S.M.. 2011. Cell wound repair in Drosophila occurs through three distinct phases of membrane and cytoskeletal remodeling. J. Cell Biol. 193:455–464 10.1083/jcb.201011018 - DOI - PMC - PubMed
    1. Beach J.R., Licate L.S., Crish J.F., and Egelhoff T.T.. 2011. Analysis of the role of Ser1/Ser2/Thr9 phosphorylation on myosin II assembly and function in live cells. BMC Cell Biol. 12:52 10.1186/1471-2121-12-52 - DOI - PMC - PubMed
    1. Beis I., and Newsholme E.A.. 1975. The contents of adenine nucleotides, phosphagens and some glycolytic intermediates in resting muscles from vertebrates and invertebrates. Biochem. J. 152:23–32. - PMC - PubMed
    1. Belousov V.V., Fradkov A.F., Lukyanov K.A., Staroverov D.B., Shakhbazov K.S., Terskikh A.V., and Lukyanov S.. 2006. Genetically encoded fluorescent indicator for intracellular hydrogen peroxide. Nat. Methods. 3:281–286 10.1038/nmeth866 - DOI - PubMed
    1. Bement W.M., Forscher P., and Mooseker M.S.. 1993. A novel cytoskeletal structure involved in purse string wound closure and cell polarity maintenance. J. Cell Biol. 121:565–578 10.1083/jcb.121.3.565 - DOI - PMC - PubMed

Publication types

Substances