. 2014 Dec 22;15(1):1164.
doi: 10.1186/1471-2164-15-1164.

Susceptibility loci revealed for bovine respiratory disease complex in pre-weaned holstein calves

Affiliations

Susceptibility loci revealed for bovine respiratory disease complex in pre-weaned holstein calves

Holly L Neibergs et al. BMC Genomics. .

Abstract

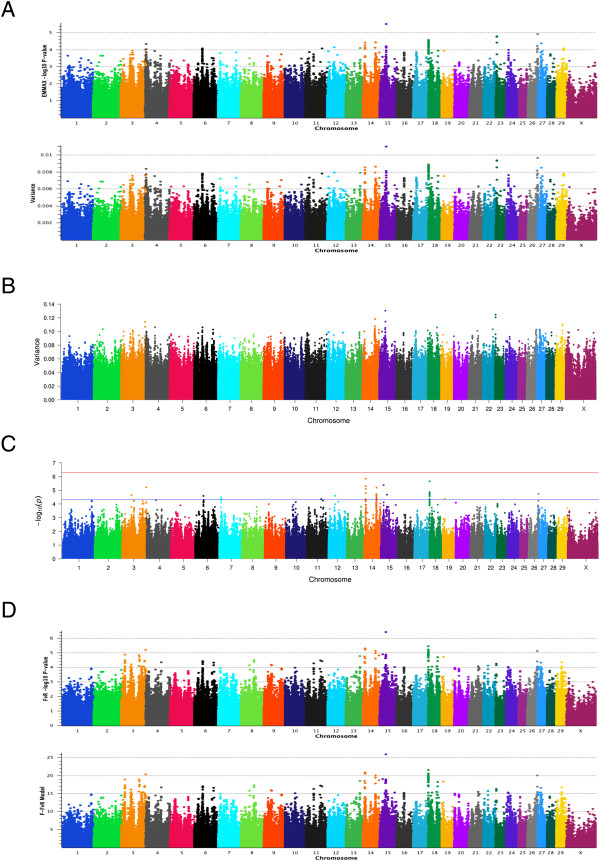
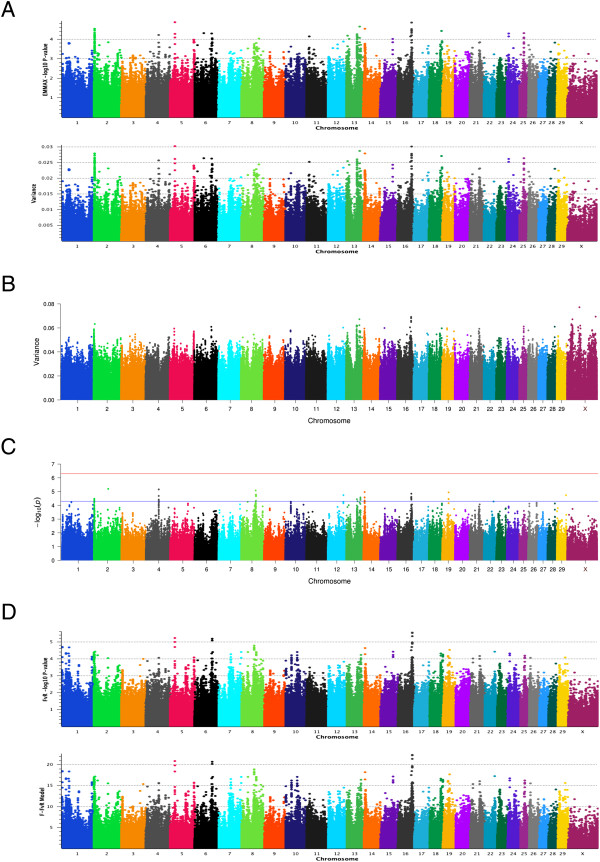
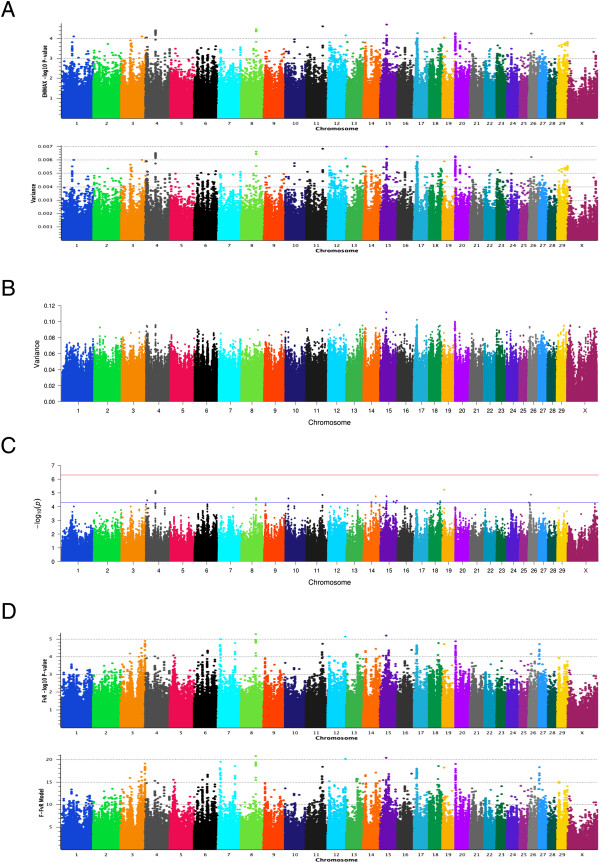
Background: Bovine respiratory disease complex (BRDC) is an infectious disease of cattle that is caused by a combination of viral and/or bacterial pathogens. Selection for cattle with reduced susceptibility to respiratory disease would provide a permanent tool for reducing the prevalence of BRDC. The objective of this study was to identify BRDC susceptibility loci in pre-weaned Holstein calves as a prerequisite to using genetic improvement as a tool for decreasing the prevalence of BRDC. High density SNP genotyping with the Illumina BovineHD BeadChip was conducted on 1257 male and 757 female Holstein calves from California (CA), and 767 calves identified as female from New Mexico (NM). Of these, 1382 were classified as BRDC cases, and 1396 were classified as controls, with all phenotypes assigned using the McGuirk health scoring system. During the acquisition of blood for DNA isolation, two deep pharyngeal and one mid-nasal diagnostic swab were obtained from each calf for the identification of bacterial and viral pathogens. Genome-wide association analyses were conducted using four analytical approaches (EIGENSTRAT, EMMAX-GRM, GBLUP and FvR). The most strongly associated SNPs from each individual analysis were ranked and evaluated for concordance. The heritability of susceptibility to BRDC in pre-weaned Holstein calves was estimated.

Results: The four statistical approaches produced highly concordant results for 373 top ranked SNPs that defined 126 chromosomal regions for the CA population. Similarly, in NM, 370 SNPs defined 138 genomic regions that were identified by all four approaches. When the two populations were combined (i.e., CA + NM) and analyzed, 324 SNPs defined 116 genomic regions that were associated with BRDC across all analytical methods. Heritability estimates for BRDC were 21% for both CA and NM as individual populations, but declined to 13% when the populations were combined.

Conclusions: Four analytical approaches utilizing both single and multi-marker association methods revealed common genomic regions associated with BRDC susceptibility that can be further characterized and used for genomic selection. Moderate heritability estimates were observed for BRDC susceptibility in pre-weaned Holstein calves, thereby supporting the application of genomic selection to reduce the prevalence of BRDC in U.S. Holsteins.


Figures

Figure 1
Figure 1
Manhattan plots representing four genome wide association analyses for the binary BRDC case–control phenotype using (A) EMMAX-GRM, (B) GBLUP, (C) EIGENSTRAT and (D) Full versus reduced model regression (FvR) in the CA calves. In panel A, the plot for EMMAX-GRM case–control with covariates of sex and age is shown. For EMMAX-GRM, the first panel shows the –log10 P-values on the Y axis and the second panel shows the proportion of variance explained by effects at a single SNP. In panel B, the plot for GBLUP case–control with covariates of sex and age is shown. The Y axis shows the proportion of variance explained by a sliding window of 7 SNPs centered on the third SNP within each window. In panel C, the plot for EIGENSTRAT case–control principal component corrected input data (top 100 principle components) with covariates of sex and age is shown. The –log10 P-values are indicated on the Y axis. The blue line indicates the Wellcome Trust threshold for SNPs with modest evidence for association with BRDC susceptibility, and the red line indicates the threshold for SNPs with strong evidence for association with BRDC susceptibility. In panel D, the Manhattan plot for FvR case–control principal component corrected input data (top 53 principal components) with covariates of sex and age is shown. The first FvR panel shows the –log10 P-values on the Y axis, and the second panel shows corresponding F-test values for the Full versus Reduced Model Analysis.
Figure 2
Figure 2
Manhattan plots representing four genome wide association analyses for the binary BRDC case–control phenotype using (A) EMMAX-GRM, (B) GBLUP, (C) EIGENSTRAT and (D) Full versus reduced model regression (FvR) in NM calves. In panel A, the plot for EMMAX-GRM case–control with covariates of sex and age is shown. For EMMAX-GRM, the first panel shows the –log10 P-values on the Y axis and the second panel shows the proportion of variance explained by effects at a single SNP. In panel B, the plot for GBLUP case–control with covariates of sex and age is shown. The Y axis shows the proportion of variance explained by a sliding window of 7 SNPs centered on the third SNP within each window. In panel C, the plot for EIGENSTRAT case–control principle component corrected input data (top 5 principal components) with the covariate age is shown. In panel C, the –log10 P-values are on the Y axis. The blue line indicates the Wellcome Trust threshold for SNPs with modest evidence for association with BRDC susceptibility, and the red line indicates the threshold for SNPs with strong evidence for association with BRDC susceptibility. In panel D, the Manhattan plot for FvR case–control principal component corrected input data (top 9 principal components) with covariates of sex and age is shown. The first FvR panel shows the –log10 P-values on the Y axis, and the second panel shows corresponding F-test values for the Full versus Reduced Model Analysis.
Figure 3
Figure 3
Manhattan plots representing four genome wide association analyses for the binary BRDC case–control phenotype using (A) EMMAX-GRM, (B) GBLUP, (C) EIGENSTRAT and (D) Full versus reduced model regression (FvR) in the CA and NM calves combined. In panel A, the plot for EMMAX-GRM case–control with covariates of sex, age, and herd of origin is shown. For EMMAX-GRM, the first panel shows the –log10 P-values on the Y axis and the second panel shows the proportion of variance explained by effects at a single SNP. In panel B, the plot for GBLUP case–control with covariates of sex and age is shown. The Y axis shows the proportion of variance explained by a sliding window of 7 SNPs centered on the third SNP within each window. In panel C, the plot for EIGENSTRAT case–control principle component corrected input data (top 80 principal components) with covariates of sex and age is shown. The –log10 P-values are indicated on the Y axis. The blue line indicates the Wellcome Trust threshold for SNPs with modest evidence for association with BRDC susceptibility, and the red line indicates the threshold for SNPs with strong evidence for association with BRDC susceptibility. In panel D, the Manhattan plot for FvR case–control principal component corrected input data (top 91 principal components) with covariates of sex, age, and herd of origin is shown. The first FvR panel shows the –log10 P-values on the Y axis, and the second panel shows corresponding F-test values for the Full versus Reduced Model Analysis.

Similar articles

Cited by

References

    1. National Agricultural Statistics Service . Cattle Death Loss. USA: Agricultural Statistics Board, United States Department of Agriculture; 2006.
    1. Fulton RW, Blood KS, Panciera RJ, Payton ME, Ridpath JF, Confer AW, Saliki JT, Burge LT, Welsh RD, Johnson BJ, Reck A. Lung pathology and infectious agents in fatal feedlot pneumonias and relationship with mortality, disease onset and treatments. J Vet Diagn Invest. 2009;21:464–477. doi: 10.1177/104063870902100407. - DOI - PubMed
    1. USDA . Feedlot 2011 Part IV: Health and Health Management on U.S. Feedlots with a capacity of 1,000 or more head. Fort Collins: USDA-APHIS-VS-CEAH-NAHMS; 2011.
    1. USDA . Dairy 2007, Heifer Calf Health and management practices on U.S. Dairy Operations. Fort Collins: USDA-APHIS-VS, CEAH; 2010.
    1. Guterbock WM. Anim Health Res Rev. 2014. The impact of BRD: the current dairy experience. - PubMed

Publication types