

The CatSper channel controls chemosensation in sea urchin sperm
- PMID: 25535245
- PMCID: PMC4339123
- DOI: 10.15252/embj.201489376
The CatSper channel controls chemosensation in sea urchin sperm
Abstract
Sperm guidance is controlled by chemical and physical cues. In many species, Ca(2+) bursts in the flagellum govern navigation to the egg. In Arbacia punctulata, a model system of sperm chemotaxis, a cGMP signaling pathway controls these Ca(2+) bursts. The underlying Ca(2+) channel and its mechanisms of activation are unknown. Here, we identify CatSper Ca(2+) channels in the flagellum of A. punctulata sperm. We show that CatSper mediates the chemoattractant-evoked Ca(2+) influx and controls chemotactic steering; a concomitant alkalization serves as a highly cooperative mechanism that enables CatSper to transduce periodic voltage changes into Ca(2+) bursts. Our results reveal intriguing phylogenetic commonalities but also variations between marine invertebrates and mammals regarding the function and control of CatSper. The variations probably reflect functional and mechanistic adaptations that evolved during the transition from external to internal fertilization.
Keywords: Ca2+ signaling; CatSper; chemotaxis; sperm.
© 2014 The Authors.
Figures
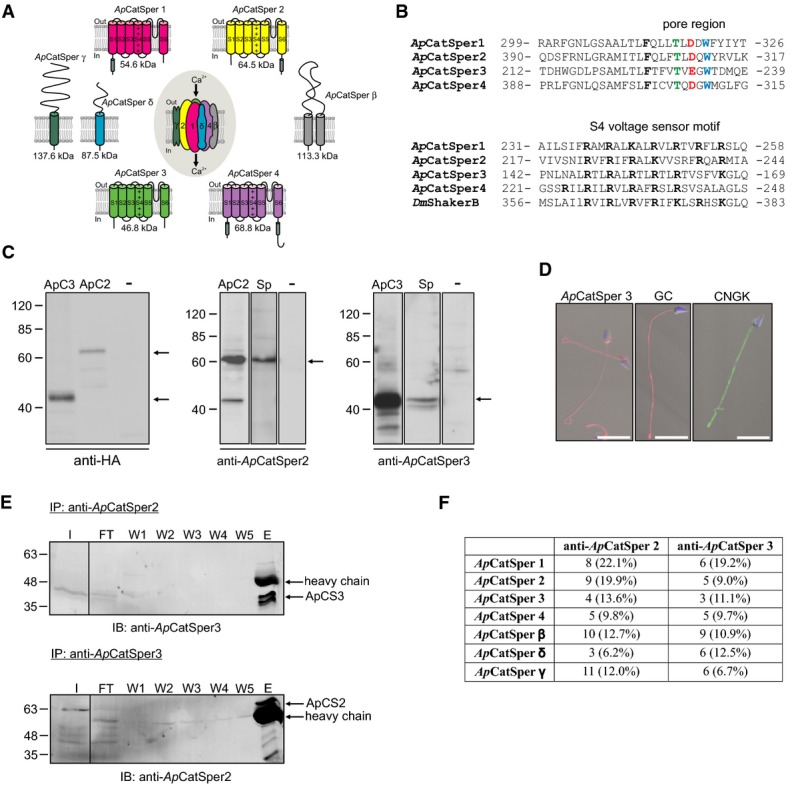
Predicted membrane topology and predicted molecular weight of ApCatSper 1–4 cloned from A. punctulata testis, and of ApCatSper β, δ, and γ. A gene encoding ApCatSper δ was identified in the A. punctulata genome; transcripts encoding ApCatSper β and ApCatSper γ were identified in the A. punctulata transcriptome. S1 to S6, transmembrane segments; +, positively charged amino acids in S4; gray cylinder, coiled-coil domain.
Upper panel, alignment of pore regions of ApCatSper 1–4. Amino acids of the Ca2+ selectivity-filter motif are highlighted. Lower panel, alignment of S4 voltage-sensor segments of ApCatSper 1–4 and of D. melanogaster ShakerB Kv channel. Positively charged amino acids are highlighted. Numbers indicate start and end position of amino acids of the selected region.
Western blots of total protein of CHO cells transfected with ApCatSper 2 or 3, non-transfected control cells (-), and A. punctulata sperm (Sp). The Western blots were probed with anti-HA, anti-ApCatSper 2, or anti-ApCatSper 3 antibodies. Arrows indicate bands representing ApCatSper 2 and 3.
Immunocytochemical analysis of sperm stained with anti-ApCatSper 3, anti-GC, or anti-CNGK antibodies; superposition of images obtained by fluorescence and bright-field microscopy; scale bar = 10 μm. The DNA was stained with DAPI (blue).
Western blot analysis of co-immunoprecipitation (IP) of A. punctulata sperm proteins. The input (I), flow through (FT), washes (W1-5), and the eluate (E) of the IP using the anti-ApCatSper 2 antibody were probed with the anti-ApCatSper 3 antibody (upper panel) and vice versa (lower panel). ApCatSper 3 and ApCatSper 2 were co-immunoprecipitated with the anti-ApCatSper 2 (upper panel) and anti-ApCatSper 3 antibody (lower panel), respectively.
Analysis by mass spectrometry of immunoprecipitated proteins. ApCatSper 1-4, β, γ, and δ were identified in the immunoprecipitates obtained with both the anti-ApCatSper 2 and anti-ApCatSper 3 antibodies. The number of tryptic peptides identified and the respective sequence coverage are given.
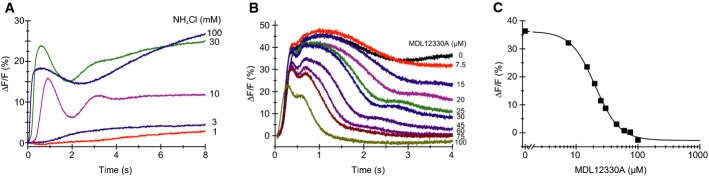
Alkaline-evoked Ca2+ signals in sperm mixed with NH4Cl; sperm were loaded with the Ca2+ indicator Fluo-4. ΔF/F (%) indicates the change in Fluo-4 fluorescence (ΔF) with respect to the basal fluorescence (F, mean of the first 3–5 data points).
Ca2+ signals evoked by mixing of sperm simultaneously with NH4Cl (30 mM) and the CatSper inhibitor MDL12330A.
Dose–response relation of inhibition of the Ca2+ signals shown in panel (B), Ki = 20 μM, amplitudes were determined at t = 4 s.
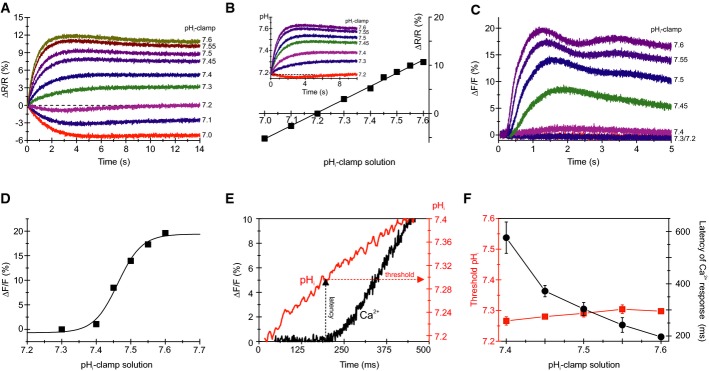
Changes in pHi evoked by mixing with pHi-clamp solutions (see explanation in the text); sperm were loaded with the pHi indicator BCECF. ΔR/R (%) indicates the change in the BCECF fluorescence emission ratio (ΔR = F494/F540) with respect to the basal ratio (R, mean of the first 3–5 data points).
Steady-state change (at t = 14 s) of BCECF fluorescence for the pHi signals shown in (A). The intercept of the fitted straight line with the x-axis yields the resting pHi; the slope of the straight line yields the ΔR/R (%) × ΔpH−1. Inset: calibrated changes in pHi evoked by various pHi-clamp solutions.
Ca2+ signals evoked by mixing of sperm with pHi-clamp solutions.
Dose–response relation for the Ca2+ signals shown in (C).
Calibrated pHi increase (red) and respective Ca2+ response (black) evoked by mixing of sperm with a pHi 7.6-clamp solution; depicted are, on an extended time scale, the first 500 ms of the respective pHi increase and Ca2+ signal shown in (B, inset) and (C), respectively. The threshold pHi for CatSper activation was deduced from the latency of the Ca2+ signal.
Threshold pHi and latency of Ca2+ signals evoked by various pHi-clamp solutions (mean ± SD; n ≥ 3).
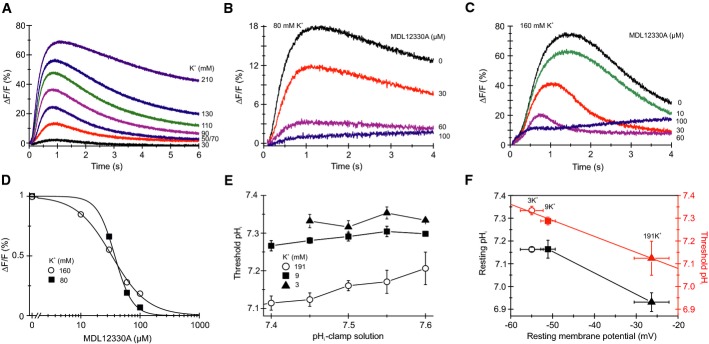
Depolarization-evoked Ca2+ signals in sperm mixed with ASW containing high KCl concentrations.
Ca2+ signals evoked by mixing of sperm with 80 mM KCl and the CatSper inhibitor MDL12330A.
Ca2+ signals evoked by mixing of sperm with 160 mM KCl and MDL12330A.
Dose–response relation for the Ca2+ signals shown in (B, C) at t = 1–2 s.
Threshold pHi for Ca2+ signals evoked by pHi-clamp solutions in sperm bathed in ASW containing low (3 mM), high (191 mM), and normal (9 mM) KCl (mean ± SD; n ≥ 3); data for 9 mM KCl are from Fig3F.
Resting pHi and resting Vm in sperm bathed in ASW containing low (3 mM), high (191 mM), and normal (9 mM) KCl (black) (mean ± SD; n ≥ 3). Mean threshold pHi for CatSper activation at different membrane potentials (red); mean threshold pHi was derived from data shown in (E).
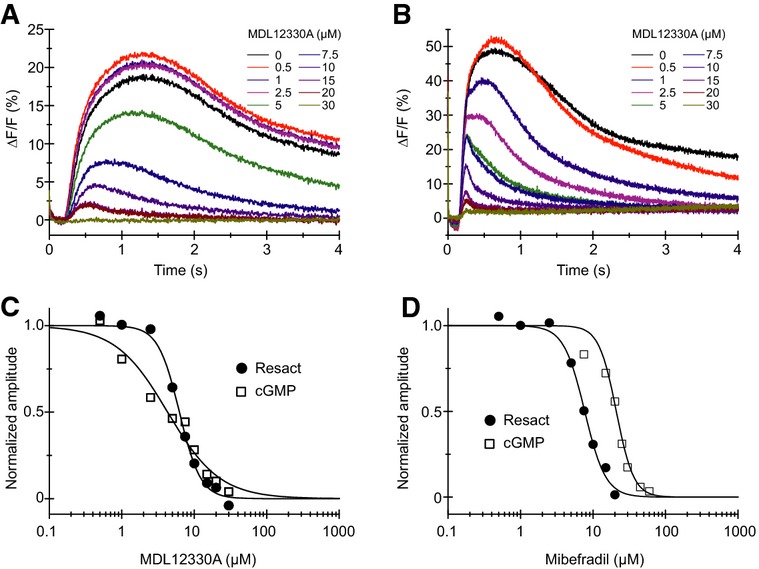
Ca2+ signals in sperm evoked by photorelease (at t = 0) of resact from caged resact in the presence of the CatSper inhibitor MDL12330A.
Ca2+ signals evoked by intracellular photorelease (at t = 0) of cGMP in sperm loaded with caged cGMP in the presence of the CatSper inhibitor MDL12330A.
Normalized dose–response relation for inhibition of the resact- and cGMP-induced Ca2+ signals shown in (A, B) (Ki = 6.2 and 4.3 μM, respectively).
Normalized dose-response relation for inhibition of the resact- and cGMP-induced Ca2+ signals shown in Supplementary Fig S4 by the CatSper inhibitor mibefradil (Ki = 7.7 and 20.9 μM, respectively).
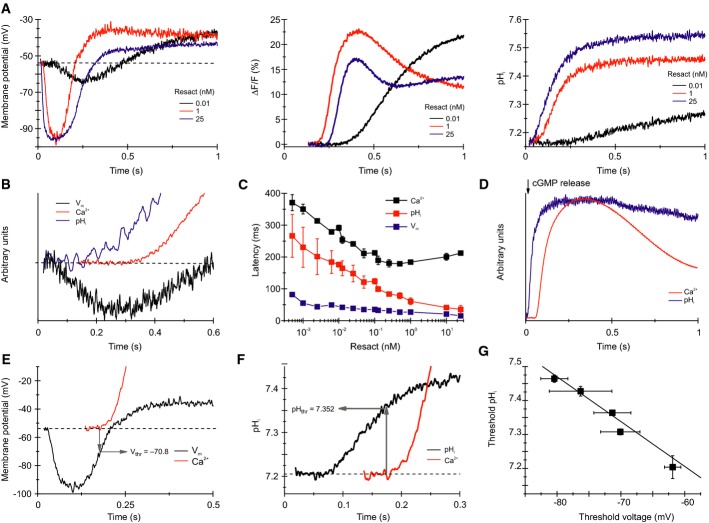
Calibrated Vm (left) and pHi (right) changes and Ca2+ signals (middle) evoked by resact.
Normalized Vm, pHi, and Ca2+ signals evoked by 10 pM resact; the first 600 ms after mixing are shown. The hyperpolarization precedes the pHi increase, whereas the pHi increase precedes the Ca2+ increase.
Latency of the Vm, the pHi, and the Ca2+ signals evoked by various resact concentrations (mean ± SD; n = 3).
Normalized pHi and Ca2+ signals evoked by photorelease of cGMP in sperm loaded with caged cGMP.
Calibrated Vm and Ca2+ signals evoked by 1 nM resact; the threshold voltage (Vthr) for the Ca2+ influx was deduced from the latency of the Ca2+ signal.
Calibrated pHi and Ca2+ signals evoked by 1 nM resact; the threshold pHi (pHthr) at which the Ca2+ influx commences was deduced from the latency of the Ca2+ signal.
Linear relationship between pHthr and Vthr for activation of Ca2+ influx by various resact concentrations (data derived from Supplementary Fig S6; mean ± SD; n ≥ 3).
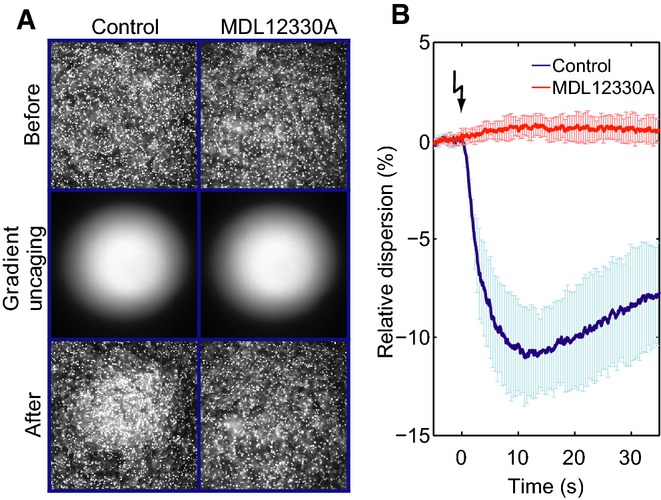
Dark-field microscopy images of a sperm suspension before (top) and after (bottom) photorelease of a resact gradient (middle) in the absence (control; left) or presence of the CatSper inhibitor MDL12330A (10 μM; right). MDL12330A abolishes resact-induced sperm accumulation.
Relative change of the sperm dispersion in the field of view evoked by photorelease of resact (t = 0, flash) in the absence (control; blue) or presence of MDL12330A (red); a decrease in dispersion indicates sperm accumulation in the irradiated area (mean ± SD; n = 4).
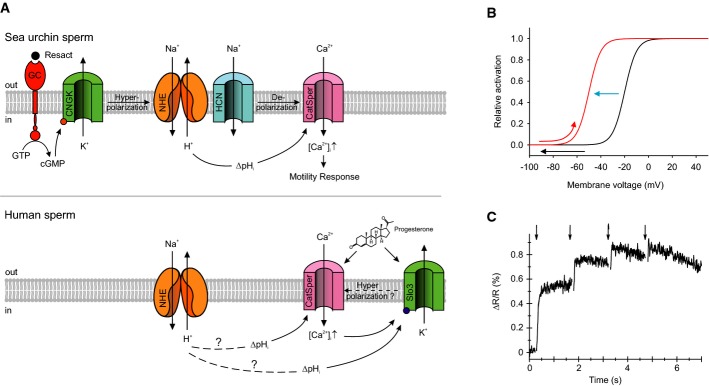
Signaling pathways in sperm of A. punctulata (upper panel) and humans (lower panel). Questionmarks above dashed lines in the lower panel indicate that the mechanism of how ΔpHi is produced and the hyperpolarization by Slo3 has not been firmly established. Solid lines indicate that the action of ΔpHi on CatSper and of ΔpHi and Ca2+ on Slo3 activity has been firmly established.
Model of the pHi-induced change in the voltage dependence and Vthr of CatSper; the resact-induced hyperpolarization (black arrow) evokes a rapid alkalization that shifts the voltage dependence of CatSper activation to more negative values (blue arrow) and, thereby, primes CatSper to open during the subsequent depolarization (red arrow).
Changes in pHi evoked by repetitive release (arrows) of cGMP from caged cGMP. The first UV flash was delivered at t = 0.
Similar articles
-
Modular analysis of the control of flagellar Ca2+-spike trains produced by CatSper and CaV channels in sea urchin sperm.PLoS Comput Biol. 2020 Mar 2;16(3):e1007605. doi: 10.1371/journal.pcbi.1007605. eCollection 2020 Mar. PLoS Comput Biol. 2020. PMID: 32119665 Free PMC article.
-
A K+-selective cGMP-gated ion channel controls chemosensation of sperm.Nat Cell Biol. 2006 Oct;8(10):1149-54. doi: 10.1038/ncb1473. Epub 2006 Sep 10. Nat Cell Biol. 2006. PMID: 16964244
-
Network model predicts that CatSper is the main Ca2+ channel in the regulation of sea urchin sperm motility.Sci Rep. 2017 Jun 26;7(1):4236. doi: 10.1038/s41598-017-03857-9. Sci Rep. 2017. PMID: 28652586 Free PMC article.
-
Tuning sperm chemotaxis.Biochem Soc Trans. 2010 Oct;38(5):1270-4. doi: 10.1042/BST0381270. Biochem Soc Trans. 2010. PMID: 20863297 Review.
-
Sperm chemotaxis and regulation of flagellar movement by Ca2+.Mol Hum Reprod. 2011 Aug;17(8):457-65. doi: 10.1093/molehr/gar041. Epub 2011 May 24. Mol Hum Reprod. 2011. PMID: 21610215 Review.
Cited by
-
The Ca2+ channel CatSper is not activated by cAMP/PKA signaling but directly affected by chemicals used to probe the action of cAMP and PKA.J Biol Chem. 2020 Sep 18;295(38):13181-13193. doi: 10.1074/jbc.RA120.013218. Epub 2020 Jul 23. J Biol Chem. 2020. PMID: 32703901 Free PMC article.
-
CatSper Calcium Channels: 20 Years On.Physiology (Bethesda). 2023 May 1;38(3):0. doi: 10.1152/physiol.00028.2022. Epub 2022 Dec 13. Physiology (Bethesda). 2023. PMID: 36512352 Free PMC article. Review.
-
Quantitative Intracellular pH Determinations in Single Live Mammalian Spermatozoa Using the Ratiometric Dye SNARF-5F.Front Cell Dev Biol. 2020 Jan 17;7:366. doi: 10.3389/fcell.2019.00366. eCollection 2019. Front Cell Dev Biol. 2020. PMID: 32010689 Free PMC article.
-
Chemical and physical guidance of fish spermatozoa into the egg through the micropyle†,‡.Biol Reprod. 2017 Apr 1;96(4):780-799. doi: 10.1093/biolre/iox015. Biol Reprod. 2017. PMID: 28371886 Free PMC article.
-
The regulation role of calcium channels in mammalian sperm function: a narrative review with a focus on humans and mice.PeerJ. 2024 Oct 25;12:e18429. doi: 10.7717/peerj.18429. eCollection 2024. PeerJ. 2024. PMID: 39469589 Free PMC article. Review.
References
Publication types
MeSH terms
Substances
LinkOut - more resources
Full Text Sources
Other Literature Sources
Miscellaneous
