

Agonist and antagonist switch DNA motifs recognized by human androgen receptor in prostate cancer
- PMID: 25535248
- PMCID: PMC4331004
- DOI: 10.15252/embj.201490306
Agonist and antagonist switch DNA motifs recognized by human androgen receptor in prostate cancer
Abstract
Human transcription factors recognize specific DNA sequence motifs to regulate transcription. It is unknown whether a single transcription factor is able to bind to distinctly different motifs on chromatin, and if so, what determines the usage of specific motifs. By using a motif-resolution chromatin immunoprecipitation-exonuclease (ChIP-exo) approach, we find that agonist-liganded human androgen receptor (AR) and antagonist-liganded AR bind to two distinctly different motifs, leading to distinct transcriptional outcomes in prostate cancer cells. Further analysis on clinical prostate tissues reveals that the binding of AR to these two distinct motifs is involved in prostate carcinogenesis. Together, these results suggest that unique ligands may switch DNA motifs recognized by ligand-dependent transcription factors in vivo. Our findings also provide a broad mechanistic foundation for understanding ligand-specific induction of gene expression profiles.
Keywords: ChIP‐exo; DNA motif switching; androgen receptor; prostate cancer; transcription factor.
© 2014 The Authors.
Figures
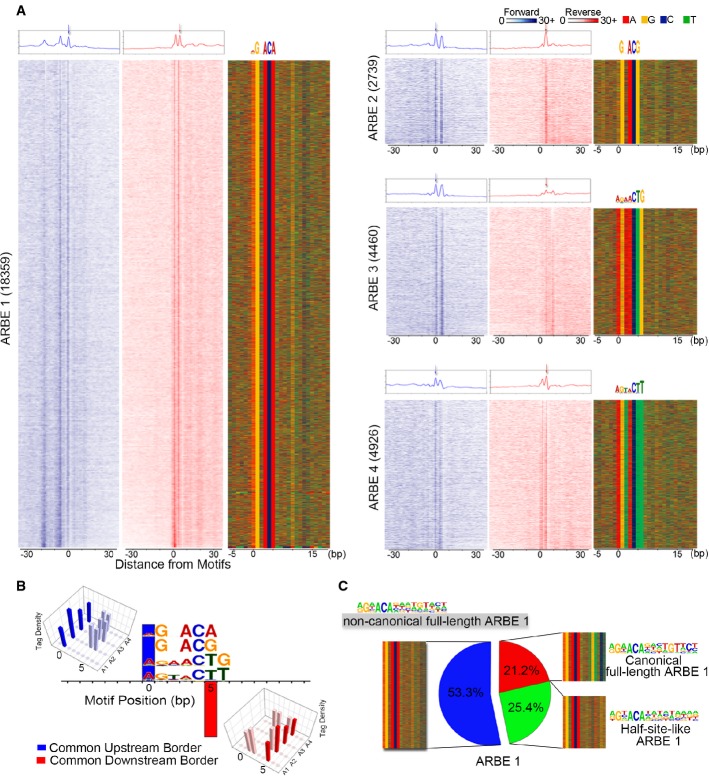
AR ChIP-exo defines four types of high-confidence agonist-liganded ARBEs. Numbers indicate motif counts. The first two columns of each ARBE panel show normalized tags distribution over ARBEs on the forward (blue) and reverse (red) strands, separately. Forward strand refers to the motif-containing strand. The aggregated tag density is shown at the top of the raw signal plots. The third column of each ARBE panel represents the bound motif sequences ordered as in the left two columns.
Comparison of tag density shows the four types of ARBEs are located between one common upstream border on the forward strand and one common downstream border on the reverse strand. Other border signals on ARBEs are also shown. The protected conserved nucleotides of each ARBE have the same distance to both common borders.
Clustering of ARBE1 based on the motif probability matrix of the extended second-half ARBE.
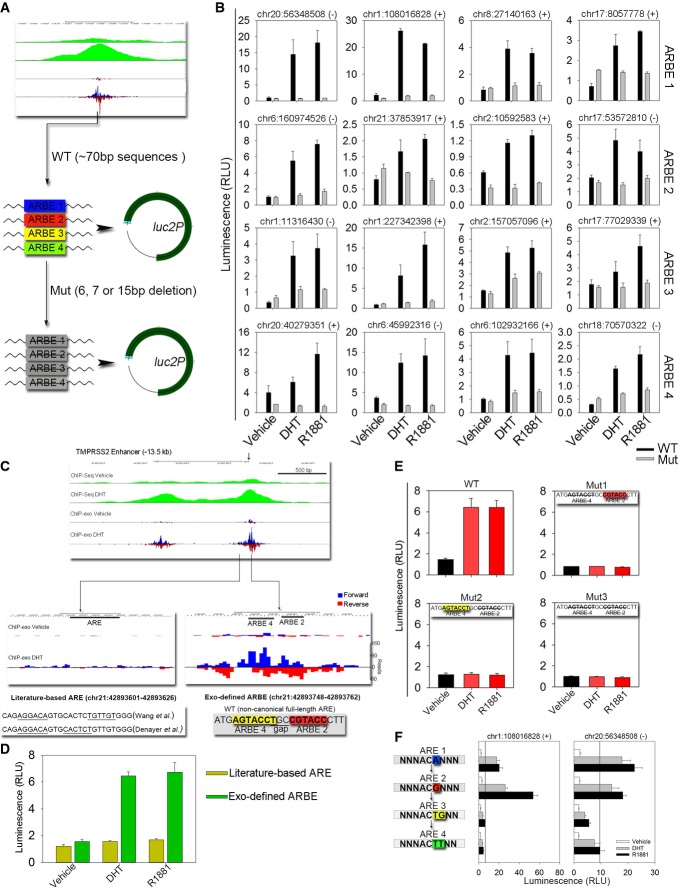
Schematic representation of ARBE wild-type (WT) and deletion mutant (Mut) reporters.
ARBE reporter constructs were transiently transfected into LNCaP cells. Cells were stimulated with DHT (100 nM), a synthetic androgen R1881 (10 nM), or vehicle for 16–24 h, and luciferase activities were measured. The results were presented as the mean ± SD of the quadruplicate transfections. The genomic positions of ARBEs are also shown.
UCSC genome browser showing signals on ChIP-exo defined TMPRSS2 −13.5 kb enhancer ARBE.
Enhancer activity was compared between literature-based ARE and Exo-defined ARBE in TMPRSS2 locus by reporter gene assay.
ARBE2 and ARBE4 were validated in TMPRSS2 enhancer through WT or Mut construct transfections. The results were presented as the mean ± SD of the quadruplicate transfections.
Two ARBE1 regions were changed to ARBE2, ARBE3, or ARBE4 through mutations at nucleotide 5 and/or 6. Cells were stimulated with DHT (100 nM), R1881 (10 nM), or vehicle for 16–24 h, and luciferase activities were measured. The results were presented as the mean ± SD of the quadruplicate transfections. The genomic positions of ARBEs are also shown.
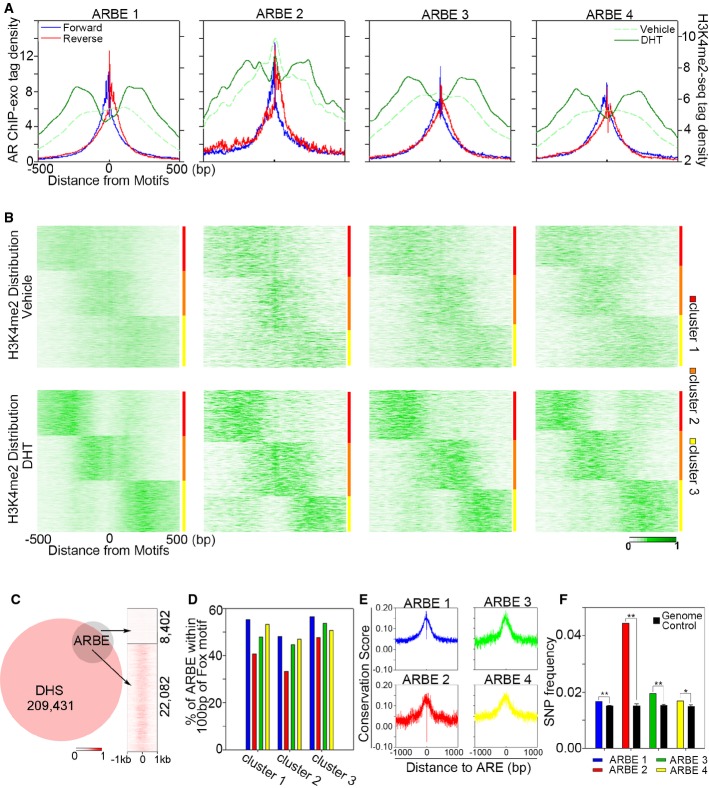
Aggregated sequencing tag distribution of AR ChIP-exo and H3K4me2 MNase ChIP-seq around the four precisely defined ARBEs. ChIP-exo density plot is shown as forward (blue) and reverse (red) strands, respectively. H3K4me2 signal is shown in green. The window indicates ± 500 bp regions from the ARBE motif (0).
Partitional clustering of the 4 types of ARBE locations based on dynamic signal shifting of H3K4me2 affected by DHT treatment.
Venn diagram of DHS sites and ARBEs. Right panel shows DNase-seq tag distribution around ARBEs within ± 1 kb.
Profile of all clusters of each type of ARBE associated with FOXA1 motifs.
Conservation profile of the four types of ARBEs calculated by phyloP.
SNP frequency comparison between each type of ARBE and whole-genome control. **P < 1E-8, *P < 1E-5.
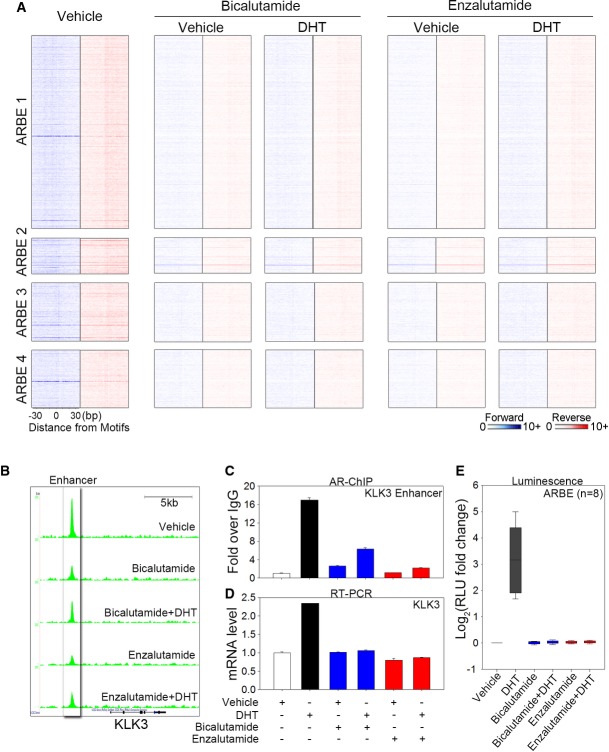
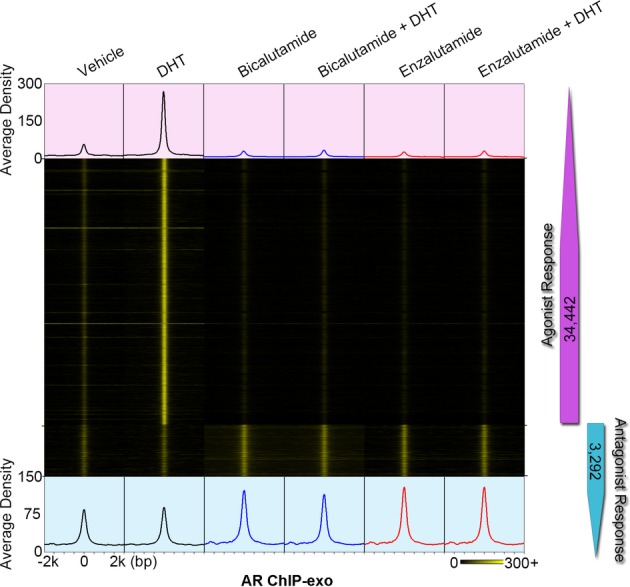
Heat map showing raw tags distribution over the four types of agonist-responsive ARBEs in LNCaP cells treated with vehicle, bicalutamide (10 μM), bicalutamide plus DHT (10 nM), enzalutamide (10 μM), or enzalutamide plus DHT (10 nM). The order of sequences in each type of ARBE is the same as the order of sequences shown in Fig2A.
UCSC genome browser views of sequencing data at KLK3 locus under different conditions.
Regular ChIP analysis of AR on KLK3 enhancer. LNCaP cells were treated with or without agonist and antagonist for 4 h. The data are presented as the fold enrichment over IgG (mean ± SD,n = 3).
Quantitative RT-PCR was performed to assess KLK3 mRNA levels under agonist or antagonist treatments. The data are the mean of triplicates ± SD.
Eight agonist-responsive ARBE reporter constructs used in Fig3B were transiently transfected into LNCaP cells. Cells were stimulated with vehicle, DHT (100 nM), bicalutamide (10 μM), bicalutamide plus DHT, enzalutamide (10 μM), or enzalutamide plus DHT for 16–24 h, and luciferase activities were measured. The results are presented as the mean ± SD of the quadruplicate transfections.
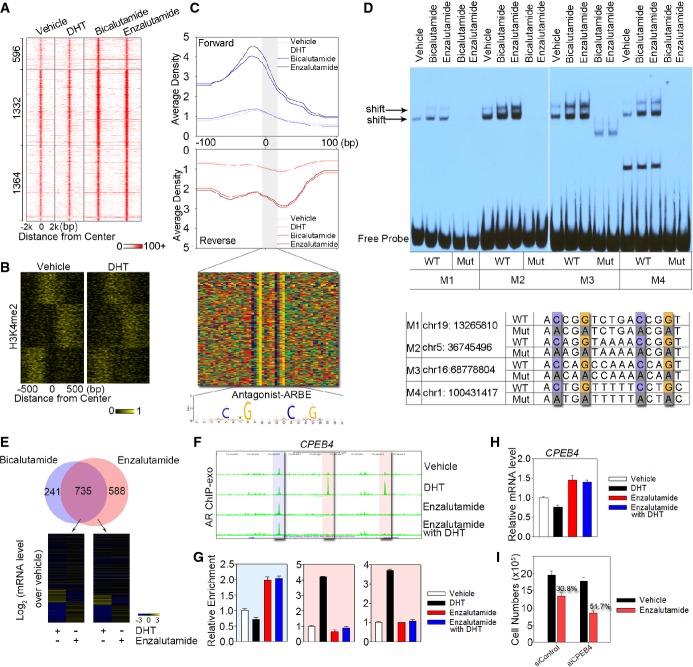
Heat map showing the signal intensity of AR binding in LNCaP cells treated with DHT, bicalutamide, and enzalutamide, respectively. Numbers indicate the antagonist-responsive AR locations in each category.
Clustering of the antagonist-responsive AR locations based on dynamic signal shifting of H3K4me2 affected by DHT treatment.
The aggregated tag density is shown on the forward (blue) and reverse (red) strands, separately. The bottom panel represents the bound motif sequences found in the antagonist-responsive AR locations. Antagonist-liganded ARBE is also shown.
EMSA was performed to validate specific AR binding to antagonist-liganded ARBEs. Biotin-labeled wild-type (WT) or mutated (Mut) probes were incubated with same amounts of nuclear extract from LNCaP cells treated with bicalutamide or enzalutamide. Arrow indicates the position of the shifted specific probe. Four probes (M1–M4) were randomly selected. Quantification of EMSA gel bands shows that antagonists increase the in vitro binding to 1.7–3.8-fold compared to the vehicle.
Top panel represents overlap between genes within 20 kb of the bicalutamide-responsive AR locations and enzalutamide-responsive AR locations. Bottom panel indicates microarray analysis of genes around enzalutamide-responsive AR locations following treatment with DHT or enzalutamide in LNCaP cells.
UCSC genome browser views of sequencing data at CPEB4 locus under different conditions. The blue region represents antagonist-responsive AR location, while the two pink regions indicate agonist-responsive AR locations.
AR ChIP-exo library validation on antagonist-responsive and agonist-responsive AR locations referred to (F). The data are the mean of triplicates ± SD.
mRNA levels of CPEB4 were examined in cells treated with or without DHT and enzalutamide. The data are the mean of triplicates ± SD.
Silencing of CPEB4 enhanced the inhibitory effects of enzalutamide in LNCaP cells. LNCaP cells were transfected with a control siRNA or siCPEB4. Cells were then treated with vehicle or 1 μM enzalutamide, and cell numbers were determined on day 3 with a direct viable cell count assay. The data are the mean of triplicates ± SD.
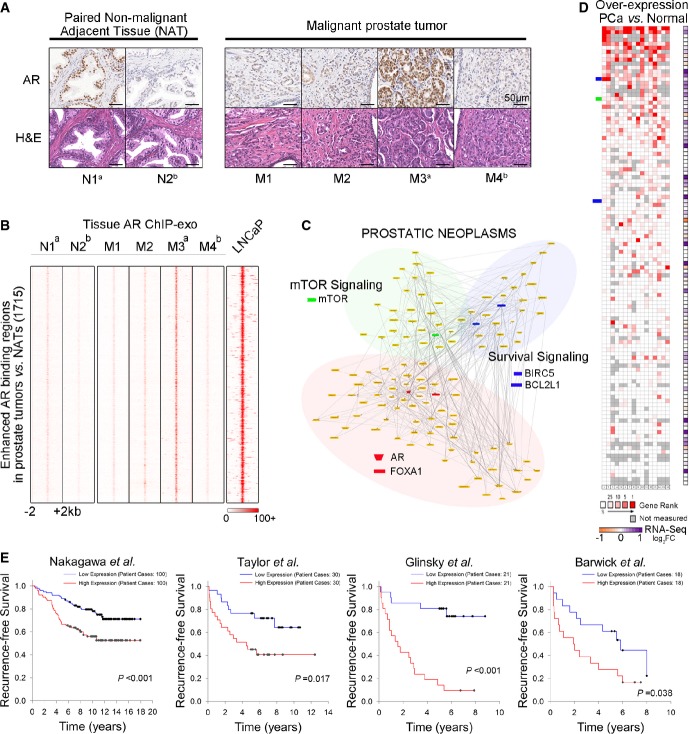
Immunohistochemical (IHC) detection of AR in four malignant prostate tumors and two paired NATs. Representative microphotographs of H&E staining showed normal prostatic gland (NATs) and poorly differentiated adenocarcinoma cells. IHC analysis indicated heterogeneous AR expression among patients. Magnification, 40×. N1a and M3a were collected from the same patient ((Supplementary Table S5). N2b and M4b were gathered from another patient ((Supplementary Table S5).
Tissue AR ChIP-exo raw signal intensity showing 1,715 enhanced AR binding locations in malignant prostate tumors (M) compared to NATs (N). ChIP-exo data of LNCaP (+DHT) is plotted around the same locations.
Pathways and networks constructed using genes within 50 kb of AR binding locations enhanced in prostate tumors. Nodes and corresponding pathways are extracted according to interaction annotation. Literature-based network is configured as PROSTATIC NEOPLASMS (Genomatix Mining).
Oncomine analysis showing median rank for genes in the PROSTATIC NEOPLASMS network across 16 analyses of overexpression in prostate cancer (PCa) versus normal. The right column represents fold change in gene expression detected by RNA-seq in the LNCaP cell line after DHT treatment (Log2 FC DHT/Vehicle, P < 0.01).
Survival curves were generated based on Kaplan–Meier analysis. For each of the four clinical datasets, up to one-third of genes in the PROSTATIC NEOPLASMS network was selected based on gene expression level. These genes were then used to stratify patients. The P-values were calculated by log-rank test.
References
Publication types
MeSH terms
Substances
Grants and funding
LinkOut - more resources
Full Text Sources
Other Literature Sources
Medical
Molecular Biology Databases
Research Materials
