

Modulation of TNF-α mRNA stability by human antigen R and miR181s in sepsis-induced immunoparalysis
- PMID: 25535255
- PMCID: PMC4328645
- DOI: 10.15252/emmm.201404797
Modulation of TNF-α mRNA stability by human antigen R and miR181s in sepsis-induced immunoparalysis
Abstract
Immunoparalysis is an important pathological mechanism in sepsis. However, an effective small molecule therapy is lacking. Here, we show that ouabain, a Na(+),K(+)-ATPase ligand, can reverse immunoparalysis in vitro, in vivo, and in clinical samples. Notably, the effect of ouabain was critically dependent on TNF-α expression. However, ouabain had opposing effects on the stability of TNF-α mRNA: Ouabain triggered miR-181 transcription, which promoted TNF-α mRNA degradation and induced immunoparalysis, and ouabain triggered the nuclear export of human antigen R (HuR), which stabilized TNF-α mRNA and suppressed immuno-paralysis. Interestingly, because the miR-181 binding site is located within the HuR binding site in the 3'-untranslated region of TNF-α, in ouabain-treated cells, HuR competed with miR-181 for binding to TNF-α mRNA and recruited TNF-α mRNA to stress granules, thereby stabilizing TNF-α mRNA and reversing immunoparalysis. Ouabain also induced GM-CSF and interferon-γ expression in a HuR-dependent manner. Hence, the fine-tuning of TNF-α mRNA stability by HuR and miR181 plays a crucial role in immunoparalysis, and Na(+),K(+)-ATPase ligands are promising agents for immunoparalysis therapy.
Keywords: human antigen R; immunoparalysis; microRNA181; ouabain; tumor necrosis factor α.
© 2014 The Authors. Published under the terms of the CC BY 4.0 license.
Figures
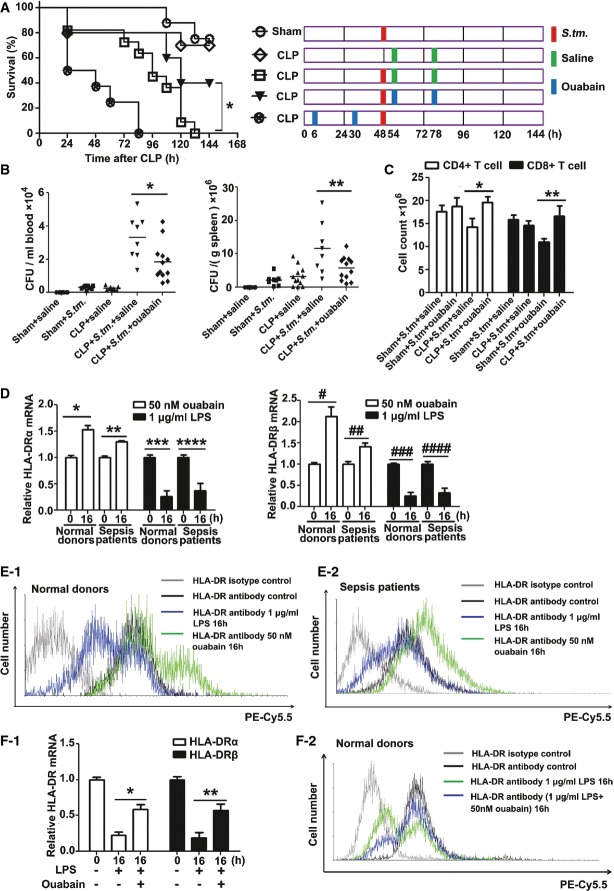
Effect of ouabain on the mortality of animals in “two-hit” sepsis model. Groups of mice were subjected to moderate CLP (punctured once about 20% mortality within 48 h), followed 2 days later by infection with S.tm. (2 × 10³ CFU, i.p.). CLP alone without S.tm. infection served as a control. After S.tm. infection, mice received saline or ouabain (0.1 mg/kg, i.p.) at 54 and 78 h, and the drug scheme was shown on the right in which a red box indicates infection with S.tm., green box indicates injection with saline, and blue box indicates injection with ouabain. Sham-operated mice infected with S.tm. (sham + S.tm.) were used as a control. Mice were also injected with ouabain (0.1 mg/kg, i.p.) at 6 h and 24 h after CLP, but before S.tm. infection. Survival after CLP and S.tm. infection of ouabain-treated versus untreated mice was compared (*P < 0.05) (log-rank test). Data shown are from one experiment (n = 8–12 mice per group), representative of a total of three independent experiments.
Bacterial loads in the blood (left panel) and spleen (right panel) of mice were measured at 48 h after infection with S.tm., as described in the method section. Data shown are from one experiment (n = 6–12 mice per group), representative of a total of three independent experiments. *P = 0.001, **P = 0.0038 (one-way ANOVA).
Ouabain suppressed the decreases in splenic CD4+ and CD8+ T cells in “two-hit” sepsis model. Splenic CD4+ and CD8+ T cells were calculated at 48 h after infection with S.tm., as described in the Materials and Methods section. Data shown are the mean ± SD from two independent experiments (n = 8–12 mice total per condition). *P = 0.0028, **P = 0.0014 (one-way ANOVA).
Effects of ouabain and LPS on HLA-DR α (left panel) and β (right panel) mRNA expression in human monocytes. Data shown are the mean ± SD from two independent experiments (n = 10 samples total per condition). *P = 0.0004, **P = 0.0002, ***P = 0.0004, ****P = 0.0017, #P = 0.0009, ##P = 0.0035, ###P = 0.0002, ####P = 0.0009 (Student's t-test).
Flow cytometric analysis of effects of ouabain and LPS on HLA-DR surface expression in monocytes from normal donors (E-1) and sepsis patients (E-2). The experiments were performed in triplicate.
Ouabain reversed LPS-induced suppression of HLA-DR mRNA (F-1) and protein (F-2) expressions in monocytes from normal donors. Data shown are the mean ± SD from three independent experiments. *P = 0.0001, **P = 0.0017 (one-way ANOVA).
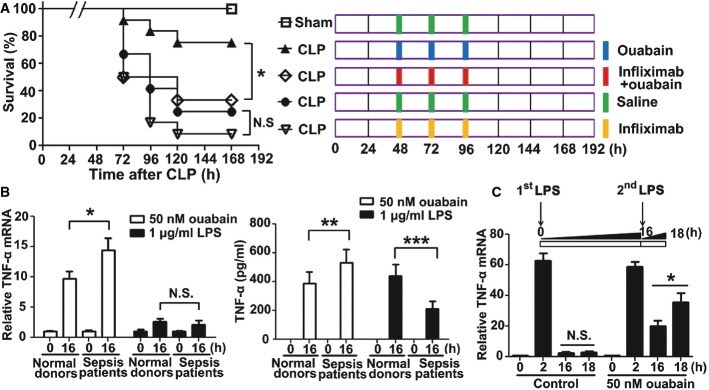
Animal survival by ouabain treatment in the CLP sepsis model was blocked by infliximab (300 μg/kg, i.p.). The mortality of mice after CLP 48 h was controlled at 30–40% (punctured twice). Data shown are from one experiment (n = 20 mice per group, except n = 6 for sham), representative of a total of three independent experiments. *P < 0.05 (0.0384) (log-rank test); N.S., not statistically significant.
Effect of ouabain on TNF-α mRNA (left panel) and protein (right panel) expressions in monocytes from sepsis patients and normal donors. Data shown are the mean ± SD from two independent experiments (n = 10 samples total per condition). *P = 0.0002, **P = 0.0059, ***P = 0.0001 (two-way ANOVA). N.S., not statistically significant.
Ouabain reversed LPS-induced endotoxin tolerance. Monocytes from five healthy volunteer blood were pre-treated with 1 μg/ml LPS only or 1 μg/ml LPS plus 50 nM ouabain for 16 h and then re-stimulated with 1 μg/ml LPS for 2 h. TNF-α mRNA levels were determined by Q-PCR. Data are expressed as mean ± SD from three independent experiments. *P = 0.0014 (one-way ANOVA); N.S., not statistically significant.
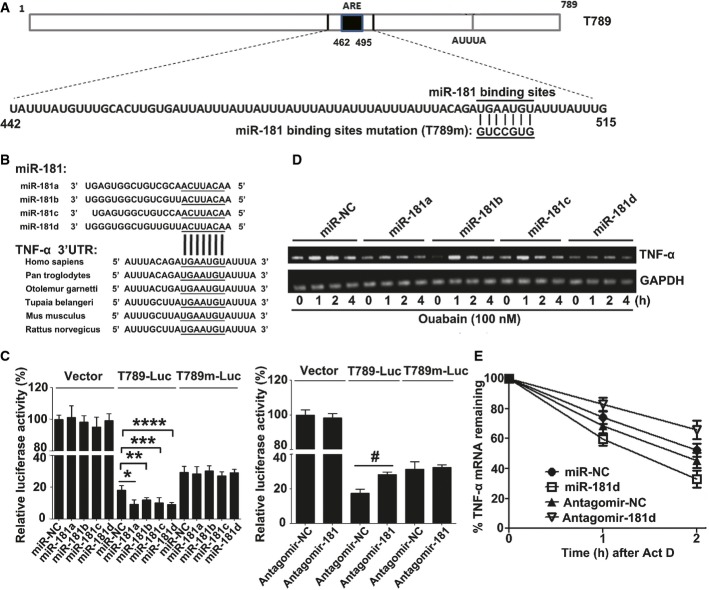
Human TNF-α 3′-UTR elements and potential miR-181s binding sites.
Conserved miR-181s binding sites in the 3′-UTR of TNF-α mRNA across species.
Luciferase activity in A549 cells transfected with constructs encoding vector T789-Luc or T789 m-Luc of TNF-α 3′-UTR plus mimics of miR-181a, miR-181b, miR-181c, miR-181d (left panel), or antagomir-181 (right panel). Data are expressed as mean ± SD from three independent experiments. *P = 0.0172, **P = 0.0258, ***P = 0.0319, ****P = 0.0069, #P = 0.0022 (Student's t-test).
miR-181s suppressed ouabain-induced TNF-α gene transcription. A549 cells were transfected with miR-181s mimics or miR-NC at a final concentration of 50 nM. Twenty-four hours later, these cells were stimulated with ouabain (100 nM) for the indicated time. The TNF-α mRNAs were measured by RT–PCR and normalized to the expression of GAPDH mRNA in each sample. Data shown are representative of three independent experiments having similar results.
Effects of miR-181d and antagomir-181d on the half-life of TNF-α mRNA. A549 cells were transfected with 50 nM miR-181d mimics or 200 nM antagomir-181. Twenty-four hours later, these cells were stimulated with ouabain (100 nM) for 1 h, the culture medium was changed, and then, 5 μg/ml ActD was used to treat these cells for 1 or 2 h. The TNF-α mRNAs were measured by Q-PCR and normalized by GAPDH mRNA. Data are obtained from three independent experiments.
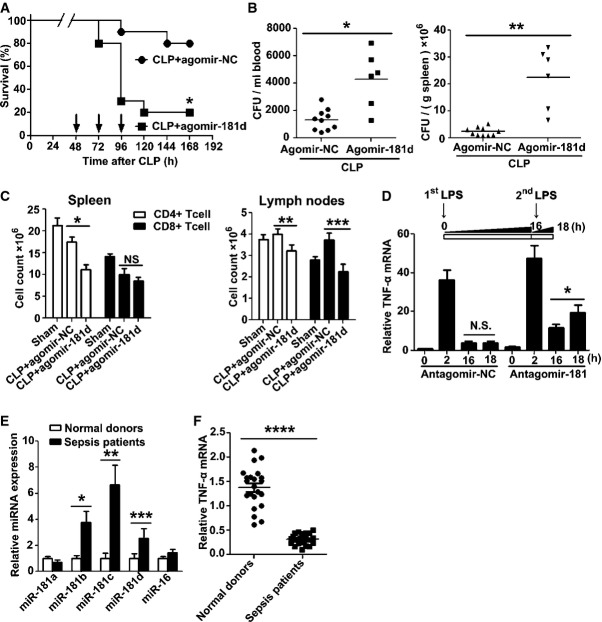
Groups of mice were subjected to CLP, followed 2 days later by injection with agomir-181d or agomir-NC via tail vein at the dose of 10 nmol per mouse once a day for three consecutive days. The mortality of mice after CLP 48 h was controlled at 20% (punctured once). Data shown are from one experiment (n = 20 mice per group), representative of a total of three independent experiments. *P = 0.0042 (log-rank test).
Bacterial loads in the blood (left panel) and spleen (right panel) of CLP mice after injection with agomir-181d or agomir-NC via tail vein for 2 days. Data shown are from one experiment (n = 6–10 mice per group), representative of a total of three independent experiments. *P = 0.001, **P = 0.00003 (Student's t-test).
After injection with agomir-181d or agomir-NC via tail vein for 2 days, the count of CD4+ or CD8+ T cells in the spleen (left panel) and lymph nodes (right panel) of CLP mice was analyzed by flow cytometry, as described in the method section. Sham-operated mice group was used as a control. Data are expressed as mean ± SD, n = 6–10 mice per group and are representative of three experiments. *P = 0.0001, **P = 0.0012, ***P = 0.00004 (one-way ANOVA). N.S., not statistically significant.
Antagomir-181 reversed LPS-induced endotoxin tolerance. Monocytes from 5 healthy volunteers were isolated, pre-treated with 800 pmol antagomir-181 or matched antagomir control for 24 h, further treated with 1 μg/ml LPS for 16 h, and then re-stimulated with 1 μg/ml LPS for 2 h. TNF-α mRNA levels were determined by Q-PCR. Data are expressed as mean ± SD from two independent experiments. *P = 0.0143 (one-way ANOVA); N.S., not statistically significant.
Inverse correlation between the expressions of miR-181s (E) and TNF-α mRNA (F) in monocytes from sepsis patients. Monocytes of 25 patients with severe sepsis and 22 healthy blood donors were isolated by adherence to plastic substrates. The culture plates were incubated for 2 h in a humidified 37°C, 5% CO2 incubator. After incubation, the media containing non-adherent cells were removed by aspiration. Total RNA of the adherent cells was extracted using RNeasy kit (Invitrogen, USA). miR-181s and TNF-α mRNA levels were determined by Q-PCR. Data are expressed as mean ± SD. *P = 0.0054, **P = 0.0034, ***P = 0.0309, ****P = 0.00000 (Student's t-test).
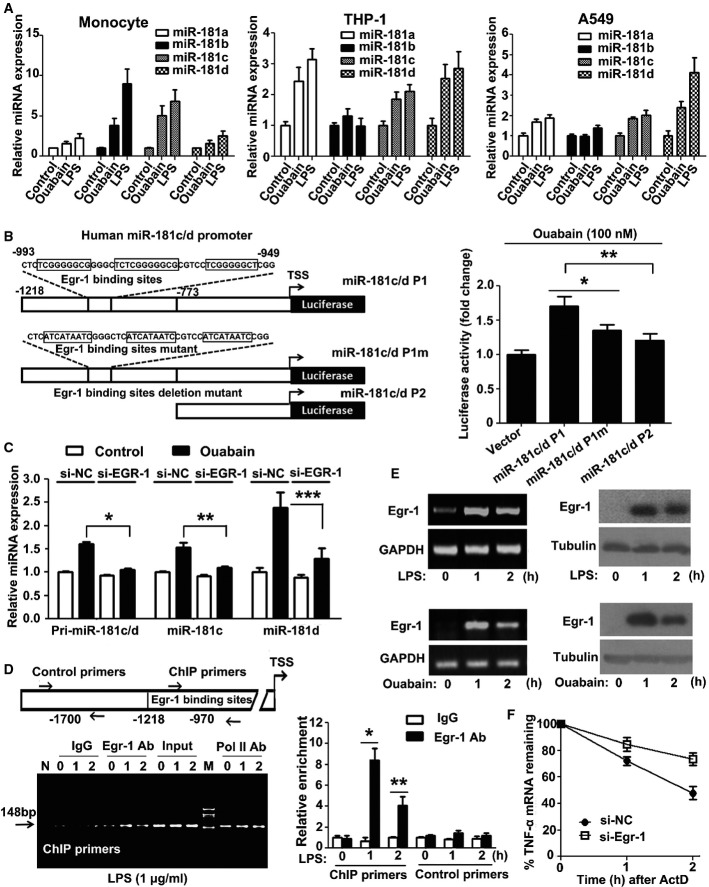
Ouabain and LPS induced miR-181s expression in human blood monocytes (left panel), THP-1 cells (middle panel), and A549 cells (right panel). Data are obtained from three independent experiments and expressed as mean ± SD.
Construction of firefly luciferase reporter plasmid harboring miR-181c/d promoter and its mutants (left panel). The luciferase activity (firefly/Renilla) of cells transfected with miR-181c/d promoter or its mutant (right panel). A549 cells were transiently transfected with 1 μg firefly luciferase plasmids and 50 ng pRL-TK and then treated with 100 nM ouabain for an additional 8 h. The luciferase activity (firefly/Renilla) of each transfection group is indicated. The luciferase activity of vector was arbitrarily set at 1.0. Data represent the mean ± SD from three independent experiments. *P = 0.0005, **P = 0.00005 (one-way ANOVA).
The expression levels of pri-miR-181c/d, miR-181c, and miR-181d after Egr-1 siRNA transfection. A549 cells were transfected with EGR1 siRNA or control siRNA. Twenty-four hours later, these cells were stimulated with 100 nM ouabain for 2 h. Q-PCR analysis was performed to measure the expression levels of pri-miR-181c/d, miR-181c, and miR-181d. Data represent the mean ± SD from three independent experiments. *P = 0.0002, **P = 0.0006, ***P = 0.0113 (two-way ANOVA).
ChIP assay of the binding of Egr-1 to the miR-181c/d promoter. THP1 cells were stimulated for the indicated time with 1 μg/ml LPS and assessed with ChIP primer and the control primer for the promoter. Q-PCR result is shown (right panel). Lane M, DNA size markers (in bp). Lane N, distilled water was used as PCR template. Data represent the mean ± SD from three independent experiments. *P = 0.0003, **P = 0.0033 (Student's t-test).
LPS (upper panel) and ouabain (below panel) time-dependently stimulated Egr-1 mRNA and protein expression in THP1 cells. The experiments were performed in triplicate.
Silencing of Egr-1 suppressed TNF-α degradation. A549 cells were transfected with EGR1 siRNA or control siRNA. Twenty-four hours later, these cells were stimulated with 1 μg/ml LPS for 1 h, the culture medium was changed, and then 5 μg/ml ActD was used to treat these cells for 1 or 2 h. The TNF-α mRNAs were measured by Q-PCR. GAPDH was included as a control. Data represent the mean ± SD from three independent experiments.
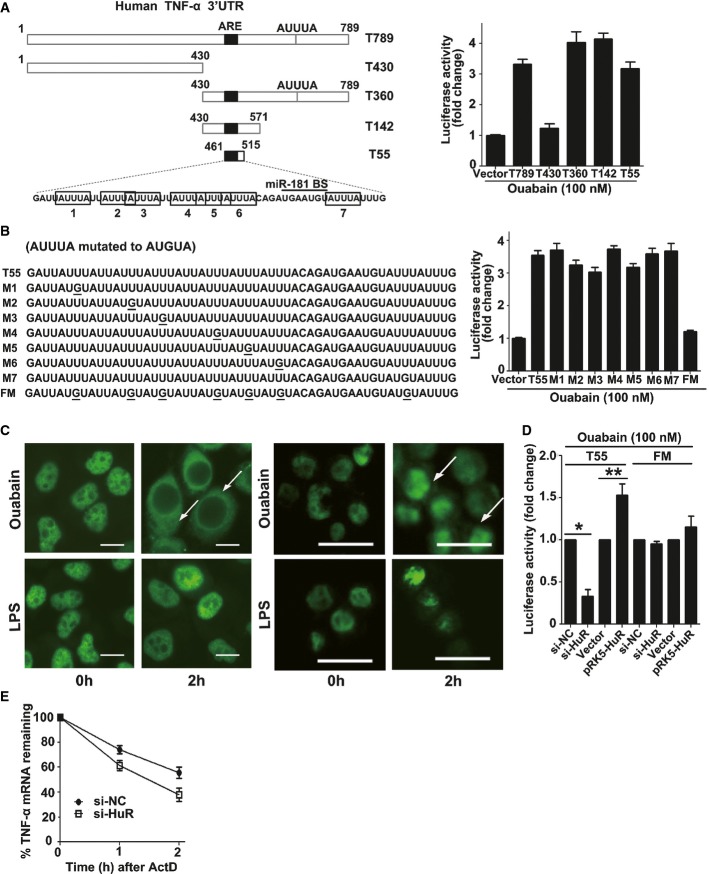
Schematic depiction of TNF-α 3′-UTR and its mutants (left panel). Identification of the minimal cis-element in TNF-α 3′-UTR that is responsive to ouabain treatment (A). Effect of ouabain on the luciferase activity of T55 and its mutants (B). A549 cells were transfected with T789 or its mutants. After 24 h, cells were stimulated with 100 nM ouabain for 12 h. The luciferase activity of vector control was arbitrarily set at 1.0. Data represent the mean ± SD from three independent experiments.
Effects of ouabain and LPS on HuR translocation in A549 cells (left image) or in THP-1 cells (right image). Representative fluorescent images of three independent experiments showing similar results are shown. Scale bars: 10 μm.
Effect of HuR on the luciferase activity of T55 reporter under the condition of ouabain treatment. A549 cells were co-transfected with 50 nM HuR siRNA (or control siRNA), 1 μg T55 (or FM) firefly luciferase reporter plasmid, and 50 ng pRL-TK. Twenty-four hours later, cells were treated with ouabain at 100 nM for an additional 12 h. For HuR overexpression experiments, A549 cells were transfected with 0.5 μg vector or pRK5-HuR plasmid for 12 h and then co-transfected with 0.5 μg T55 or FM firefly luciferase reporter plasmid and 50 ng pRL-TK. After transfection, cells were treated with ouabain at 100 nM for an additional 12 h. The luciferase activity of matched control was arbitrarily set at 1.0. Data represent the mean ± SD from three independent experiments. *P = 0.0001, **P = 0.0027 (Student's t-test).
Effect of HuR silencing on the decay of TNF-α mRNA. A549 cells were transfected with HuR siRNA or control siRNA. Twenty-four hours later, these cells were stimulated with ouabain (100 nM) for 1 h, the culture medium was changed, and then 5 μg/ml Act D was used to treat these cells for 1 or 2 h. The TNF-α mRNAs were measured by Q-PCR. GAPDH was included as a control. Data represent the mean ± SD of three experiments.
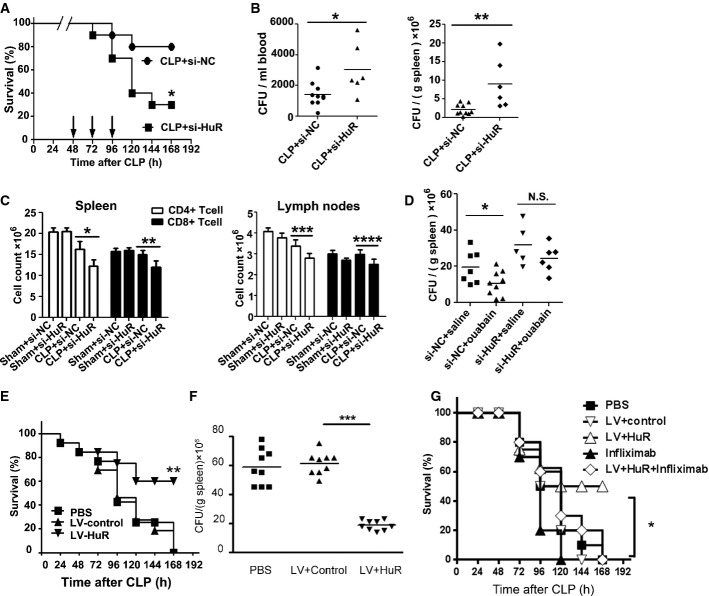
Groups of mice were subjected to CLP, followed 2 days later by injection with cholesterol-modified HuR siRNA or control siRNA via tail vein at the dose of 10 nmol per mouse. The mortality of mice after CLP 48 h was controlled at 20% (punctured once). Data shown are from one experiment (n = 20 mice per group), representative of a total of three independent experiments. *P < 0.05 (log-rank test).
Bacterial loads in the blood (left panel) and spleen (right panel) of CLP mice after injection with agomir-181d or agomir-NC via tail vein for 2 days. Data are mean ± SD, n = 6–10 mice per group and are representative of three experiments. *P = 0.0203, **P = 0.0061 (Student's t-test).
After injection with HuR siRNA or control siRNA via tail vein for 2 days, the count of CD4+ or CD8+ T cells in the spleen (left panel) and lymph nodes (right panel) of CLP mice or sham-operated mice was analyzed by flow cytometry. Data are expressed as mean ± SD, n = 6–10 mice per group, and are representative of three experiments. *P = 0.0006, **P = 0.0005, ***P = 0.0017, ****P = 0.002 (one-way ANOVA).
Bacterial loads in the spleen of CLP mice. At 2 days after CLP, animals were injected with HuR siRNA (10 nmol/mouse) via tail vein and ouabain (0.1 mg/kg, i.p.) once a day for three consecutive days. Data are obtained from one experiment, representative of a total of three independent experiments. *P = 0.0388 (Student's t-test). N.S., not statistically significant.
Groups of mice were subjected to moderate CLP (punctured once about 10–20% mortality within 48 h), followed 2 days later by infection with S.tm. (2 × 10³ CFU, i.p.). Mice were further challenged with PBS or lentiviruses containing control or HuR expressing plasmid (108 TU per mice) at 54, 78, and 102 h after CLP via tail vein. Survival of CLP mice after injection with lentiviruses containing HuR-overexpressing plasmid versus control plasmid was compared (**P < 0.01, log-rank test). Bacterial loads in the spleen of CLP mice are shown in (F). n = 9 mice per group. ***P < 0.001, N.S., not statistically significant. Data represent the mean ± SD from two independent experiments.
Groups of mice were treated as that in (E) and (F) and further challenged with PBS, lentiviruses containing control, or HuR-expressing plasmid (108 TU per mice) with or without infliximab (300 μg/kg). Survival of CLP mice after injection with lentiviruses containing HuR-overexpressing plasmid versus HuR plus infliximab was compared (*P < 0.001, log-rank test).
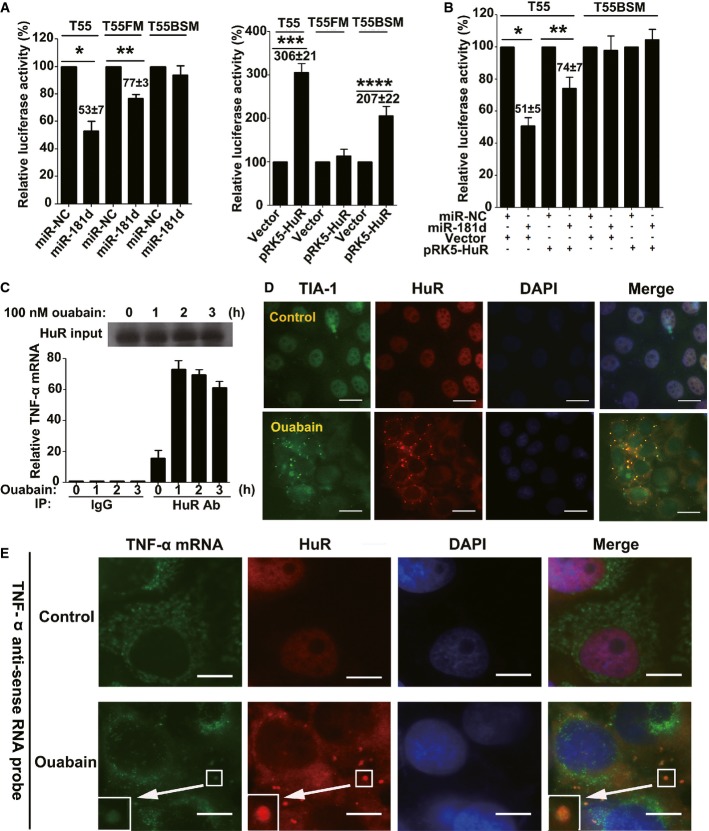
Effects of miR-181d (left panel) and pRK5-HuR (right panel) on the luciferase activity of cells transfected with TNF-α 3′-UTR and its mutants. A549 cells were transfected with the indicated constructs, miR-181d or pRK5-HuR. Data represent the mean ± SD from three independent experiments. *P = 0.0004, **P = 0.0002, ***P = 0.00007, ****P = 0.001 (Student's t-test).
HuR and miR-181d are mutually antagonistic for TNF-α mRNA stabilization. A549 cells were transfected with the indicated constructs, miR-181d or pRK5-HuR. Data represent the mean ± SD from three independent experiments. *P = 0.00008, **P = 0.0031 (Student's t-test).
Ouabain increased the association of cytoplasmic HuR with TNF-α mRNA. Q-PCR assay of TNF-α mRNA immunoprecipitated by HuR antibody or immunoglobulin G (IgG) from lysates of A549 cells treated with ouabain at a concentration of 100 nM for the indicated time. Top, immunoblot analysis of HuR protein input in A549 cell lysates. Data represent the mean ± SD from three independent experiments.
Immunofluorescence analysis of the SGs in A549 cells after ouabain treatment. A549 cells were challenged with ouabain (100 nM) for 6 h. SGs were visualized by counterstaining for TIA-1 (green) and HuR (red). DAPI was used for staining nuclei. Merged views are shown in the right panels. Representative fluorescent images of three independent experiments showing similar results are shown. Scale bars: 20 μm.
Ouabain recruited TNF-α mRNA to SGs. After treated or untreated with ouabain (100 nM) for 12 h, A549 cells were fixed, permeabilized, and then incubated with 3 nM of an Alexa Fluor 488-labeled antisense RNA probe to detect TNF-α mRNA. SGs were visualized by counterstaining for HuR, as indicated in red. DAPI was used for staining nuclei. Merged views are shown in the right panels. Scale bars: 10 μm. Shown are typical results from five different fields and three different experiments.
References
-
- Berendes E, Cullen P, Van Aken H, Zidek W, Erren M, Hubschen M, Weber T, Wirtz S, Tepel M, Walter M. Endogenous glycosides in critically ill patients. Crit Care Med. 2003;31:1331–1337. - PubMed
-
- Biswas SK, Lopez-Collazo E. Endotoxin tolerance: new mechanisms, molecules and clinical significance. Trends Immunol. 2009;30:475–487. - PubMed
-
- Carter Y, Liu G, Yang J, Fier A, Mendez C. Sublethal hemorrhage induces tolerance in animals exposed to cecal ligation and puncture by altering p38, p44/42, and SAPK/JNK MAP kinase activation. Surg Infect. 2003;4:17–27. - PubMed
-
- Chen GH, Reddy RC, Newstead MW, Tateda K, Kyasapura BL, Standiford TJ. Intrapulmonary TNF gene therapy reverses sepsis-induced suppression of lung antibacterial host defense. J Immunol. 2000;165:6496–6503. - PubMed
Publication types
MeSH terms
Substances
LinkOut - more resources
Full Text Sources
Other Literature Sources
Medical
Miscellaneous
