. 2015 Feb;56(2):379-89.
doi: 10.1194/jlr.M055228. Epub 2014 Dec 22.

Adult-onset deficiency of acyl CoA:monoacylglycerol acyltransferase 2 protects mice from diet-induced obesity and glucose intolerance

Affiliations

Adult-onset deficiency of acyl CoA:monoacylglycerol acyltransferase 2 protects mice from diet-induced obesity and glucose intolerance

Taylor Banh et al. J Lipid Res. 2015 Feb.

Abstract

Acyl-CoA:monoacylglycerol acyltransferase (MGAT) 2 catalyzes triacylglycerol (TAG) synthesis, required in intestinal fat absorption. We previously demonstrated that mice without a functional MGAT2-coding gene (Mogat2(-/-)) exhibit increased energy expenditure and resistance to obesity induced by excess calories. One critical question raised is whether lacking MGAT2 during early development is required for the metabolic phenotypes in adult mice. In this study, we found that Mogat2(-/-) pups grew slower than wild-type littermates during the suckling period. To determine whether inactivating MGAT2 in adult mice is sufficient to confer resistance to diet-induced obesity, we generated mice with an inducible Mogat2-inactivating mutation. Mice with adult-onset MGAT2 deficiency (Mogat2(AKO)) exhibited a transient decrease in food intake like Mogat2(-/-) mice when fed a high-fat diet and a moderate increase in energy expenditure after acclimatization. They gained less weight than littermate controls, but the difference was smaller than that between wild-type and Mogat2(-/-) mice. The moderate reduction in weight gain was associated with reduced hepatic TAG and improved glucose tolerance. Similar protective effects were also observed in mice that had gained weight on a high-fat diet before inactivating MGAT2. These findings suggest that adult-onset MGAT2 deficiency mitigates metabolic disorders induced by high-fat feeding and that MGAT2 modulates early postnatal nutrition and may program metabolism later in life.

Keywords: coenzyme A; dietary fat; energy expenditure; fat absorption; metabolic programming; monoacylglycerol acyltransferase 2; triacylglycerol.


Figures

Fig. 1.
Fig. 1.
MGAT2 expression and body mass of fetuses as well as growth curves of mice. A: Mogat2 expression in tissues of wild-type mouse fetus collected on embryonic day 19 (E19). * P < 0.05 versus all other tissues by Dunnett’s test. nd, not detected. B: Body weight of wild-type (WT), Mogat2+/− (M2+/−), and Mogat2−/− (M2−/−) fetuses on day E19. n = 412 per group. Bars represent mean ± SEM. ns, no significant difference. C: Daily body weight of pups during the suckling period. Weekly body weight of mice consuming chow (D) or 3-month-old mice consuming 60 kcal% fat diet (E). n = 1227 mice per group. Error bars represent SEM and are not shown when smaller than the symbols. # P < 0.05 versus littermate controls by repeated-measures ANOVA.
Fig. 2.
Fig. 2.
Generation of the tamoxifen-inducible Mogat2-deficient mouse. Efficiency and specificity to tamoxifen-mediated deletion of Mogat2 were confirmed by measuring Mogat2 mRNA level (A) and MGAT activity (B) in the jejunum of wild-type (WT, black), Mogat2−/− (M2−/−, white), Mogat2f/f (M2f/f, blue), Mogat2im (M2im, green), tamoxifen-treated Mogat2f/f (M2f/f, gray), and tamoxifen-treated Mogat2im (adult-onset knockout, M2AKO, red) mice. n = 3–14 mice per group. Bars represent mean ± SEM. nd, not detected. * P < 0.05 versus littermate controls by t-test.
Fig. 3.
Fig. 3.
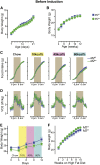
No difference in energy balance before inactivation of MGAT2. Body weight of Mogat2f/f (M2f/f, blue squares) and Mogat2im (M2im, green circles) mice during suckling (A) and chow feeding (B). n = 9–19 mice per group. C–E: Three-month-old mice sequentially fed chow or defined diets containing 10, 45, or 60% calories from fat for 3 days per diet. Cumulative food intake (C) and oxygen consumption rates (D) adjusted for baseline body weights of each mouse at the start of each diet treatment. Data from each mouse were pooled from the same time of the day of the same diet treatment. Graphs represent average days. Gray areas mark dark phase of the light cycle (6 PM to 6 AM). E: Body weight of mice during 12-day metabolic phenotyping experiment. n = 8 per group. F: Body weight of mice during 10 weeks of high-fat feeding. n = 9 or 13.
Fig. 4.
Fig. 4.
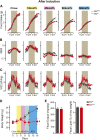
Inactivation of MGAT2 in adulthood alters energy balance upon high-fat feeding. A–C: Four-month-old tamoxifen-treated Mogat2f/f (M2f/f, gray) and tamoxifen-treated adult-onset MGAT2-deficient (M2AKO, red) mice sequentially fed chow or defined diets containing 10, 45, or 60% calories from fat for 3 days per diet. Mice were fed the 60 kcal% diet for an additional 6 days. Cumulative food intake (A), RER (B), and oxygen consumption rates (C) adjusted for baseline body weights of each mouse at the start of each diet treatment. Data from each mouse were pooled from the same time of the day of the same diet treatment. Graphs represent average days. Gray areas mark dark phase of the light cycle (6 PM to 6 AM). D: Body weight of mice during 18-day metabolic phenotyping experiment. n = 7 or 6. E: Fecal output and lipid content of mice after acclimatization to high-fat feeding. Error bars represent SEM. Error bars not shown are smaller than the symbols. * P < 0.05 versus littermate controls by t-test [total cumulative mass for food intake, 24 h average for RER, and area under the curve (AUC) for VO2]. # P < 0.05 versus littermate controls by repeated-measures ANOVA.
Fig. 5.
Fig. 5.
Inactivation of MGAT2 partially protects weight gain induced by high-fat feeding. A: Body weight of post-tamoxifen-treated mice during 10 weeks of high-fat feeding. n = 16 or 18. # P < 0.05 versus littermate controls by repeated-measures ANOVA. B: Tissue mass of mice following 10 weeks of high-fat feeding. n = 11 or 12. * P < 0.05 versus littermate controls.
Fig. 6.
Fig. 6.
Inactivation of MGAT2 protects against hepatic steatosis and impaired glucose metabolism. Plasma TAG (A), plasma free fatty acids (B), plasma cholesterol (C), liver mass (D), hepatic TAG (E), and hepatic glycogen (F) in tamoxifen-treated Mogat2f/f (M2f/f, black) and adult-onset MGAT2-deficient (M2AKO, red) mice fed 60 kcal% fat diet for 10 weeks. n = 6 or 9. Bars represent mean ± SEM. Blood glucose (G) and plasma insulin (H) in 8-week high-fat fed mice before and at indicated times after an intraperitoneal injection of glucose (1 mg/g body weight, 10% glucose in PBS). n = 9 or 11 per group. * P < 0.05 versus littermate controls by t-test (mean for plasma cholesterol, liver mass and TAG, and AUC for blood glucose). ◆ P < 0.05 versus time-matched littermate controls by t-test.
Fig. 7.
Fig. 7.
Inactivation of MGAT2 in diet-induced obese mice attenuates further weight gain and improves glucose tolerance. A: Body weight of mice during high-fat feeding before and after inactivation of MGAT2. n = 5 mice per group. GTT1, GTT2, and GTT3 indicate time of glucose tolerance tests. # P < 0.05 by repeated-measures ANOVA after tamoxifen treatment, respectively. * P < 0.05 versus littermate controls by Bonferroni test. B: Tissue mass of mice following 10 weeks of post-tamoxifen treatment high-fat feeding. * P < 0.05 versus littermate controls. C: Blood glucose before and at indicated times after an intragastric challenge of glucose (200 μl of 10% glucose) in high-fat fed mice before (left panel), 3 weeks after (middle panel), and 10 weeks after (right panel) inactivation of MGAT2. Inset: net AUC. n = 8–10 mice per group. * P < 0.05 versus littermate controls by t-test. Color scheme for all panels: Mogat2f/f (M2f/f, blue), Mogat2im (M2im, green), tamoxifen-treated Mogat2f/f (M2f/f, gray), and tamoxifen-treated Mogat2im (adult-onset knockout, M2AKO, red) mice.

Similar articles

Cited by

References

    1. Coleman R. A., Lee D. P. 2004. Enzymes of triacylglycerol synthesis and their regulation. Prog. Lipid Res. 43: 134–176. - PubMed
    1. Yen C. L., Nelson D. W., Yen M. I. Intestinal triacylglycerol synthesis in fat absorption and systemic energy metabolism. J Lipid Res.Epub ahead of print. September 17, 2014; 10.1194/jlr.R052902. - PMC - PubMed
    1. Yen C. L., Stone S. J., Cases S., Zhou P., Farese R. V., Jr 2002. Identification of a gene encoding MGAT1, a monoacylglycerol acyltransferase. Proc. Natl. Acad. Sci. USA. 99: 8512–8517. - PMC - PubMed
    1. Yen C. L., Farese R. V., Jr 2003. MGAT2, a monoacylglycerol acyltransferase expressed in the small intestine. J. Biol. Chem. 278: 18532–18537. - PubMed
    1. Cao J., Hawkins E., Brozinick J., Liu X., Zhang H., Burn P., Shi Y. 2004. A predominant role of acyl-CoA:monoacylglycerol acyltransferase-2 in dietary fat absorption implicated by tissue distribution, subcellular localization, and up-regulation by high fat diet. J. Biol. Chem. 279: 18878–18886. - PubMed