

Curtailing endothelial TGF-β signaling is sufficient to reduce endothelial-mesenchymal transition and fibrosis in CKD
- PMID: 25535303
- PMCID: PMC4378095
- DOI: 10.1681/ASN.2013101137
Curtailing endothelial TGF-β signaling is sufficient to reduce endothelial-mesenchymal transition and fibrosis in CKD
Abstract
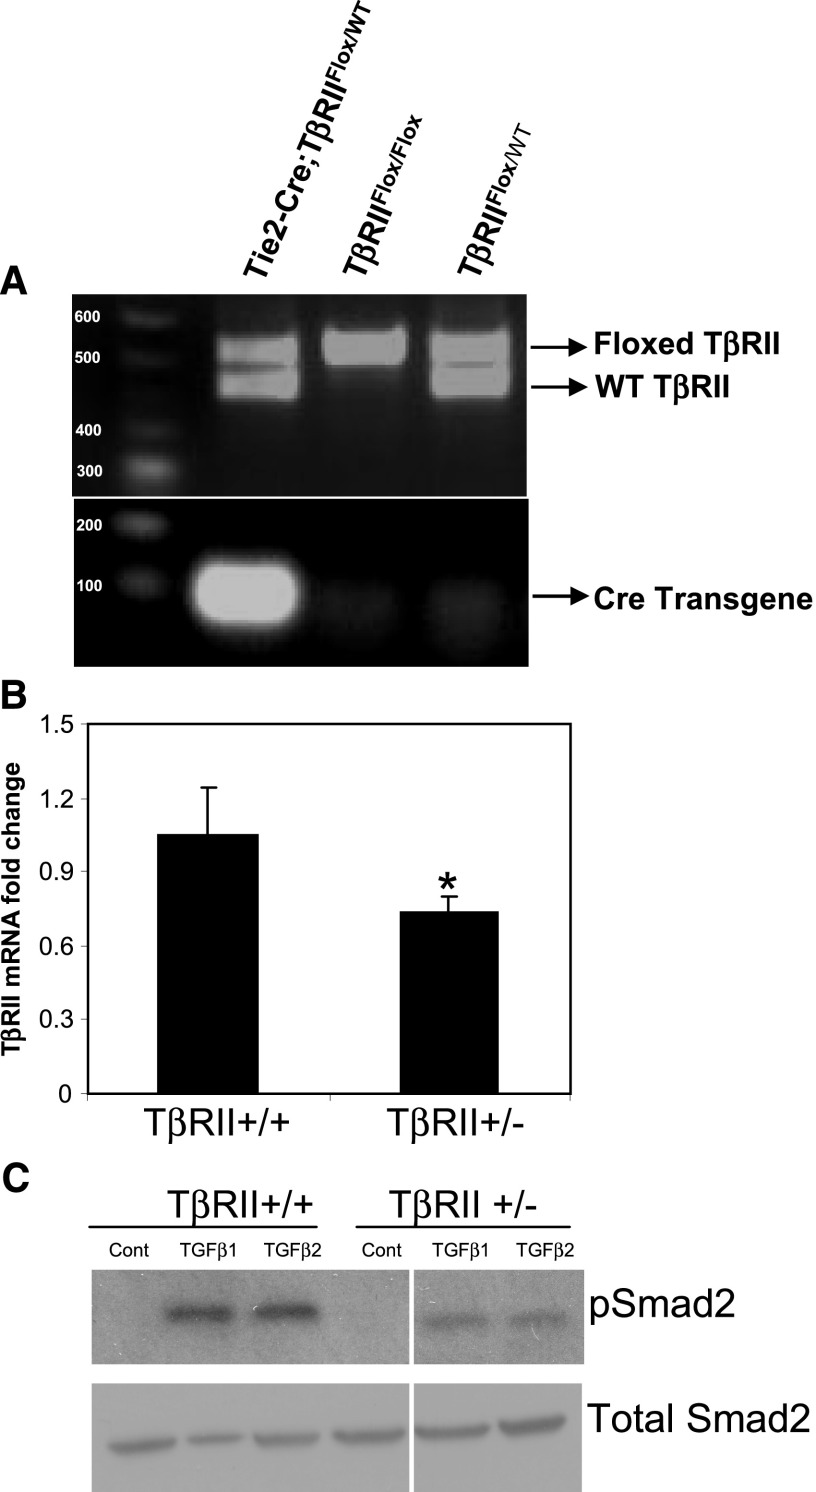
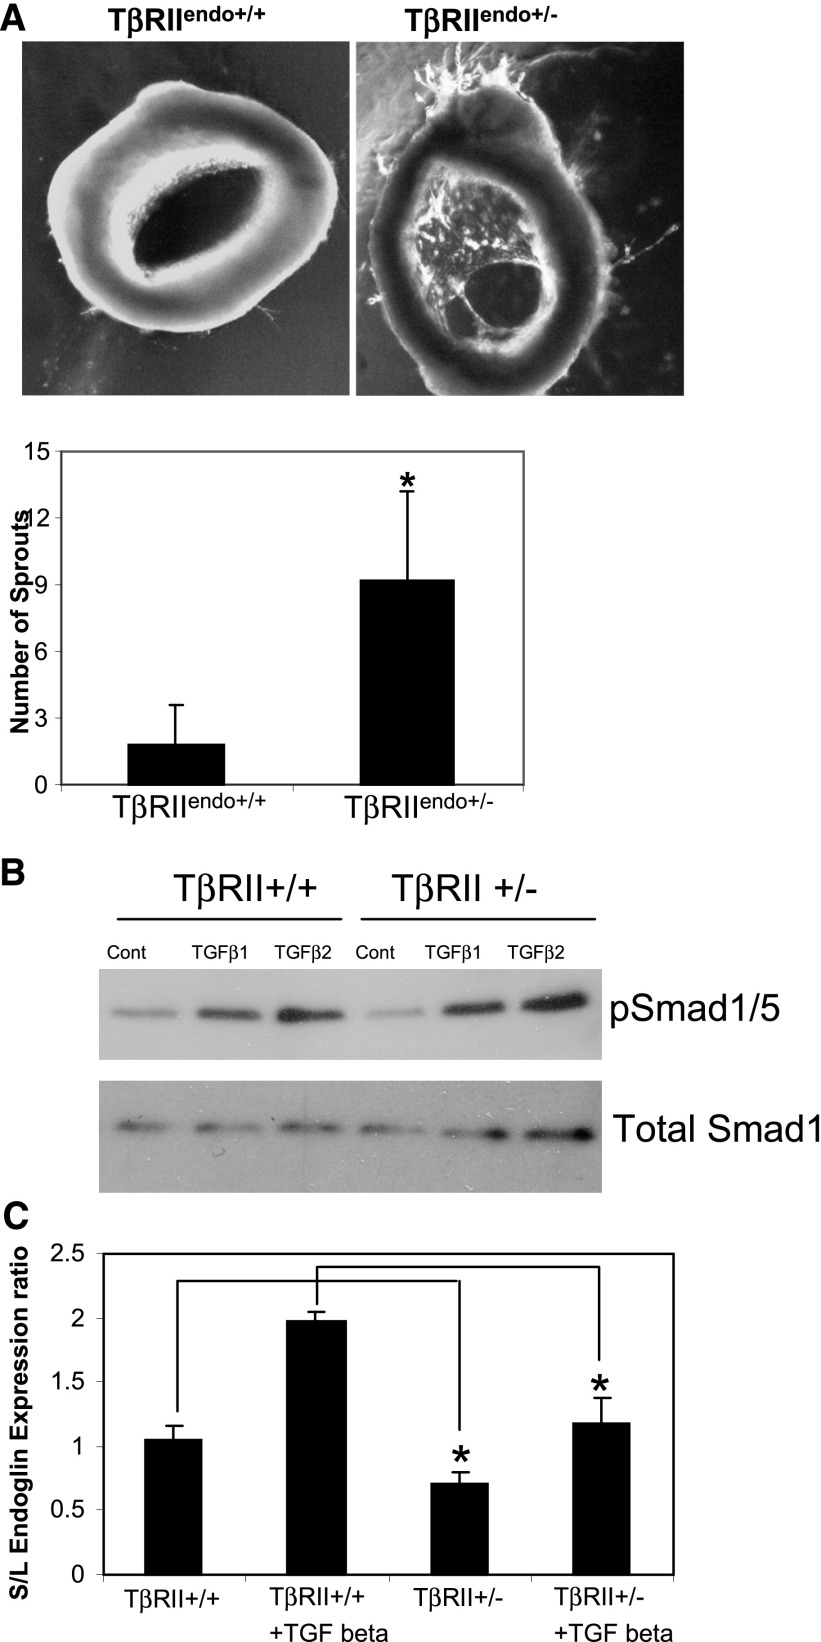
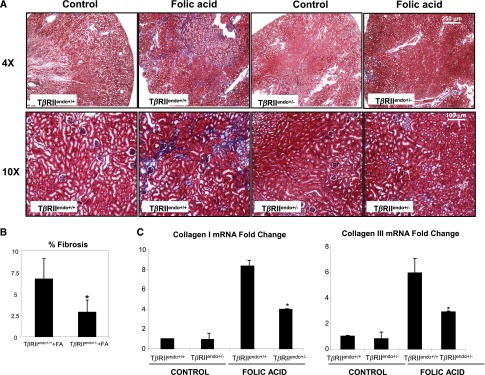
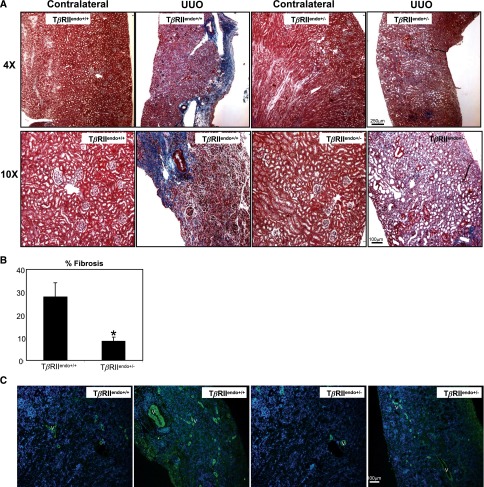
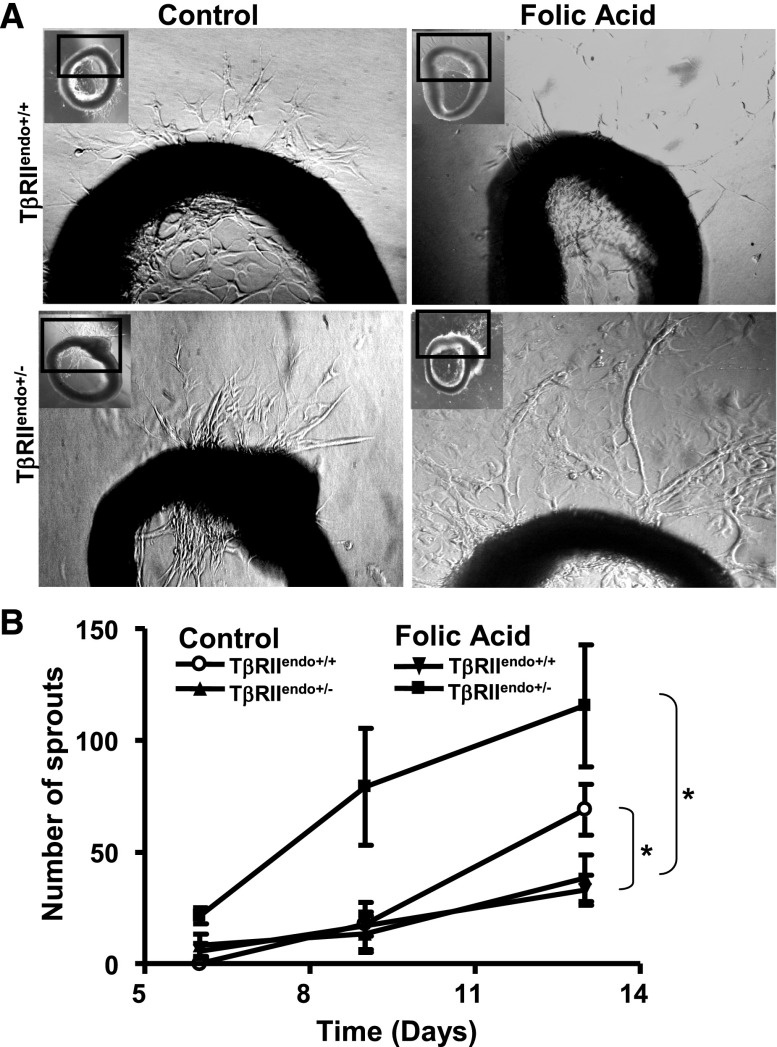
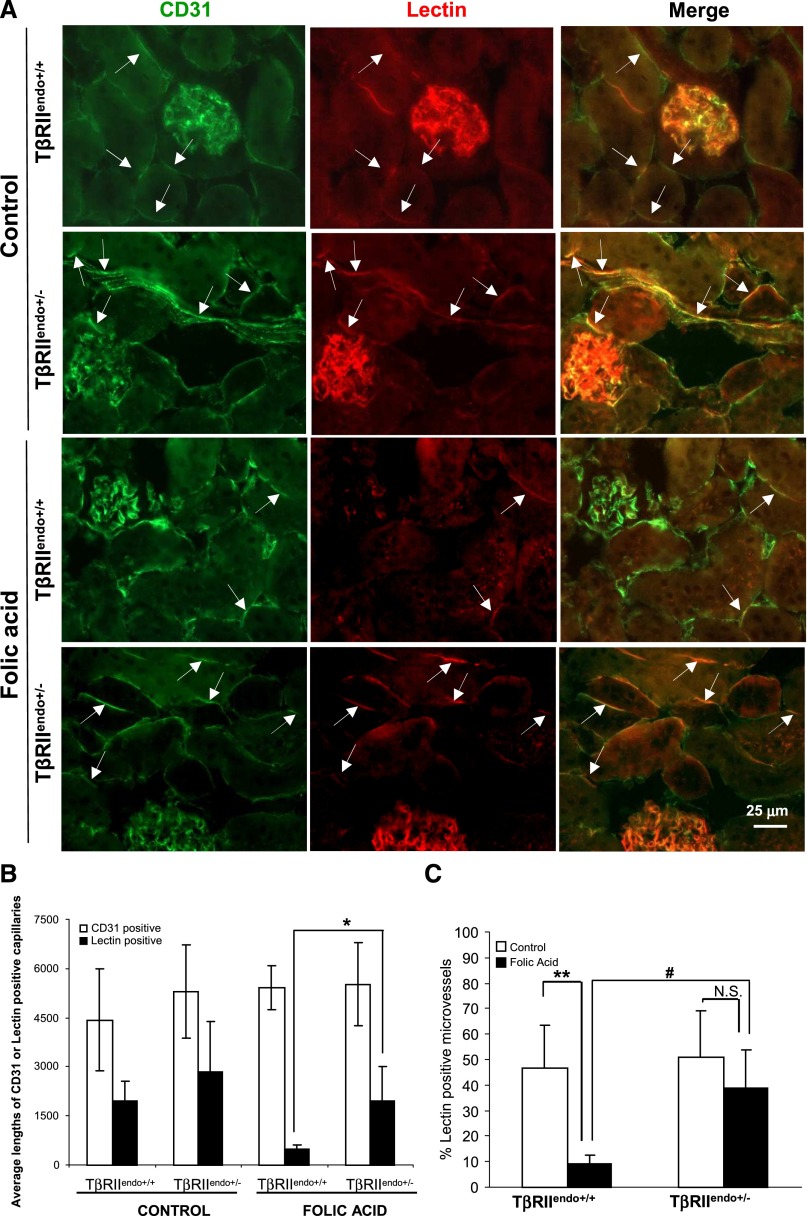
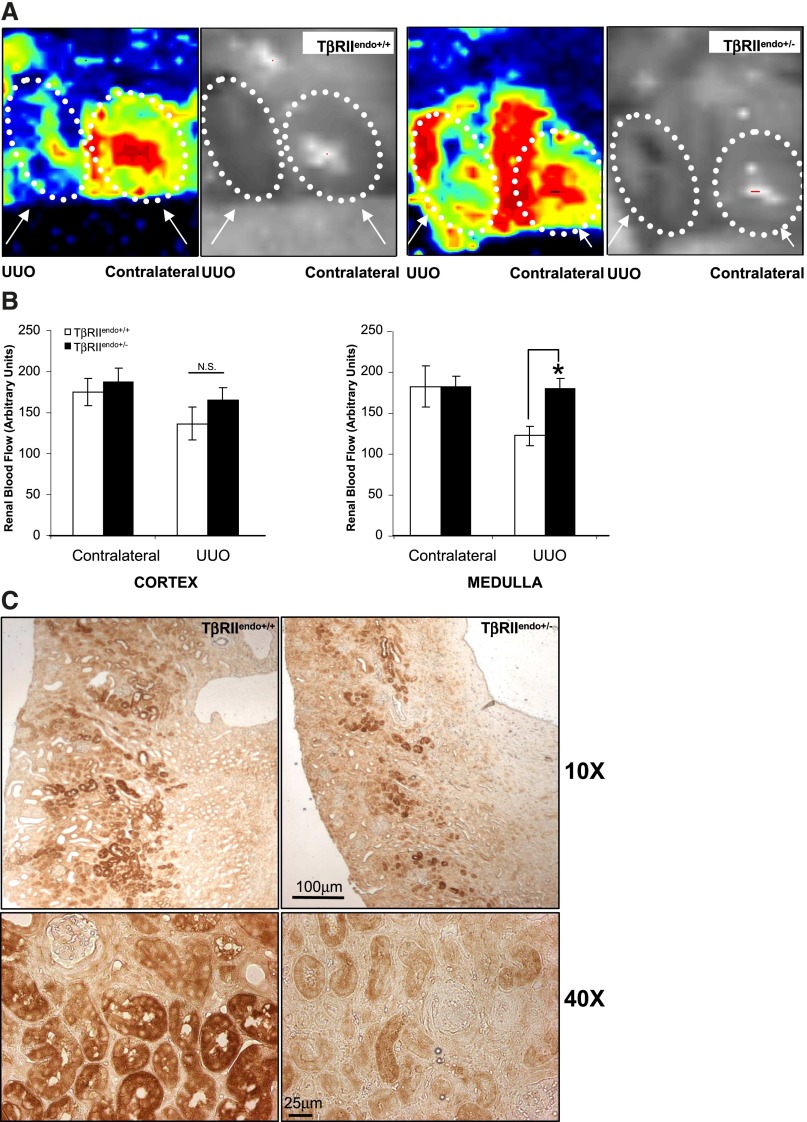
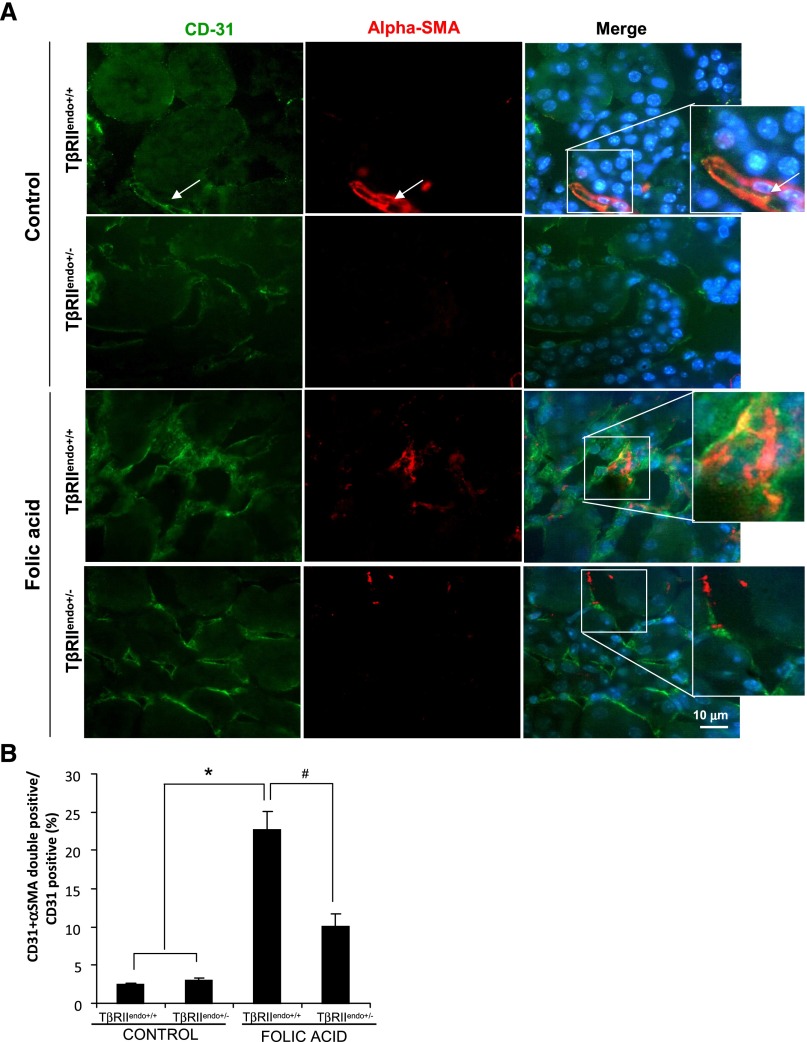
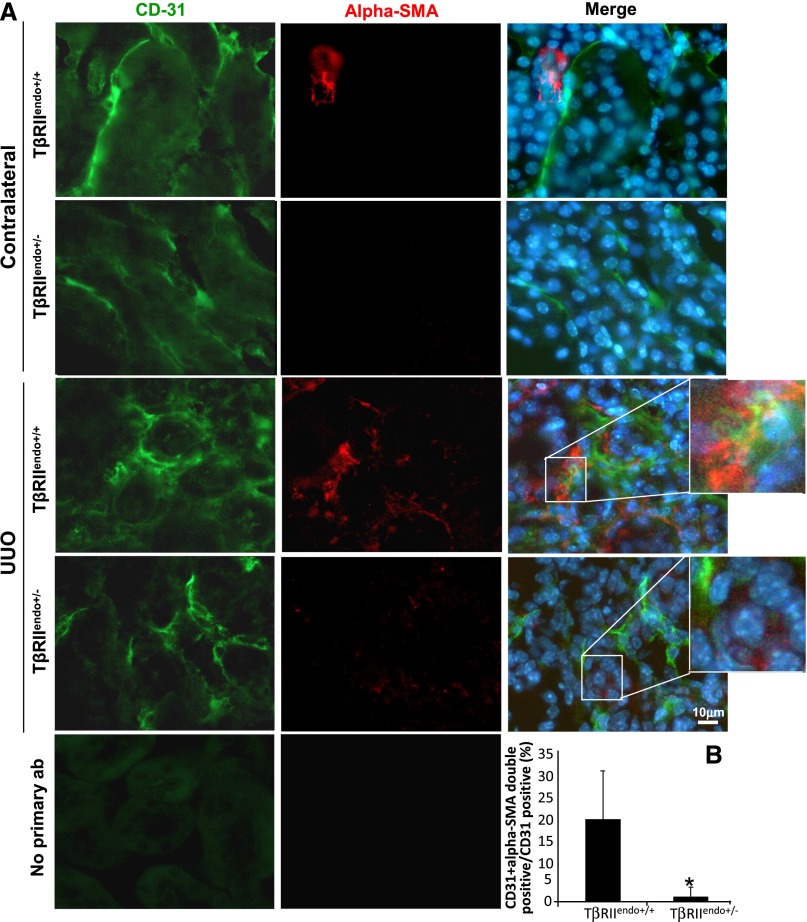
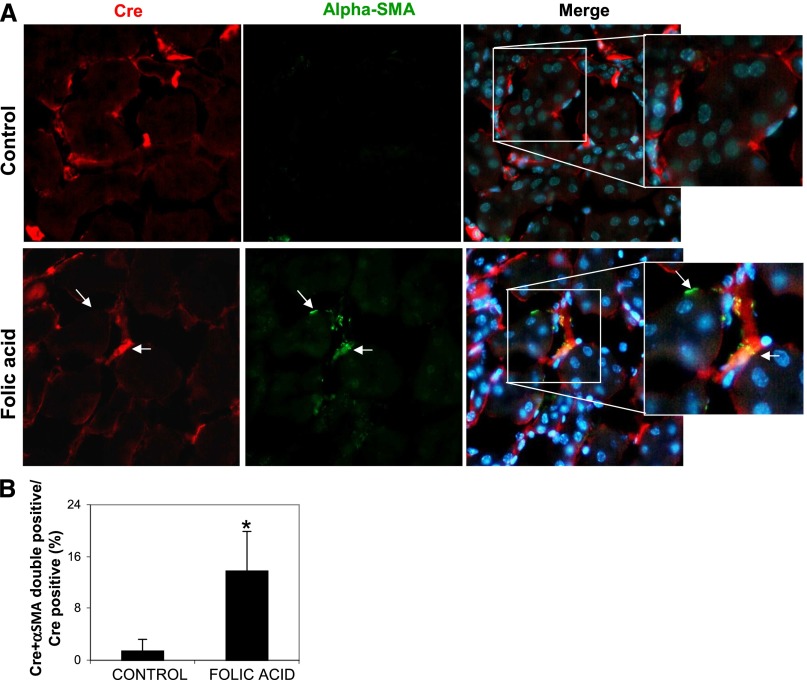
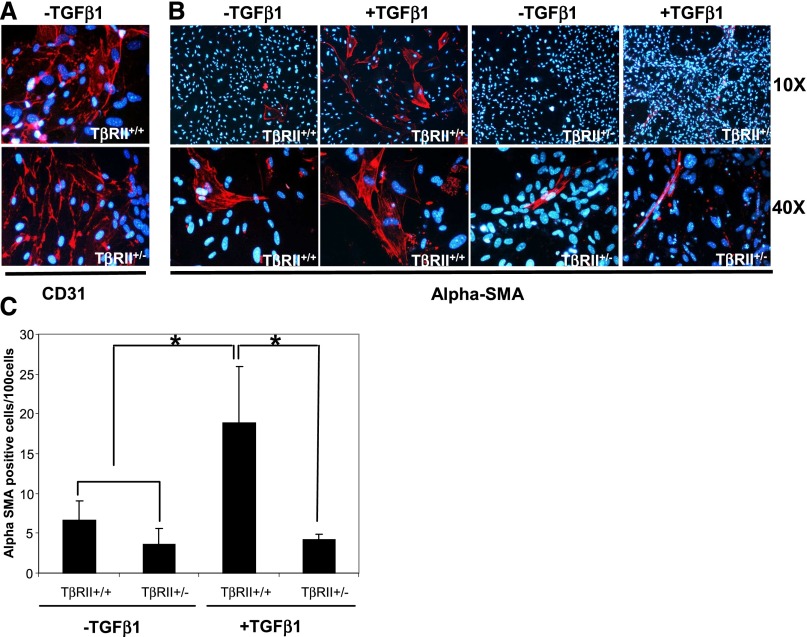
Excessive TGF-β signaling in epithelial cells, pericytes, or fibroblasts has been implicated in CKD. This list has recently been joined by endothelial cells (ECs) undergoing mesenchymal transition. Although several studies focused on the effects of ablating epithelial or fibroblast TGF-β signaling on development of fibrosis, there is a lack of information on ablating TGF-β signaling in the endothelium because this ablation causes embryonic lethality. We generated endothelium-specific heterozygous TGF-β receptor knockout (TβRII(endo+/-)) mice to explore whether curtailed TGF-β signaling significantly modifies nephrosclerosis. These mice developed normally, but showed enhanced angiogenic potential compared with TβRII(endo+/+) mice under basal conditions. After induction of folic acid nephropathy or unilateral ureteral obstruction, TβRII(endo+/-) mice exhibited less tubulointerstitial fibrosis, enhanced preservation of renal microvasculature, improvement in renal blood flow, and less tissue hypoxia than TβRII(endo+/+) counterparts. In addition, partial deletion of TβRII in the endothelium reduced endothelial-to-mesenchymal transition (EndoMT). TGF-β-induced canonical Smad2 signaling was reduced in TβRII(+/-) ECs; however, activin receptor-like kinase 1 (ALK1)-mediated Smad1/5 phosphorylation in TβRII(+/-) ECs remained unaffected. Furthermore, the S-endoglin/L-endoglin mRNA expression ratio was significantly lower in TβRII(+/-) ECs compared with TβRII(+/+) ECs. These observations support the hypothesis that EndoMT contributes to renal fibrosis and curtailing endothelial TGF-β signals favors Smad1/5 proangiogenic programs and dictates increased angiogenic responses. Our data implicate endothelial TGF-β signaling and EndoMT in regulating angiogenic and fibrotic responses to injury.
Keywords: ALK1; Endoglin; Smad1/5; TGF-β receptor type II; microvasculature; renal fibrosis.
Copyright © 2015 by the American Society of Nephrology.
Figures
Comment in
-
Microvascular endothelial cells poised to take center stage in experimental renal fibrosis.J Am Soc Nephrol. 2015 Apr;26(4):767-9. doi: 10.1681/ASN.2014121170. Epub 2014 Dec 22. J Am Soc Nephrol. 2015. PMID: 25535302 Free PMC article. No abstract available.
Similar articles
-
Diverse roles of TGF-β receptor II in renal fibrosis and inflammation in vivo and in vitro.J Pathol. 2012 Jun;227(2):175-88. doi: 10.1002/path.3976. Epub 2012 Feb 22. J Pathol. 2012. PMID: 22190171
-
Integrin-mediated type II TGF-β receptor tyrosine dephosphorylation controls SMAD-dependent profibrotic signaling.J Clin Invest. 2014 Aug;124(8):3295-310. doi: 10.1172/JCI71668. Epub 2014 Jul 1. J Clin Invest. 2014. PMID: 24983314 Free PMC article.
-
HuangQi Decoction Ameliorates Renal Fibrosis via TGF-β/Smad Signaling Pathway In Vivo and In Vitro.Cell Physiol Biochem. 2016;38(5):1761-74. doi: 10.1159/000443115. Epub 2016 May 9. Cell Physiol Biochem. 2016. PMID: 27161221
-
Transforming growth factor-β signalling: role and consequences of Smad linker region phosphorylation.Cell Signal. 2013 Oct;25(10):2017-24. doi: 10.1016/j.cellsig.2013.06.001. Epub 2013 Jun 11. Cell Signal. 2013. PMID: 23770288 Review.
-
TGF-β/BMP proteins as therapeutic targets in renal fibrosis. Where have we arrived after 25 years of trials and tribulations?Pharmacol Ther. 2015 Dec;156:44-58. doi: 10.1016/j.pharmthera.2015.10.003. Epub 2015 Oct 19. Pharmacol Ther. 2015. PMID: 26493350 Review.
Cited by
-
SIRT6 overexpression retards renal interstitial fibrosis through targeting HIPK2 in chronic kidney disease.Front Pharmacol. 2022 Sep 12;13:1007168. doi: 10.3389/fphar.2022.1007168. eCollection 2022. Front Pharmacol. 2022. PMID: 36172184 Free PMC article.
-
Endothelial-to-mesenchymal transition in systemic sclerosis.Clin Exp Immunol. 2021 Jul;205(1):12-27. doi: 10.1111/cei.13599. Epub 2021 Apr 18. Clin Exp Immunol. 2021. PMID: 33772754 Free PMC article. Review.
-
Permissive role of vascular endothelium in fibrosis: focus on the kidney.Am J Physiol Cell Physiol. 2024 Mar 1;326(3):C712-C723. doi: 10.1152/ajpcell.00526.2023. Epub 2024 Jan 15. Am J Physiol Cell Physiol. 2024. PMID: 38223932 Free PMC article. Review.
-
Blocking TGF-β Signaling Pathway Preserves Mitochondrial Proteostasis and Reduces Early Activation of PDGFRβ+ Pericytes in Aristolochic Acid Induced Acute Kidney Injury in Wistar Male Rats.PLoS One. 2016 Jul 5;11(7):e0157288. doi: 10.1371/journal.pone.0157288. eCollection 2016. PLoS One. 2016. PMID: 27379382 Free PMC article.
-
The association between renal accumulation of pancreatic amyloid-forming amylin and renal hypoxia.Front Endocrinol (Lausanne). 2023 Feb 16;14:1104662. doi: 10.3389/fendo.2023.1104662. eCollection 2023. Front Endocrinol (Lausanne). 2023. PMID: 36875454 Free PMC article. Review.
References
-
- Harris RC, Neilson EG: Toward a unified theory of renal progression. Annu Rev Med 57: 365–380, 2006 - PubMed
-
- Böttinger EP, Bitzer M: TGF-beta signaling in renal disease. J Am Soc Nephrol 13: 2600–2610, 2002 - PubMed
-
- Kopp JB, Factor VM, Mozes M, Nagy P, Sanderson N, Böttinger EP, Klotman PE, Thorgeirsson SS: Transgenic mice with increased plasma levels of TGF-beta 1 develop progressive renal disease. Lab Invest 74: 991–1003, 1996 - PubMed
-
- Goumans MJ, Mummery C: Functional analysis of the TGFbeta receptor/Smad pathway through gene ablation in mice. Int J Dev Biol 44: 253–265, 2000 - PubMed
Publication types
MeSH terms
Substances
Grants and funding
LinkOut - more resources
Full Text Sources
Other Literature Sources
Medical
Molecular Biology Databases
