. 2015 Mar;35(5):831-46.
doi: 10.1128/MCB.01109-14. Epub 2014 Dec 22.

Enhanced cardiac Akt/protein kinase B signaling contributes to pathological cardiac hypertrophy in part by impairing mitochondrial function via transcriptional repression of mitochondrion-targeted nuclear genes

Affiliations

Enhanced cardiac Akt/protein kinase B signaling contributes to pathological cardiac hypertrophy in part by impairing mitochondrial function via transcriptional repression of mitochondrion-targeted nuclear genes

Adam R Wende et al. Mol Cell Biol. 2015 Mar.

Abstract

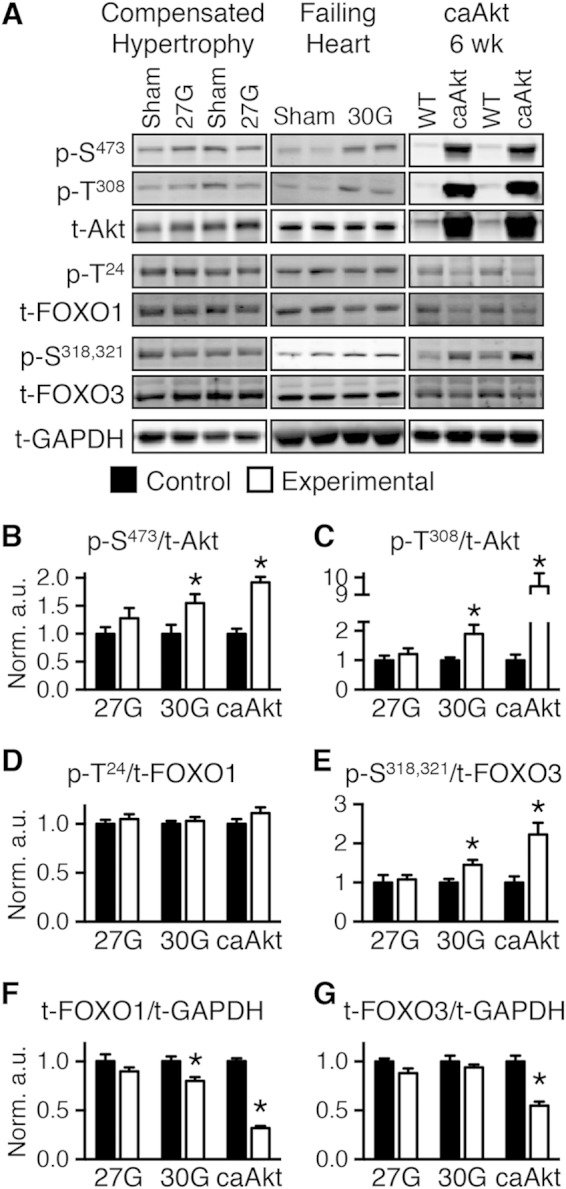
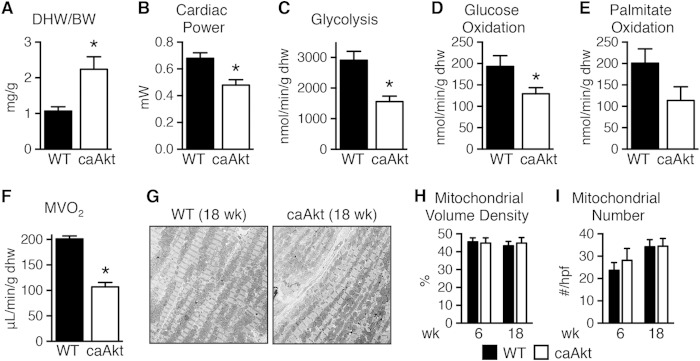
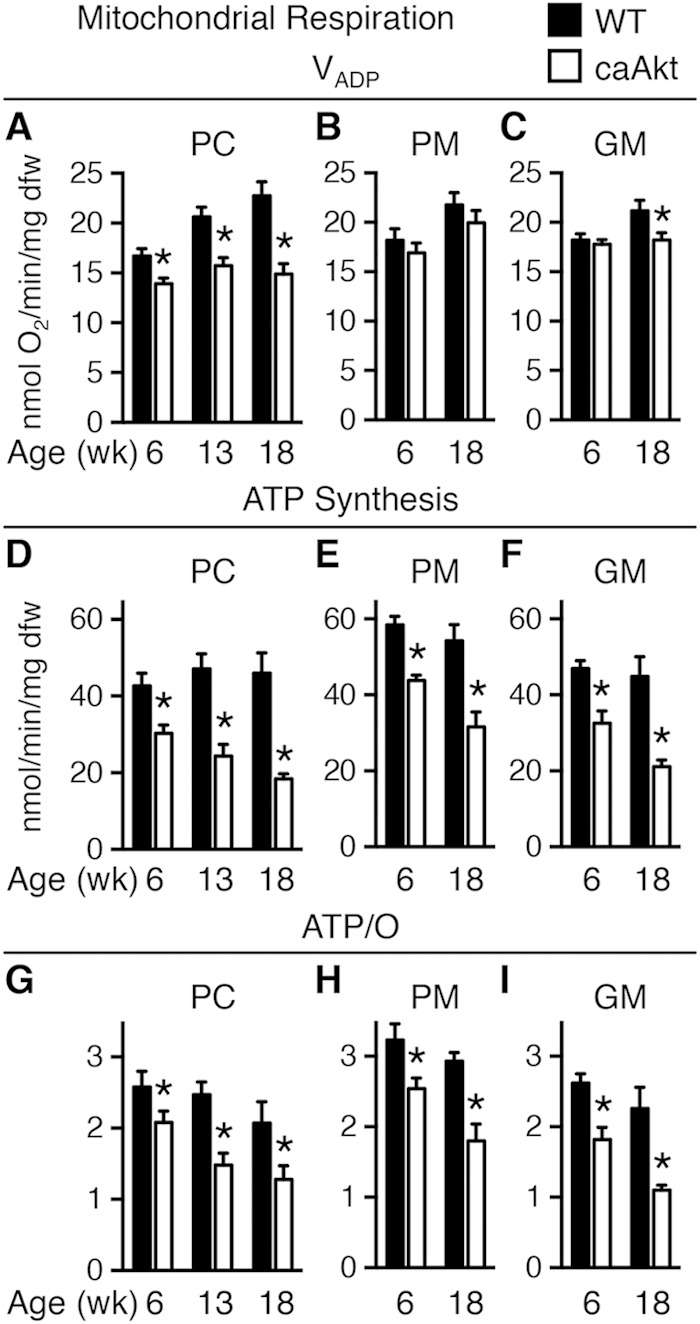
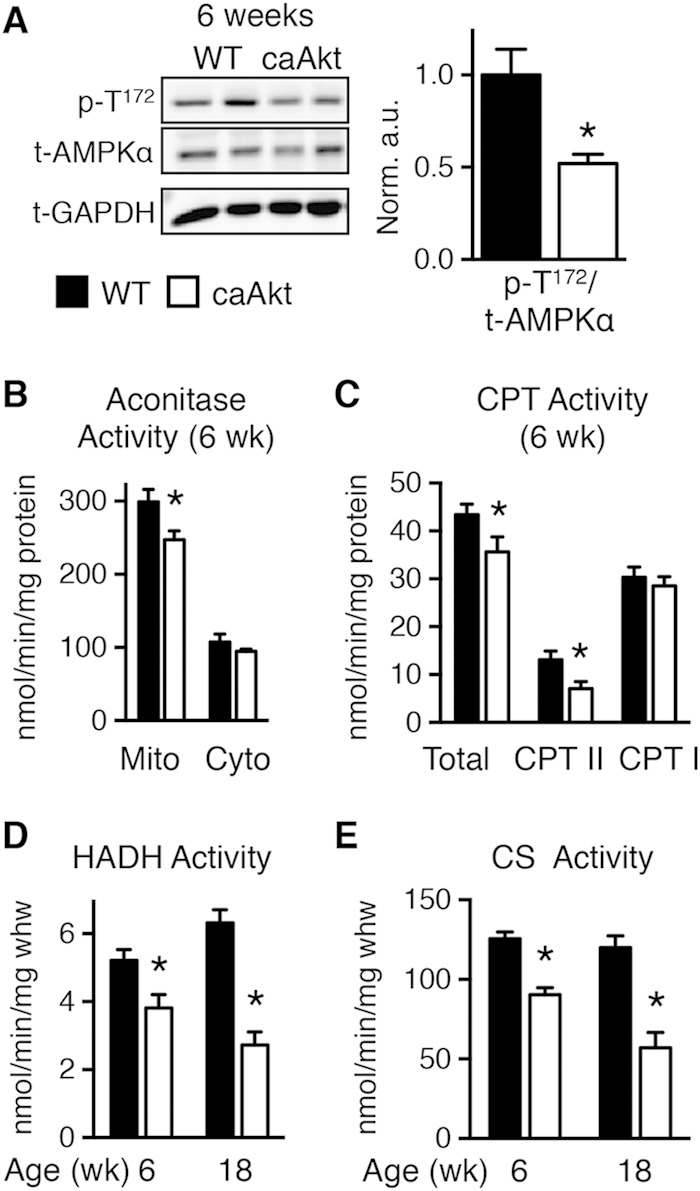
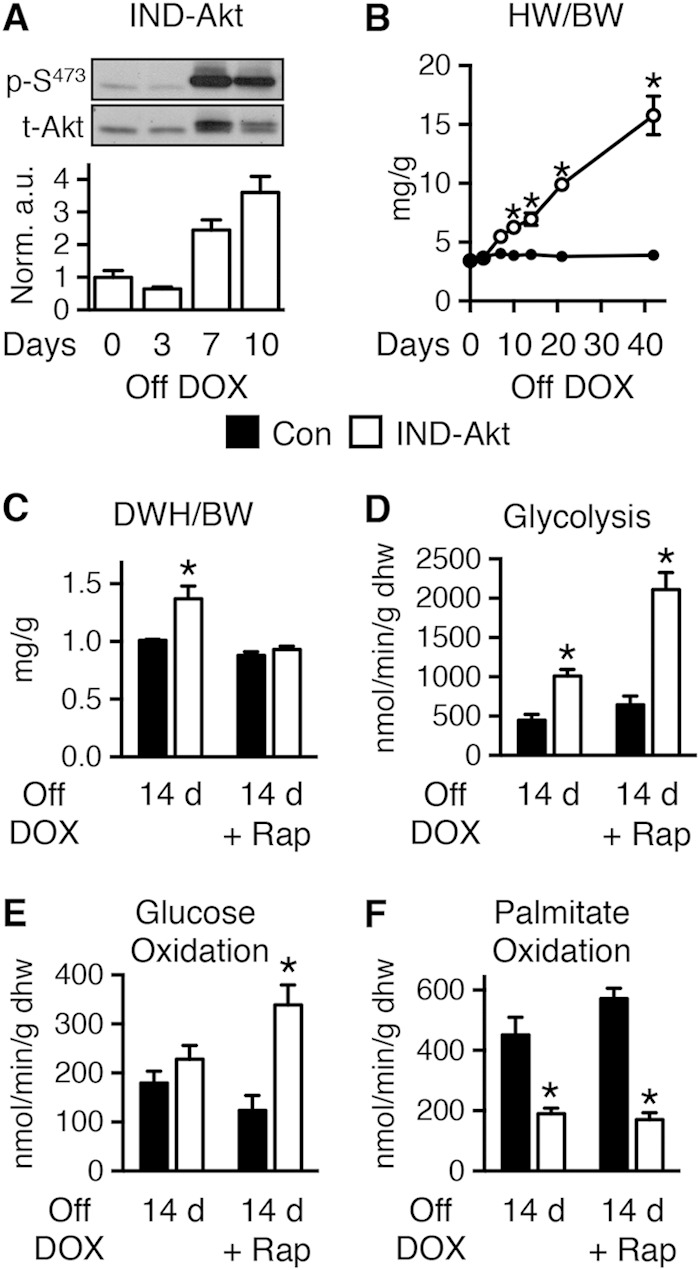
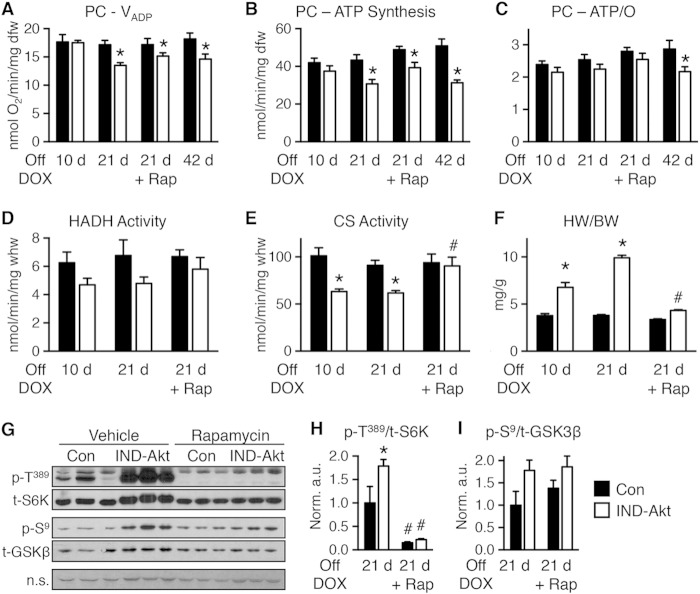
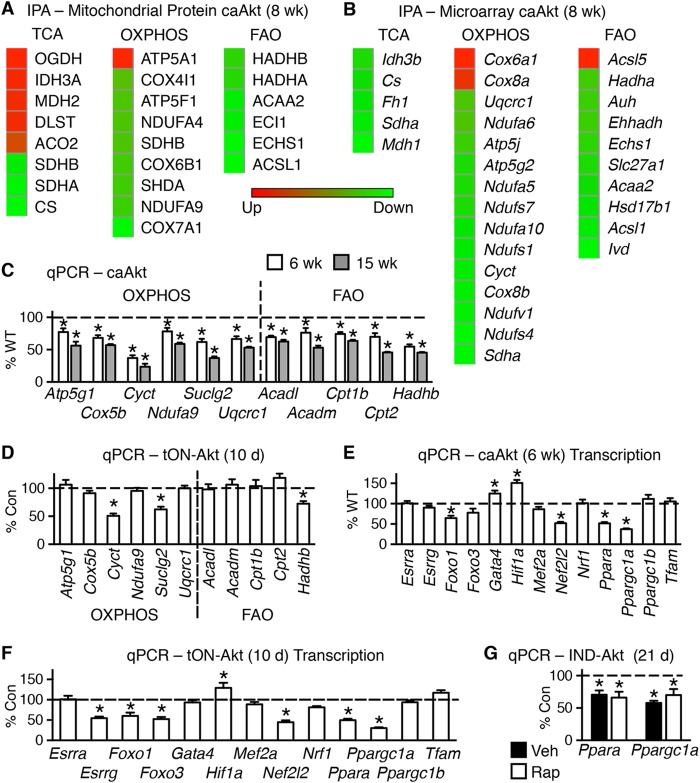
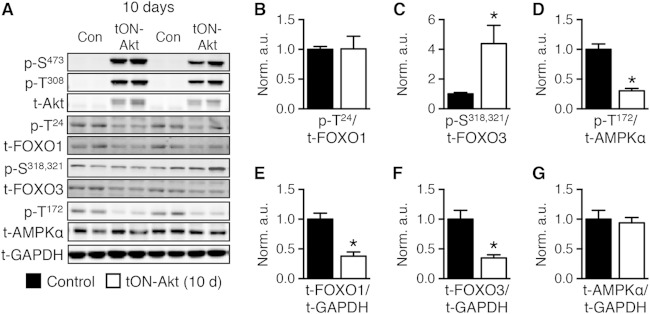
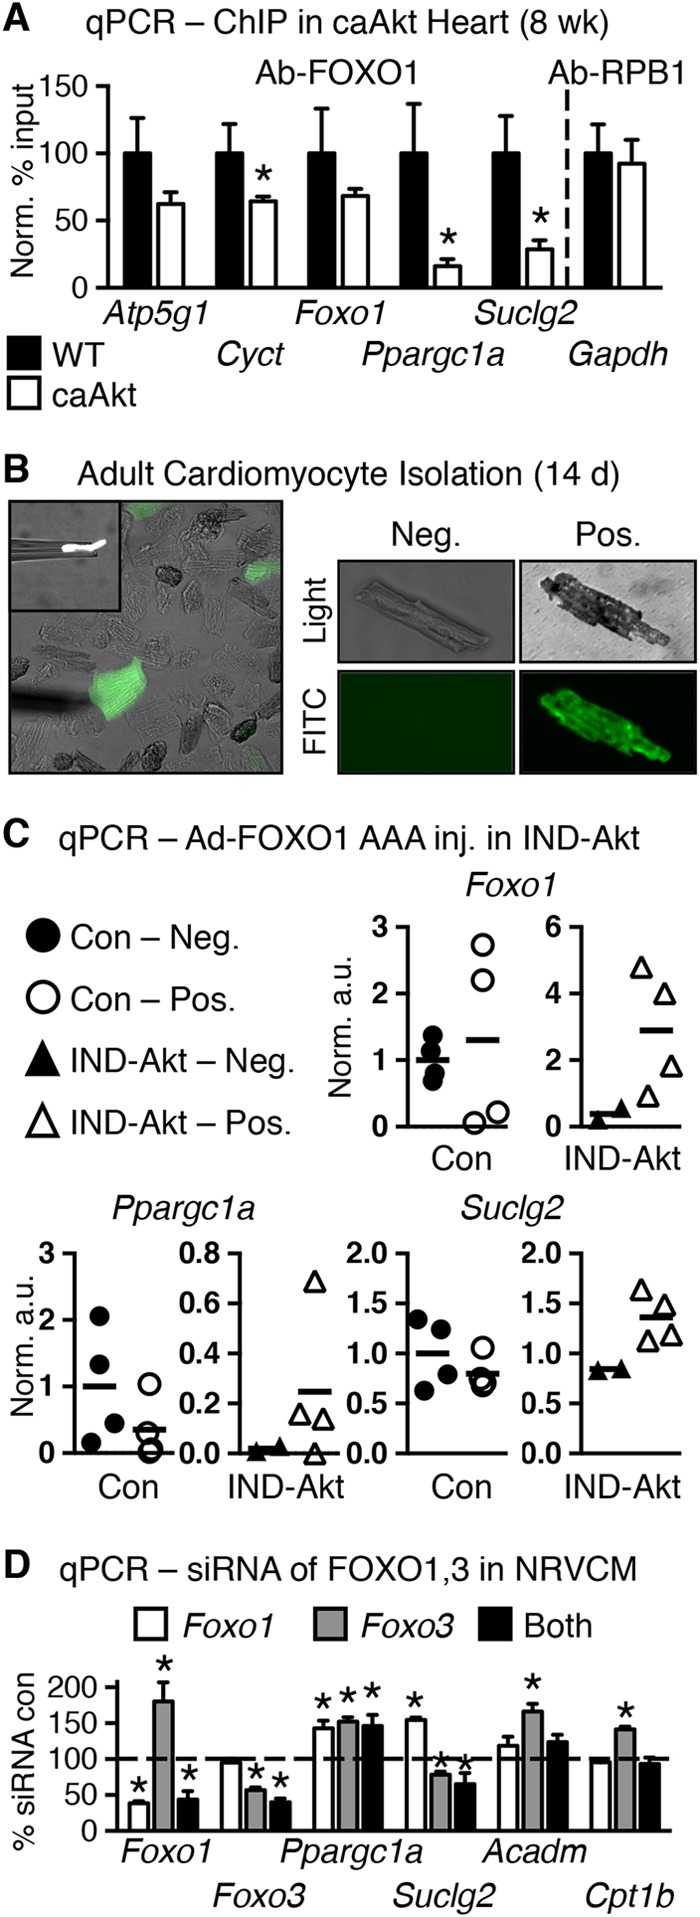
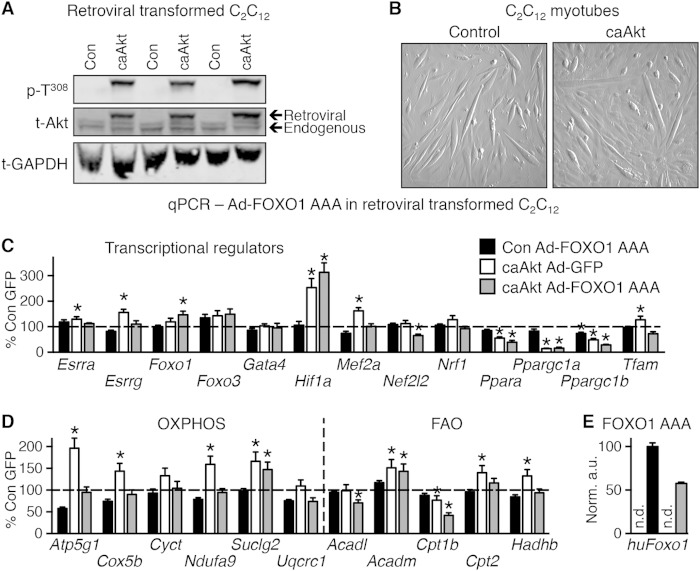
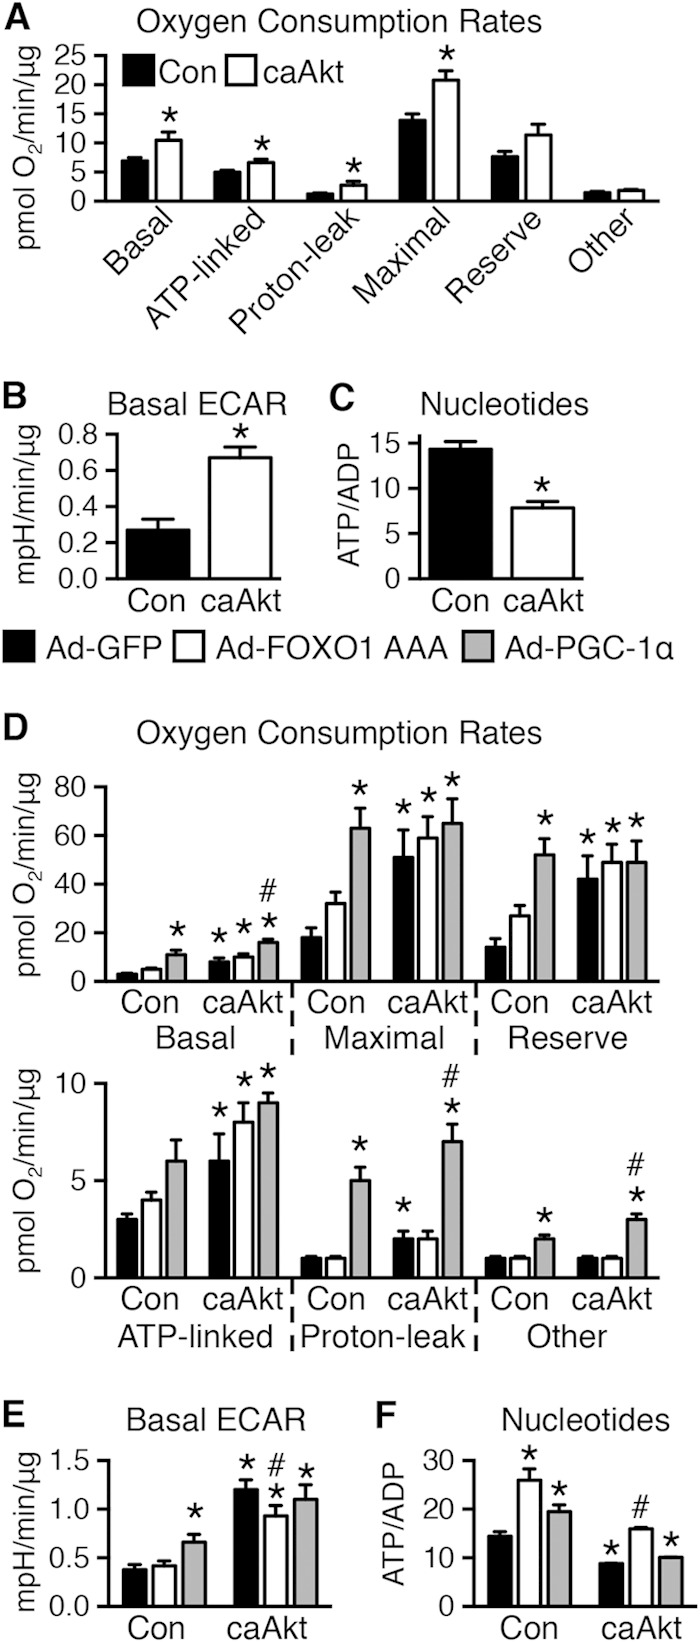
Sustained Akt activation induces cardiac hypertrophy (LVH), which may lead to heart failure. This study tested the hypothesis that Akt activation contributes to mitochondrial dysfunction in pathological LVH. Akt activation induced LVH and progressive repression of mitochondrial fatty acid oxidation (FAO) pathways. Preventing LVH by inhibiting mTOR failed to prevent the decline in mitochondrial function, but glucose utilization was maintained. Akt activation represses expression of mitochondrial regulatory, FAO, and oxidative phosphorylation genes in vivo that correlate with the duration of Akt activation in part by reducing FOXO-mediated transcriptional activation of mitochondrion-targeted nuclear genes in concert with reduced signaling via peroxisome proliferator-activated receptor α (PPARα)/PGC-1α and other transcriptional regulators. In cultured myocytes, Akt activation disrupted mitochondrial bioenergetics, which could be partially reversed by maintaining nuclear FOXO but not by increasing PGC-1α. Thus, although short-term Akt activation may be cardioprotective during ischemia by reducing mitochondrial metabolism and increasing glycolysis, long-term Akt activation in the adult heart contributes to pathological LVH in part by reducing mitochondrial oxidative capacity.


Figures

FIG 1
FIG 1
Transition from compensated cardiac hypertrophy to heart failure is associated with Akt activation and FOXO inhibition. (A) Representative Western blots of whole-heart extract from mice banded for 4 weeks at 27G-TAC (left) and 30G-TAC (middle) and 6- to 7-week-old caAkt mice (right). (B to E) Quantification of Western blotting results for phosphorylated to total protein: Akt at Ser473 (p-S473) (B) and Thr308 (p-T308) (C), FOXO1 at Thr24 (p-T24) (D), and FOXO3 at Ser318 and Ser321 (p-S318,321) (E) (n = 6 to 8). (F and G) Quantification of Western blotting results for total FOXO1 (F) and FOXO3 (G) normalized to total GAPDH (n = 6 to 8). Data shown as mean ± SEM. *, P < 0.05 versus group control. a.u., arbitrary units.
FIG 2
FIG 2
Impaired function and substrate metabolism in hearts from mice with constitutive activation of Akt in cardiomyocytes (caAkt). (A) Dry heart weight-to-body weight ratio (DHW/BW) in caAkt and WT mice (n = 4). (B to F) Cardiac power (B), glycolysis (C), glucose oxidation (D), palmitate oxidation (P = 0.08) (E), and MVO2 (F) in isolated working hearts from 18-week-old WT and caAkt mice (n = 4). (G) Representative electron micrographs of cardiac tissue from 18-week-old WT and caAkt mice. (H and I) Mitochondrial volume density (H) and mitochondrial number (I) per high-power field (hpf) in electron micrographs of 6- and 18-week-old WT and caAkt hearts (n = 3 or 4). Data are shown as mean ± SEM. *, P < 0.05 versus WT of same age.
FIG 3
FIG 3
Age-related impairment of mitochondrial function in saponin-permeabilized cardiac fibers from mice with constitutive activation of cardiac Akt (caAkt) at 6, 13, or 18 weeks of age. (A to C) Changes in maximal ADP-stimulated mitochondrial respiration (VADP) with the following substrates: palmitoyl-carnitine (PC) (A), pyruvate-malate (PM) (B), or glutamate-malate (GM) (C). (D to F) ATP synthesis rates in similarly treated saponin-permeabilized cardiac fibers with PC (D), PM (E), or GM (F) as the substrate. (G to I) ATP/O ratios with PC (G), PM (H), or GM (I) as the substrate. dfw, dry fiber weight. n = 4 to 6 per group. Data are shown as mean ± SEM. *, P < 0.05 versus WT of the same age and substrate.
FIG 4
FIG 4
Impaired energy signaling and mitochondrial enzymatic activities in hearts of 6- and 18-week-old caAkt mice. (A) Western blot analysis of whole-heart protein extract from wild-type (WT) and caAkt mice at 6 weeks of age (left). Quantification of Western blot analysis for phosphorylated AMPKα at Thr172 (p-T172) to total AMPKα (n = 6). (B) Aconitase enzymatic activity in mitochondrial and cytosolic fractions of cardiac tissue from 6-week-old WT and caAkt mice. (C) Carnitine palmitoyltransferase (CPT) enzymatic activities in isolated mitochondria from hearts of 6-week-old WT and caAkt mice (n = 4 to 6). (D) Hydroxyacyl-CoA dehydrogenase (HADH) in hearts from 6- and 18-week-old WT and caAkt mice (n = 4 to 6). (E) Citrate synthase (CS) enzymatic activities in WT and caAkt hearts (n = 4 to 6). Data shown as mean ± SEM. *, P < 0.05 versus age-matched WT.
FIG 5
FIG 5
Short-term activation of Akt increased glycolysis and reduced FAO in the heart, independently of hypertrophy. (A) Representative immunoblots and ratios of phosphorylated Akt at Ser473 (p-S473) to total Akt in hearts from IND-Akt mice withdrawn from doxycycline (DOX) (n = 3). (B) Heart weight-to-body weight ratio (HW/BW) changes with time zero (n = 3 or 4) and 3 (n = 3), 7 (n = 3 or 4), 10 (n = 9), 14 (n = 3), 21 (n = 6), and 42 (n = 4 or 8) days in control mice (Con) and IND-Akt mice, respectively. (C) Dry heart weight (DHW)-to-body weight ratios (DHW/BW) in control and IND-Akt mice withdrawn from DOX for 14 days and treated daily with rapamycin (Rap) were obtained after isolated working heart perfusions (n = 9). (D to F) Glycolysis (n = 4) (D), glucose oxidation (n = 4) (E), and palmitate oxidation (n = 5) (F) in isolated working hearts from control and IND-Akt mice withdrawn from DOX for 14 days and treated daily with rapamycin (Rap). Data shown as mean ± SEM. *, P < 0.05 versus induction and treatment-matched control.
FIG 6
FIG 6
Mitochondrial function is impaired following 10, 21, or 42 days of Akt induction. (A to C) Changes in maximal ADP-stimulated mitochondrial respiration (VADP) (A), ATP synthesis rates (B), and ATP/O ratios (C) in saponin-permeabilized cardiac fibers treated with palmitoyl-carnitine (PC) as the substrate from control (Con) or IND-Akt mice withdrawn from DOX for 10 days (n = 8 or 7), 21 days (n = 6 or 8), 21 days with rapamycin (Rap) (n = 8 or 9), or 42 days (n = 8 or 9), respectively. (D and E) Hydroxyacyl-CoA dehydrogenase (HADH) enzymatic activity (D) and citrate synthase (CS) enzymatic activity (E) from hearts of Con or IND-Akt mice withdrawn from DOX for 10 days (n = 6), 21 days (n = 4), or 21 days plus Rap (n = 3), respectively. (F) Heart weight-to-body weight ratio (HW/BW) of Con or IND-Akt mice withdrawn from DOX for 10 days (n = 7 or 10), 21 days (n = 6 or 9), or 21 days with Rap (n = 8 or 9), respectively. (G to I) Rapamycin alters signaling in IND-Akt hearts withdrawn from DOX. Ratio of phosphorylated p70 S6 kinase at Thr389 (p-T389) to total S6K (H) and ratio of phosphorylated glycogen synthase kinase 3β at Ser9 (p-S9) to total GSK-3β (I) in hearts from control and IND-Akt mice treated daily with rapamycin or vehicle. dfw, dry fiber weight; whw, wet heart weight; n.s., nonspecific band loading control. Data shown as mean ± SEM. *, P < 0.05 versus induction and treatment-matched control; #, P < 0.05 versus vehicle-treated animals of the same genotype.
FIG 7
FIG 7
Activation of Akt in the heart alters protein levels and gene expression of mitochondrion-related targets. (A) Heat maps of top canonical pathways of changes in mitochondrial proteins by ingenuity pathway analysis (IPA) (n = 3). (B) Microarray results of mRNA levels of the same three statistically changed proteomics canonical pathways in hearts of WT and caAkt mice (n = 3). (C) qPCR quantification of mRNA levels of OXPHOS and FAO genes in hearts from 6- and 15-week-old caAkt mice (n = 6). (D) qPCR quantification of mRNAs for OXPHOS and FAO genes in hearts from tON-Akt mice following 10 days of transgene induction (n = 6). (E and F) qPCR quantification of mRNAs for transcriptional regulators in hearts from caAkt (E) and tON-Akt (F). (G) qPCR quantification of mRNA levels measured in control and IND-Akt hearts induced for 21 days and treated with/without rapamycin (Rap). Data shown as mean ± SEM. Gene names are described in Table S1 in the supplemental material. *, P < 0.05 versus control. Veh, vehicle.
FIG 8
FIG 8
Short-term transgenic activation of Akt is associated with inhibition of FOXO and AMPK. (A) Representative Western blot analysis of whole-heart extract from Con or tON-Akt mice following 10 days of DOX treatment. (B to G) Quantification of Western blot analysis for ratios of phosphorylated to total protein or total protein to loading control (GAPDH): FOXO1 at Thr24 (p-T24), FOXO3 at Ser318,321 (p-S318,321), AMPKα at Thr172 (p-T172) to total protein and total FOXO1, FOXO3, and AMPKα to GAPDH (n = 6). Data shown as mean ± SEM normalized to control (=1.0). *, P < 0.05 versus control.
FIG 9
FIG 9
FOXO transcription factors may regulate Akt-mediated modulation of mitochondrial gene expression. (A) qPCR quantification of DNA promoter occupancy following chromatin immunoprecipitation (ChIP) in control and 8-week-old caAkt mouse hearts for antibody to FOXO1 (Ab-FOXO1) or positive-control RNA polymerase II (Ab-RPB1) (n = 3). Data shown as mean ± SEM. *, P < 0.05 versus WT. Candidate response elements are defined in Table S5 in the supplemental material. (B) Representative pictures of cardiomyocytes isolated from IND-Akt (14-day) hearts after in vivo adenoviral injection of GFP and constitutively active FOXO1 (Ad-FOXO1 AAA). FITC, fluorescein isothiocyanate. (C) qPCR from GFP-negative and GFP-positive cells; arbitrary units normalized to GFP-negative Con cells (=1.0) (n = 2 to 4 independent harvests of 10 cells per sample). (D) qPCR from primary neonatal ventricular cardiomyocytes (NRVCMs) following Foxo1 and/or Foxo3 siRNA knockdown relative to scrambled siRNA control (=100%) and normalized to GAPDH (n = 6 to 9). Data shown as mean ± SEM. *, P < 0.05 versus Con.
FIG 10
FIG 10
In vitro expression of caAkt alters gene expression in myotubes. (A) Western blot analysis of whole-cell lysate following selective passaging to confirm overexpression of caAkt in retrovirus-transformed C2C12 myotubes. (B) Representative images of myotube formation in control and caAkt-transformed C2C12 cells following 5 days of differentiation. (C and D) qPCR analysis of mRNA from C2C12 myotubes 5 days following Ad-FOXO1 AAA infection relative to Ad-GFP control (=100%) and normalized to control H3f3a for genes of transcriptional regulators (C) or oxidative phosphorylation (OXPHOS) and fatty acid oxidation (FAO) (D). (E) qPCR for human FOXO1 cDNA as encoded by the Ad-FOXO1 AAA adenovirus. n = 5 to 6. n.d., not detected. Data shown as mean ± SEM. *, P < 0.05 versus Ad-GFP-infected control cells.
FIG 11
FIG 11
In vitro expression of caAkt alters cellular bioenergetics in myotubes. (A and B) Seahorse cellular bioenergetics analysis of oxygen consumption rates (OCR) (A) (further details in Materials and Methods) and extracellular acidification rates (ECAR) (B) in control or caAkt-transduced C2C12 myotubes as in Fig. 10 (n = 10 to 11). (C) HPLC quantification of the nucleotides ATP and ADP in control or caAkt-transduced C2C12 myotubes (n = 6). Data shown as mean ± SEM. *, P < 0.05 versus Con. (D and E) Seahorse cellular bioenergetics analysis of OCR (D) and ECAR (E) in C2C12 myotubes as described above following Ad-PGC-1α or Ad-FOXO1 AAA infection compared to Ad-GFP (n ≥ 4). (F) HPLC quantification of the nucleotides ATP and ADP in C2C12 myotubes as described for panels D and E (n = 3). Data shown as mean ± SEM. *, P < 0.05 versus Ad-GFP Con. #, P < 0.05 versus Ad-GFP caAkt.

Similar articles

Cited by

References

    1. Abel ED, Doenst T. 2011. Mitochondrial adaptations to physiological vs. pathological cardiac hypertrophy. Cardiovasc Res 90:234–242. doi:10.1093/cvr/cvr015. - DOI - PMC - PubMed
    1. Riehle C, Wende AR, Zaha VG, Pires KM, Wayment B, Olsen C, Bugger H, Buchanan J, Wang X, Moreira AB, Doenst T, Medina-Gomez G, Litwin SE, Lelliott CJ, Vidal-Puig A, Abel ED. 2011. PGC-1β deficiency accelerates the transition to heart failure in pressure overload hypertrophy. Circ Res 109:783–793. doi:10.1161/CIRCRESAHA.111.243964. - DOI - PMC - PubMed
    1. Matsui T, Nagoshi T, Hong EG, Luptak I, Hartil K, Li L, Gorovits N, Charron MJ, Kim JK, Tian R, Rosenzweig A. 2006. Effects of chronic Akt activation on glucose uptake in the heart. Am J Physiol Endocrinol Metab 290:E789–E797. doi:10.1152/ajpendo.00564.2004. - DOI - PubMed
    1. Matsui T, Tao J, del Monte F, Lee KH, Li L, Picard M, Force TL, Franke TF, Hajjar RJ, Rosenzweig A. 2001. Akt activation preserves cardiac function and prevents injury after transient cardiac ischemia in vivo. Circulation 104:330–335. doi:10.1161/01.CIR.104.3.330. - DOI - PubMed
    1. Matsui T, Li L, Wu JC, Cook SA, Nagoshi T, Picard MH, Liao R, Rosenzweig A. 2002. Phenotypic spectrum caused by transgenic overexpression of activated Akt in the heart. J Biol Chem 277:22896–22901. doi:10.1074/jbc.M200347200. - DOI - PubMed

Publication types

MeSH terms