. 2015 Jan 6;112(1):220-5.
doi: 10.1073/pnas.1421697112. Epub 2014 Dec 22.

TAp73 suppresses tumor angiogenesis through repression of proangiogenic cytokines and HIF-1α activity

Affiliations

TAp73 suppresses tumor angiogenesis through repression of proangiogenic cytokines and HIF-1α activity

Marina Stantic et al. Proc Natl Acad Sci U S A. .

Abstract

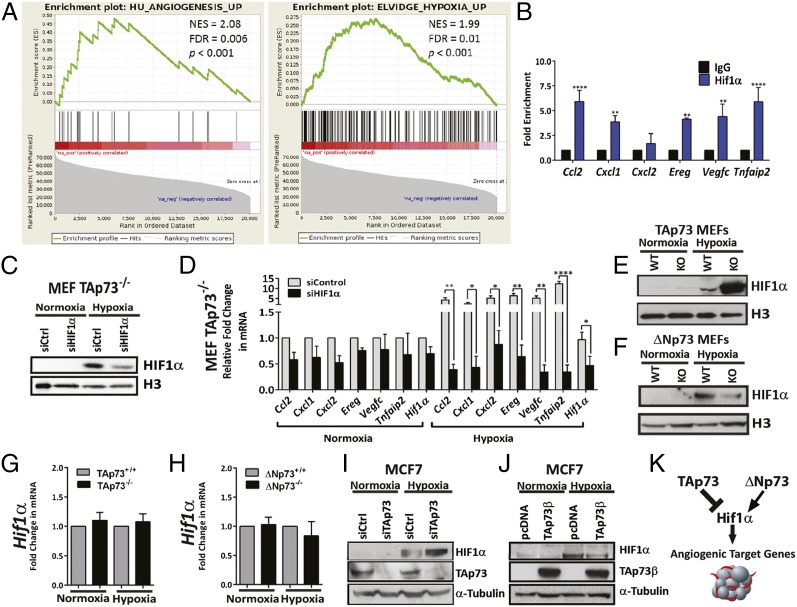
The p53-family member TAp73 is known to function as a tumor suppressor and regulates genomic integrity, cellular proliferation, and apoptosis; however, its role in tumor angiogenesis is poorly understood. Here we demonstrate that TAp73 regulates tumor angiogenesis through repression of proangiogenic and proinflammatory cytokines. Importantly, loss of TAp73 results in highly vascularized tumors, as well as an increase in vessel permeability resulting from disruption of vascular endothelial-cadherin junctions between endothelial cells. In contrast, loss of the oncogenic p73 isoform ΔNp73 leads to reduced blood vessel formation in tumors. Furthermore, we show that up-regulated ΔNp73 levels are associated with increased angiogenesis in human breast cancer and that inhibition of TAp73 results in an accumulation of HIF-1α and up-regulation of HIF-1α target genes. Taken together, our data demonstrate that loss of TAp73 or ΔNp73 up-regulation activates the angiogenic switch that stimulates tumor growth and progression.

Keywords: HIF-1 alpha; angiogenesis; p73; tumor microenvironment; vascular permeability.


Conflict of interest statement

The authors declare no conflict of interest.

Figures

Fig. 1.
Fig. 1.
TAp73-deficient cells form larger and more vascularized tumors compared with WT. (A) E1A/RasV12-transformed WT or TAp73−/− MEFs were injected s.c. into nude mice (n = 9/group), tumor growth was measured at a 2-d interval up to 22 d postinjection. Results are shown as the mean ± SEM, P < 0.0001. (B) Increased tumor weight in absence of TAp73 (TAp73−/−, 0.33 ± 0.07 g vs. WT, 0.14 ± 0.045 g; *P < 0.05) Results are shown as the mean ± SD. (C–F) Representative images and quantification of tumor vasculature in WT, TAp73−/−, and ΔNp73−/− tumors using anti-endomucin staining (red) on paraffin sections. In total, n = 14 TAp73−/−, n = 12 TAp73+/+, n = 4 ΔNp73−/−, and n = 4 ΔNp73+/+ tumors were analyzed and five fields/tumor were used for quantification. (G, H, J, and K) Images and quantification of vasculature in spontaneous B-cell lymphoma model in TAp73−/− (n = 3), ΔNp73−/− (n = 3), and WT (n = 3) tumors, using anti-endomucin staining (green) on paraffin sections. Five to 10 fields per tumor were used for quantification (**P < 0.01). (Right) B220 staining indicating all tumors analyzed are of B-cell origin. (I) Tumor cell xenografts into zebrafish embryos. (Left) 48 h postfertilization (hpf) Tg(fli:EGFP) embryos injected with CM-DiI–labeled MEFsE1A/Ras into the perivitelline space. (Middle) Injected embryo stage 72 hpf (20 h after injection) with a positive angiogenic response (arrowhead). (Right) Overlay with grafted cells (red). (L) Quantification of angiogenic response in zebrafish comparing three WT cell lines with three ΔNp73−/− or three TAp73−/− cell lines (all generated from paired litter mates). Results are presented as mean fold change ± SD compared with WT. Cells deficient for ΔNp73 show a reduced angiogenic response compared with WT [0.54 ± 0.06 vs. 1 (WT); ***P < 0.0005]; in contrast, TAp73−/− cells show an enhanced response [1.88 ± 0.35 vs. 1 (WT); *P < 0.05].
Fig. 2.
Fig. 2.
Loss of TAp73 increases tumor blood vessel permeability through reduced endothelial cell–cell contact. (A and B) TAp73+/+ and TAp73−/− tumors perfused with FITC-labeled dextran and stained for endothelial cells (endomucin). Green, FITC-labeled dextran leakage into the extravascular tumor space; red, endomucin staining of blood vessels. Mean fluorescent intensity (MFI) was determined for total dextran-FITC (green) signal with pixel counting; intravascular dextran-FITC (yellow) was subtracted from the final value (n = 5/group, five fields/tumor was used for quantification; ****P < 0.0001). (Scale bar, 100 μm.) (C) Schematic representation of in vitro cell permeability assay. (D) SEM of confluent monolayer HuDMECs treated with CM from hypoxic TAp73+/+ or TAp73−/−MEFsE1A/Ras (Middle and Bottom) or control HuDMEC media (Top). (Top and Middle) Arrow indicating well-defined junctions and cell–cell contact. (Bottom) Breaks in cell–cell contact and gaps between HuDMECs treated with CM from hypoxic TAp73−/−MEFsE1A/Ras. (Scale bar, 10 μm.) (E and F) VE–cadherin (red) immunofluorescence staining and quantification. (Scale bar, 50 μm.) (Top and Middle) HuDMECs treated with control media or CM from hypoxic TAp73+/+ MEFsE1A/Ras present distinct interendothelial VE-cadherin bonds and close cell–cell contact. (Bottom) Interendothelial VE-cadherin bonds are lost, resulting in weakened cell–cell contact in HuDMECs treated with CM from hypoxic TAp73−/− MEFsE1A/Ras.
Fig. 3.
Fig. 3.
Expression of angiogenic factors is controlled by p73 isoforms. (A) Volcano plot presenting angiogenic RT2 profile PCR array data as relative fold-change of all 84 genes plotted against the P value (Student’s t test). Vertical threshold reflects relative statistical significance (P ≤ 0,05), and horizontal threshold reflects relative fold-change in gene expression ≥twofold difference between TAp73 WT and KO tumors (n = 4 tumors/group). (B) Heatmap showing fold change for genes that passed the threshold (red, high; green, low). (CF) Validation of potential target genes using quantitative RT-PCR; results shown are the mean fold change ± SD relative to WT (red dotted line). (C) Genes confirmed to be deregulated in TAp73-deficient tumors compared with WT (n = 3 tumors/group). (D) Expression analysis of tumors derived from ΔNp73−/− or WT MEFsE1A/Ras. Results shown are the mean fold change ± SD relative to WT (n = 3/group). Expression analysis of TAp73−/− MEFsE1A/Ras (E), ΔNp73−/−MEFsE1A/Ras (F), H1299 cells with shRNA targeting TAp73 (G), and MDA MB-231 treated with siRNA against TAp73 (H), grown in vitro in normoxia (gray bars) or hypoxia for 24 h (black bars), normalized to 18S or 28S RNA and compared with WT cells. n.d., not detected.
Fig. 4.
Fig. 4.
Shifting the balance between p73 isoforms correlates with angiogenesis in patients with breast cancer and affects accumulation of Hif-1α during hypoxia. (A) GSEA was performed with two different gene sets: angiogenesis gene set (n = 21) (31) and hypoxia gene set (n = 171) (32). “Signal-to-Noise” ratio statistic was used to rank genes according to their correlation with high levels of ΔNp73 (red); genes on the left correlate most with ΔNp73. The vertical black lines indicate the positions of genes in the studied gene set in an ordered, nonredundant data set. The green curve represents the enrichment score curve obtained by the GSEA software. Breast cancer samples expressing high levels of ΔNp73 show increased expression of angiogenesis genes and genes up-regulated by hypoxia (GSEA P < 0.001) (B) ChIP-qPCR, enrichment fold increase in TAp73−/− MEFsE1A/Ras for Hif-1α predicted targets. Five independent experiments are combined. P ≤ 0.05; **P ≤ 0.01; ***P ≤ 0.001; ****P ≤ 0.0001. (C) Western blot analysis of nuclear extracts isolated from TAp73−/− MEFsE1A/Ras treated with siHIF1α and grown in hypoxia and normoxia for 12 h. (D) Expression analysis of genes in TAp73−/− MEFsE1A/Ras siControl (gray bars) and in TAp73−/− MEFsE1A/Ras siHIF1α (black bars) grown in normoxia and hypoxia for 12 h; samples are normalized to 18S RNA and compared with siControl normoxia cells. Western blot showing Hif-1α accumulation after 12 h hypoxia in (E) TAp73−/− MEFsE1A/Ras and (F) ΔNp73−/− MEFsE1A/Ras. (G and H) Hif-1α mRNA in hypoxic and normoxic TAp73−/− and ΔNp73−/− MEFE1A/Ras cells relative to WT cells. Western blot showing Hif-1α protein in MCF7 cells treated with (I) siTAp73 or (J) TAp73 overexpression. (K) Schematic model of p73 isoforms opposing effect on Hif-1α, and thus deregulating angiogenic target genes.

Similar articles

Cited by

References

    1. Rufini A, et al. p73 in Cancer. Genes Cancer. 2011;2(4):491–502. - PMC - PubMed
    1. Grob TJ, et al. Human delta Np73 regulates a dominant negative feedback loop for TAp73 and p53. Cell Death Differ. 2001;8(12):1213–1223. - PubMed
    1. Tomasini R, et al. TAp73 knockout shows genomic instability with infertility and tumor suppressor functions. Genes Dev. 2008;22(19):2677–2691. - PMC - PubMed
    1. Tomasini R, et al. TAp73 regulates the spindle assembly checkpoint by modulating BubR1 activity. Proc Natl Acad Sci USA. 2009;106(3):797–802. - PMC - PubMed
    1. Rodhe J, Kavanagh E, Joseph B. TAp73β-mediated suppression of cell migration requires p57Kip2 control of actin cytoskeleton dynamics. Oncotarget. 2013;4(2):289–297. - PMC - PubMed

Publication types

MeSH terms