

Stochastic approach to the molecular counting problem in superresolution microscopy
- PMID: 25535361
- PMCID: PMC4299210
- DOI: 10.1073/pnas.1408071112
Stochastic approach to the molecular counting problem in superresolution microscopy
Abstract
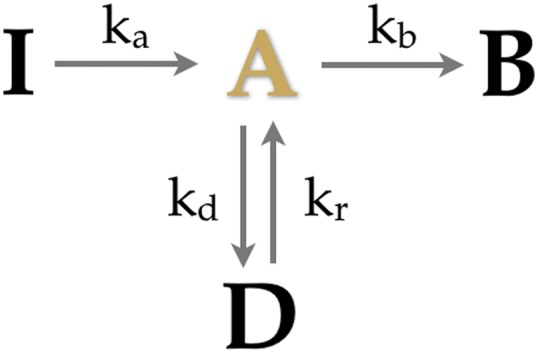
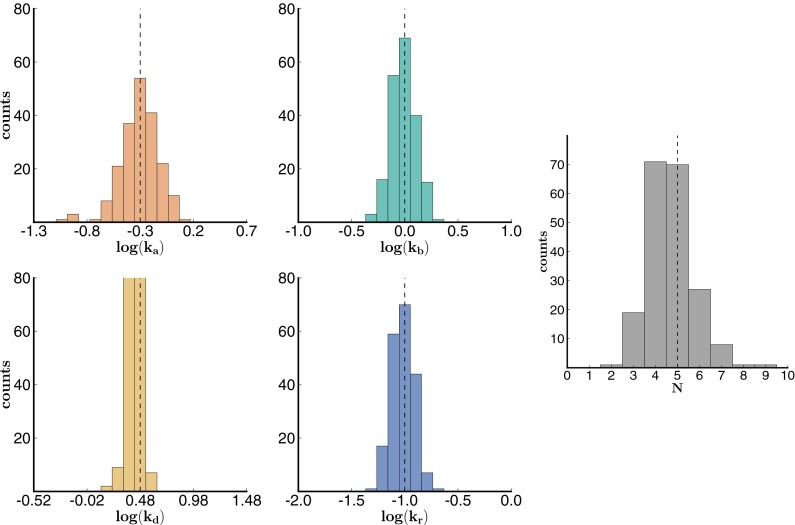
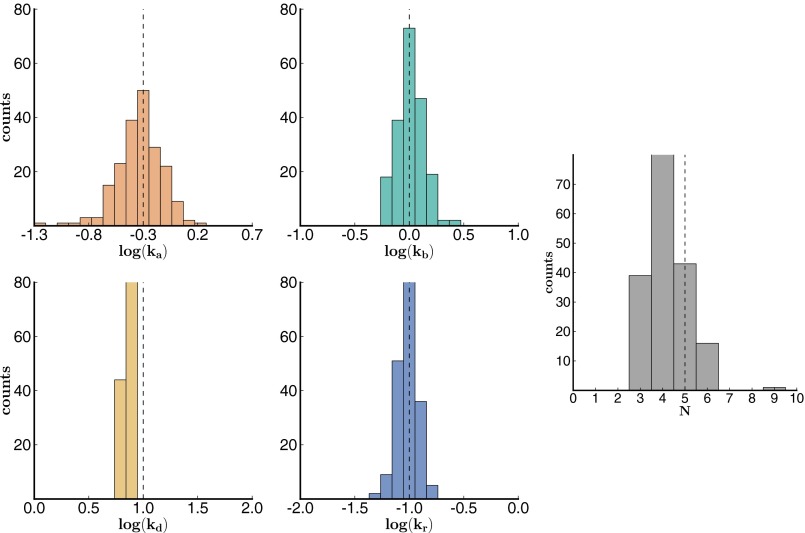
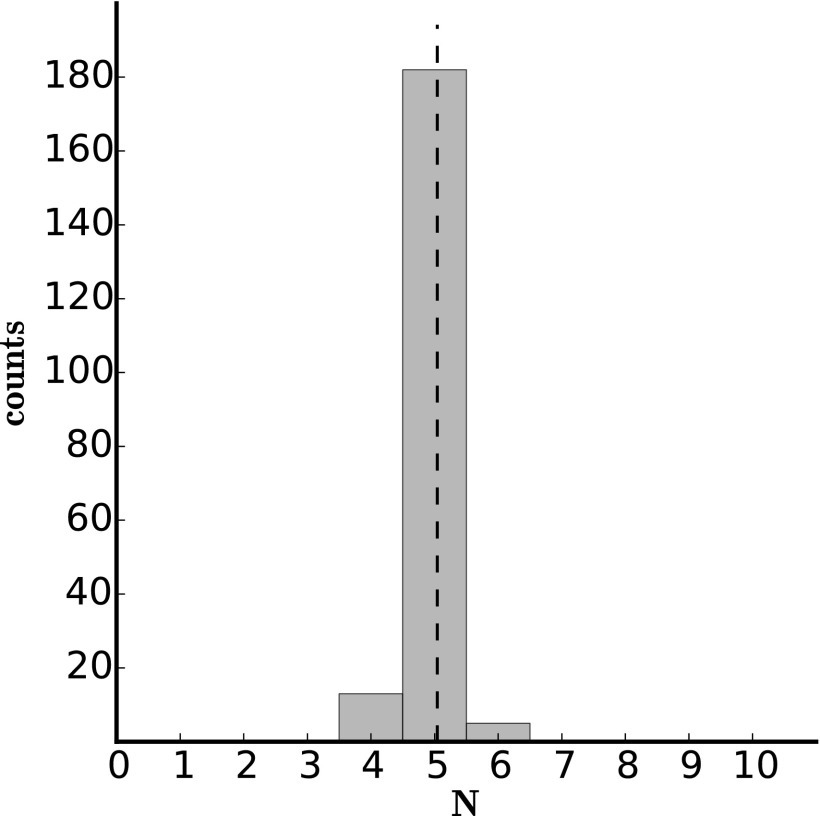
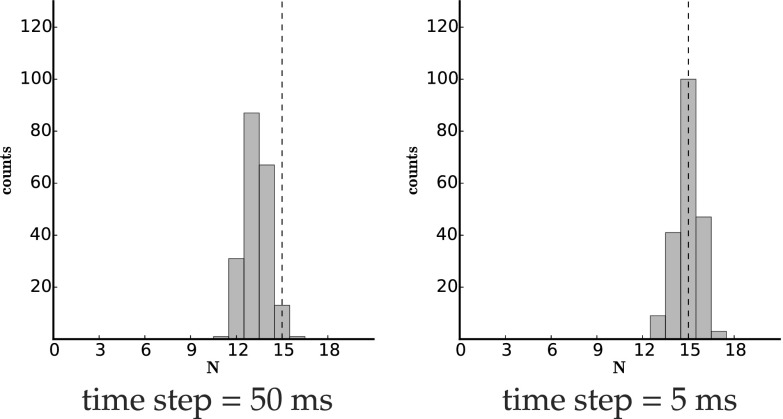
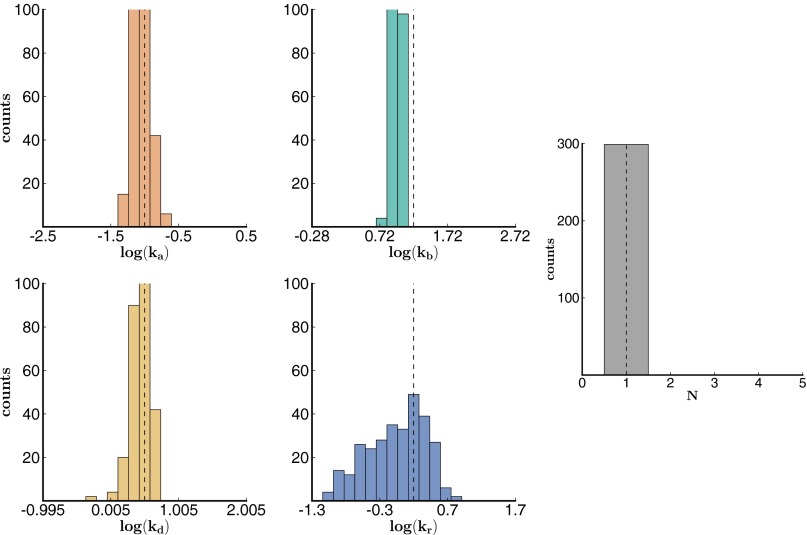
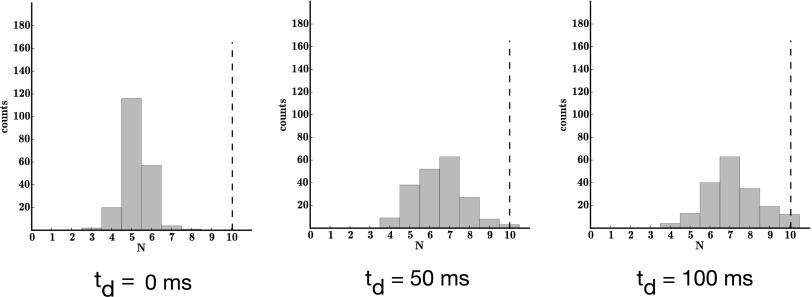
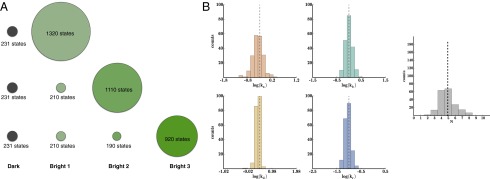
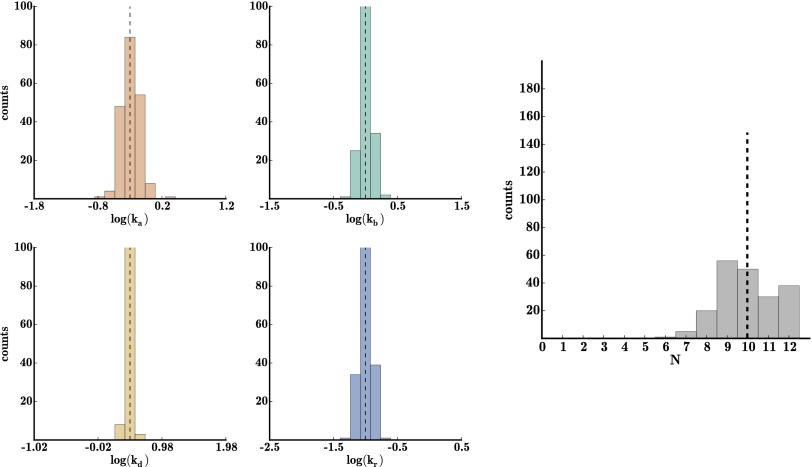
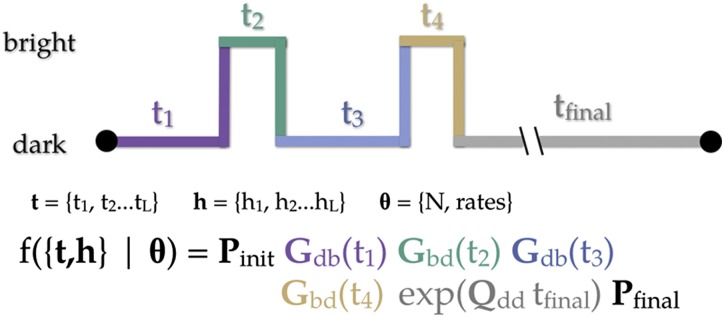
Superresolution imaging methods--now widely used to characterize biological structures below the diffraction limit--are poised to reveal in quantitative detail the stoichiometry of protein complexes in living cells. In practice, the photophysical properties of the fluorophores used as tags in superresolution methods have posed a severe theoretical challenge toward achieving this goal. Here we develop a stochastic approach to enumerate fluorophores in a diffraction-limited area measured by superresolution microscopy. The method is a generalization of aggregated Markov methods developed in the ion channel literature for studying gating dynamics. We show that the method accurately and precisely enumerates fluorophores in simulated data while simultaneously determining the kinetic rates that govern the stochastic photophysics of the fluorophores to improve the prediction's accuracy. This stochastic method overcomes several critical limitations of temporal thresholding methods.
Keywords: counting problem; fluorescence; protein complexes; single molecule; superresolution.
Conflict of interest statement
The authors declare no conflict of interest.
Figures
Comment in
-
A promising approach to molecular counting problem in superresolution microscopy.Proc Natl Acad Sci U S A. 2015 Jan 13;112(2):304-5. doi: 10.1073/pnas.1423233112. Epub 2014 Dec 30. Proc Natl Acad Sci U S A. 2015. PMID: 25550514 Free PMC article. No abstract available.
Similar articles
-
Nanoscale imaging by superresolution fluorescence microscopy and its emerging applications in biomedical research.Crit Rev Biomed Eng. 2013;41(4-5):281-308. doi: 10.1615/critrevbiomedeng.2014010448. Crit Rev Biomed Eng. 2013. PMID: 24941410 Review.
-
Photostable and photoswitching fluorescent dyes for super-resolution imaging.J Biol Inorg Chem. 2017 Jul;22(5):639-652. doi: 10.1007/s00775-016-1435-y. Epub 2017 Jan 12. J Biol Inorg Chem. 2017. PMID: 28083655 Review.
-
Practical limitations of superresolution imaging due to conventional sample preparation revealed by a direct comparison of CLSM, SIM and dSTORM.J Microsc. 2016 Jun;262(3):306-15. doi: 10.1111/jmi.12365. Epub 2015 Dec 22. J Microsc. 2016. PMID: 26694787
-
Stochastic optical reconstruction microscopy (STORM): a method for superresolution fluorescence imaging.Cold Spring Harb Protoc. 2013 Jun 1;2013(6):498-520. doi: 10.1101/pdb.top075143. Cold Spring Harb Protoc. 2013. PMID: 23734025
-
Molecular orientation affects localization accuracy in superresolution far-field fluorescence microscopy.Nano Lett. 2011 Jan 12;11(1):209-13. doi: 10.1021/nl103472b. Epub 2010 Dec 6. Nano Lett. 2011. PMID: 21133355
Cited by
-
Toward Absolute Molecular Numbers in DNA-PAINT.Nano Lett. 2019 Nov 13;19(11):8182-8190. doi: 10.1021/acs.nanolett.9b03546. Epub 2019 Oct 9. Nano Lett. 2019. PMID: 31535868 Free PMC article.
-
Detecting stoichiometry of macromolecular complexes in live cells using FRET.Nat Commun. 2016 Dec 6;7:13709. doi: 10.1038/ncomms13709. Nat Commun. 2016. PMID: 27922011 Free PMC article.
-
Towards Unbiased Fluorophore Counting in Superresolution Fluorescence Microscopy.Nanomaterials (Basel). 2023 Jan 23;13(3):459. doi: 10.3390/nano13030459. Nanomaterials (Basel). 2023. PMID: 36770420 Free PMC article.
-
Counting tagged molecules one by one: Quantitative photoactivation and bleaching of photoactivatable fluorophores.J Chem Phys. 2015 Sep 14;143(10):104201. doi: 10.1063/1.4929991. J Chem Phys. 2015. PMID: 26374025 Free PMC article.
-
Bayesian Inference of Binding Kinetics from Fluorescence Time Series.bioRxiv [Preprint]. 2025 Feb 3:2025.02.03.636267. doi: 10.1101/2025.02.03.636267. bioRxiv. 2025. Update in: J Phys Chem B. 2025 May 15;129(19):4670-4681. doi: 10.1021/acs.jpcb.5c01180. PMID: 39975252 Free PMC article. Updated. Preprint.
References
Publication types
MeSH terms
Substances
Grants and funding
LinkOut - more resources
Full Text Sources
Other Literature Sources
