Stabilization of morphine tolerance with long-term dosing: association with selective upregulation of mu-opioid receptor splice variant mRNAs
- PMID: 25535370
- PMCID: PMC4291645
- DOI: 10.1073/pnas.1419183112
Stabilization of morphine tolerance with long-term dosing: association with selective upregulation of mu-opioid receptor splice variant mRNAs
Abstract
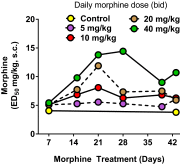
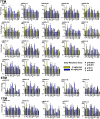
Chronic morphine administration is associated with the development of tolerance, both clinically and in animal models. Many assume that tolerance is a continually progressive response to chronic opioid dosing. However, clinicians have long appreciated the ability to manage cancer pain in patients for months on stable opioid doses, implying that extended dosing may eventually result in a steady state in which the degree of tolerance remains constant despite the continued administration of a fixed morphine dose. Preclinical animal studies have used short-term paradigms, typically a week or less, whereas the clinical experience is based upon months of treatment. Chronic administration of different fixed morphine doses produced a progressive increase in the ED50 that peaked at 3 wk in mice, consistent with prior results at shorter times. Continued morphine dosing beyond 3 wk revealed stabilization of the level of tolerance for up to 6 wk with no further increase in the ED50. The degree of tolerance at all time points was dependent upon the dose of morphine. The mRNA levels for the various mu opioid receptor splice variants were assessed to determine whether stabilization of morphine tolerance was associated with changes in their levels. After 6 wk of treatment, mRNA levels of the variants increased as much as 300-fold for selected variants in specific brain regions. These findings reconcile preclinical and clinical observations regarding the development of morphine tolerance.
Keywords: MOR-1; analgesia; opiate receptor; opioid; splice variant.
Conflict of interest statement
The authors declare no conflict of interest.
Figures


Similar articles
-
Sex Associated Differential Expressions of the Alternatively Spliced Variants mRNA of OPRM1 in Brain Regions of C57BL/6 Mouse.Cell Physiol Biochem. 2018;50(4):1441-1459. doi: 10.1159/000494644. Epub 2018 Oct 25. Cell Physiol Biochem. 2018. PMID: 30359988
-
Genetic dissociation of morphine analgesia from hyperalgesia in mice.Psychopharmacology (Berl). 2017 Jun;234(12):1891-1900. doi: 10.1007/s00213-017-4600-2. Epub 2017 Mar 25. Psychopharmacology (Berl). 2017. PMID: 28343361 Free PMC article.
-
Alternatively spliced mu opioid receptor C termini impact the diverse actions of morphine.J Clin Invest. 2017 Apr 3;127(4):1561-1573. doi: 10.1172/JCI88760. Epub 2017 Mar 20. J Clin Invest. 2017. PMID: 28319053 Free PMC article.
-
The mechanism of μ-opioid receptor (MOR)-TRPV1 crosstalk in TRPV1 activation involves morphine anti-nociception, tolerance and dependence.Channels (Austin). 2015;9(5):235-43. doi: 10.1080/19336950.2015.1069450. Epub 2015 Jul 15. Channels (Austin). 2015. PMID: 26176938 Free PMC article. Review.
-
Mu Opioid Pharmacology: 40 Years to the Promised Land.Adv Pharmacol. 2018;82:261-291. doi: 10.1016/bs.apha.2017.09.006. Epub 2017 Nov 15. Adv Pharmacol. 2018. PMID: 29413524 Review.
Cited by
-
Changes in Plasma Metabolic Signature upon Acute and Chronic Morphine Administration in Morphine-Tolerant Mice.Metabolites. 2023 Mar 16;13(3):434. doi: 10.3390/metabo13030434. Metabolites. 2023. PMID: 36984873 Free PMC article.
-
Identification of Abundant and Evolutionarily Conserved Opioid Receptor Circular RNAs in the Nervous System Modulated by Morphine.Mol Pharmacol. 2019 Aug;96(2):247-258. doi: 10.1124/mol.118.113977. Epub 2019 Jun 26. Mol Pharmacol. 2019. PMID: 31243060 Free PMC article.
-
Structural and functional interactions between six-transmembrane μ-opioid receptors and β2-adrenoreceptors modulate opioid signaling.Sci Rep. 2015 Dec 11;5:18198. doi: 10.1038/srep18198. Sci Rep. 2015. PMID: 26657998 Free PMC article.
-
Binding preference at the μ-opioid receptor underlies distinct pharmacology of cyclopropyl versus valeryl analogs of fentanyl.Neuropharmacology. 2023 Apr 1;227:109442. doi: 10.1016/j.neuropharm.2023.109442. Epub 2023 Jan 30. Neuropharmacology. 2023. PMID: 36731721 Free PMC article.
-
Dysregulated expression of the alternatively spliced variant mRNAs of the mu opioid receptor gene, OPRM1, in the medial prefrontal cortex of male human heroin abusers and heroin self-administering male rats.J Neurosci Res. 2022 Jan;100(1):35-47. doi: 10.1002/jnr.24640. Epub 2020 Jun 7. J Neurosci Res. 2022. PMID: 32506472 Free PMC article.
References
-
- Way EL, Loh HH, Shen F-H. Simultaneous quantitative assessment of morphine tolerance and physical dependence. J Pharmacol Exp Ther. 1969;167(1):1–8. - PubMed
-
- Gutstein HB, Trujillo KA, Akil H. Does chronic nociceptive stimulation alter the development of morphine tolerance? Brain Res. 1995;680(1-2):173–179. - PubMed
-
- Trujillo KA, Akil H. Inhibition of morphine tolerance and dependence by the NMDA receptor antagonist MK-801. Science. 1991;251(4989):85–87. - PubMed
Publication types
MeSH terms
Substances
Grants and funding
- R56 DA002615/DA/NIDA NIH HHS/United States
- DA13997/DA/NIDA NIH HHS/United States
- T32 DA007242/DA/NIDA NIH HHS/United States
- R01 DA013997/DA/NIDA NIH HHS/United States
- DA02615/DA/NIDA NIH HHS/United States
- DA07242/DA/NIDA NIH HHS/United States
- R01 DA006241/DA/NIDA NIH HHS/United States
- P30 CA008748/CA/NCI NIH HHS/United States
- R21 DA029244/DA/NIDA NIH HHS/United States
- R37 DA007242/DA/NIDA NIH HHS/United States
- R01 DA007242/DA/NIDA NIH HHS/United States
- DA06241/DA/NIDA NIH HHS/United States
- R01 DA002615/DA/NIDA NIH HHS/United States
- DA029244/DA/NIDA NIH HHS/United States
LinkOut - more resources
Full Text Sources
Other Literature Sources
Research Materials

