. 2015 Feb 3;112(3):504-13.
doi: 10.1038/bjc.2014.628. Epub 2014 Dec 23.

MRI reveals the in vivo cellular and vascular response to BEZ235 in ovarian cancer xenografts with different PI3-kinase pathway activity

Affiliations

MRI reveals the in vivo cellular and vascular response to BEZ235 in ovarian cancer xenografts with different PI3-kinase pathway activity

J Cebulla et al. Br J Cancer. .

Abstract

Background: The phosphoinositide-3 kinase (PI3K) pathway is an attractive therapeutic target. However, difficulty in predicting therapeutic response limits the clinical implementation of PI3K inhibitors. This study evaluates the utility of clinically relevant magnetic resonance imaging (MRI) biomarkers for noninvasively assessing the in vivo response to the dual PI3K/mTOR inhibitor BEZ235 in two ovarian cancer models with differential PI3K pathway activity.

Methods: The PI3K signalling activity of TOV-21G and TOV-112D human ovarian cancer cells was investigated in vitro. Cellular and vascular response of the xenografts to BEZ235 treatment (65 mg kg(-1), 3 days) was assessed in vivo using diffusion-weighted (DW) and dynamic contrast-enhanced (DCE)-MRI. Micro-computed tomography was performed to investigate changes in vascular morphology.

Results: The TOV-21G cells showed higher PI3K signalling activity than TOV-112D cells in vitro and in vivo. Treated TOV-21G xenografts decreased in volume and DW-MRI revealed an increased water diffusivity that was not found in TOV-112D xenografts. Treatment-induced improvement in vascular functionality was detected with DCE-MRI in both models. Changes in vascular morphology were not found.

Conclusions: Our results suggest that DW- and DCE-MRI can detect cellular and vascular response to PI3K/mTOR inhibition in vivo. However, only DW-MRI could discriminate between a strong and weak response to BEZ235.


Figures

Figure 1
Figure 1
Study design showing group sizes, treatment time points and imaging time points. (A) Magnetic resonance imaging (MRI) was performed for all mice on day 0 after which they were randomly assigned to treatment and control groups. The mice in the treatment group received 65 mg kg−1 BEZ235 on three consecutive days (‘Tx' indicates administration of drug). After the last treatment on day 3, the mice were imaged again using MRI after which they were killed and the tumours were excised for histology. (B) For μCT the mice were randomly assigned to treatment and control groups and treated in the same way as the mice that underwent MRI. After the treatment on day 3, the mice were perfused with Microfil and the tumours were harvested for ex vivo μCT.
Figure 2
Figure 2
Levels of activated Akt are elevated in TOV-21G cells and decrease in xenografts after BEZ235 treatment, whereas the levels are low in TOV-112D cells and unchanged in xenografts by treatment. (A) Immunoblots show that levels of pAkt (Ser473) are higher in cell extracts from untreated TOV-21G compared with TOV-112D. The level of β-actin served as a control for protein loading. (B) Levels of p-S6 (Ser 235/236) and total S6 in cell extracts from untreated cells are higher in TOV-21G cells compared with TOV-112D. Numbers indicate relative protein levels adjusted for loading. (C) Immunostaining of tissue sections shows that pAkt levels are lower in BEZ235-treated TOV-21G xenografts compared with controls. The TOV-112D cells have low levels in pAkt that are unchanged by treatment. Adjacent tumour sections for each tumour served as negative (neg.) controls and displayed a very low signal intensity. The scale bars represent 1 mm.
Figure 3
Figure 3
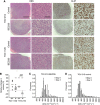
Immunohistochemistry and changes in tumour volume and ADC indicate a cellular response to treatment of the TOV-21G xenografts. (A) Haematoxylin–eosin–saffron (HES) staining of tumour sections visualises an overall lighter cytoplasmic stain for the treated TOV-21G xenograft compared with the  control, whereas there is no obvious difference between treated and control TOV-112D xenografts. In the high-magnification image, the tissue of the TOV-21G xenograft shows cytoplasmic vacuolisation and a looser structure than the control tissue. The Ki-67 staining of TOV-21G xenografts indicates that both cancer and stromal cells are highly proliferating. In treated xenografts, the fraction of proliferating cells appears markedly reduced. In TOV-112D xenografts, there is no conspicuous difference in the fraction of proliferating cells between treated and control xenografts. The images were taken at × 4 and × 40 magnification and the scale bars represent 1 mm and 0.1 mm, respectively. The × 40 fields were captured at ∼0.5 mm distance from the tumour rim. (B) Change in relative tumour volume for treatment (tx) and control (ctrl) groups of both TOV-21G and TOV-112D xenografts. (C and D) Pooled histograms of ADC values in the treatment and control TOV-21G groups for day 0 and day 3. Independent sample t-test BEZ235 vs control: ###P<0.001. Paired sample t-test day 0 vs day 3: **P<0.01.
Figure 4
Figure 4
Parametric maps of a TOV-21G and TOV-112D xenograft of the same animal before and after treatment. (AD) Anatomical images; (EH) ADC maps; (IL) ve maps; (MP) Ktrans maps; (Q and R) HES-stained sections matching the post-treatment MRI parametric maps. The maps show that ADC and ve increased throughout the tumour after treatment in the TOV-21G xenografts but not in TOV-112D xenografts. Ktrans did not change in either tumour.
Figure 5
Figure 5
Treated TOV-21G xenografts can be well separated from the control group based on changes in median ADC and ve. Change in median ve vs change in median ADC for control and treatment groups of TOV-21G and TOV-112D xenografts.
Figure 6
Figure 6
Treatment-induced increases in AUC1 min, FEV1 min and Ktrans indicate a change in vascular function in both TOV-21G and TOV-112D xenografts. (A) Change in AUC1 min, (B) change in FEV1 min and (C) change in Ktrans for treatment and control groups of both TOV-21G and TOV-112D xenografts. Independent sample t-test BEZ235 (Tx) vs control: #P<0.05, ##P<0.01. Paired sample t-test day 0 vs day 3: *P<0.05.
Figure 7
Figure 7
Data on vascular morphology derived from μCT showing no significant differences in vascular morphology between treated and control groups. (AD) Mean values±s.d. of FBV, mean vessel density, median vessel length and median radius for treated and untreated TOV-112D (n=3 each) and TOV-21G (n=4 each) xenografts. (E) Maximum intensity projection of a 2-mm-thick tumour slice of the raw μCT data of a TOV-112D xenograft.

References

    1. Banerjee S, Kaye SB. New strategies in the treatment of ovarian cancer: current clinical perspectives and future potential. Clin Cancer Res. 2013;19:961–968. - PubMed
    1. Beloueche-Babari M, Jamin Y, Arunan V, Walker-Samuel S, Revill M, Smith PD, Halliday J, Waterton JC, Barjat H, Workman P, Leach MO, Robinson SP. Acute tumour response to the MEK1/2 inhibitor selumetinib (AZD6244, ARRY-142886) evaluated by non-invasive diffusion-weighted MRI. Br J Cancer. 2013;109:1562–1569. - PMC - PubMed
    1. Brachmann SM, Hofmann I, Schnell C, Fritsch C, Wee S, Lane H, Wang S, Garcia-Echeverria C, Maira SM. Specific apoptosis induction by the dual PI3K/mTor inhibitor NVP-BEZ235 in HER2 amplified and PIK3CA mutant breast cancer cells. Proc Natl Acad Sci USA. 2009;106:22299–22304. - PMC - PubMed
    1. Brader S, Eccles SA. Phosphoinositide 3-kinase signalling pathways in tumor progression, invasion and angiogenesis. Tumori. 2004;90:2–8. - PubMed
    1. Carden CP, Stewart A, Thavasu P, Kipps E, Pope L, Crespo M, Miranda S, Attard G, Garrett MD, Clarke PA, Workman P, de Bono JS, Gore M, Kaye SB, Banerji U. The association of PI3 kinase signaling and chemoresistance in advanced ovarian cancer. Mol Cancer Ther. 2012;11:1609–1617. - PMC - PubMed

Publication types

MeSH terms