

Exploratory comparison of vaginal glycogen and Lactobacillus levels in premenopausal and postmenopausal women
- PMID: 25535963
- PMCID: PMC4476965
- DOI: 10.1097/GME.0000000000000397
Exploratory comparison of vaginal glycogen and Lactobacillus levels in premenopausal and postmenopausal women
Abstract
Objective: Previous studies have suggested that glycogen expression in the vaginal epithelium decreases during menopause, resulting in reduced levels of lactobacilli. However, free glycogen in genital fluids and its relationship with Lactobacillus levels have not been compared in premenopausal and postmenopausal women.
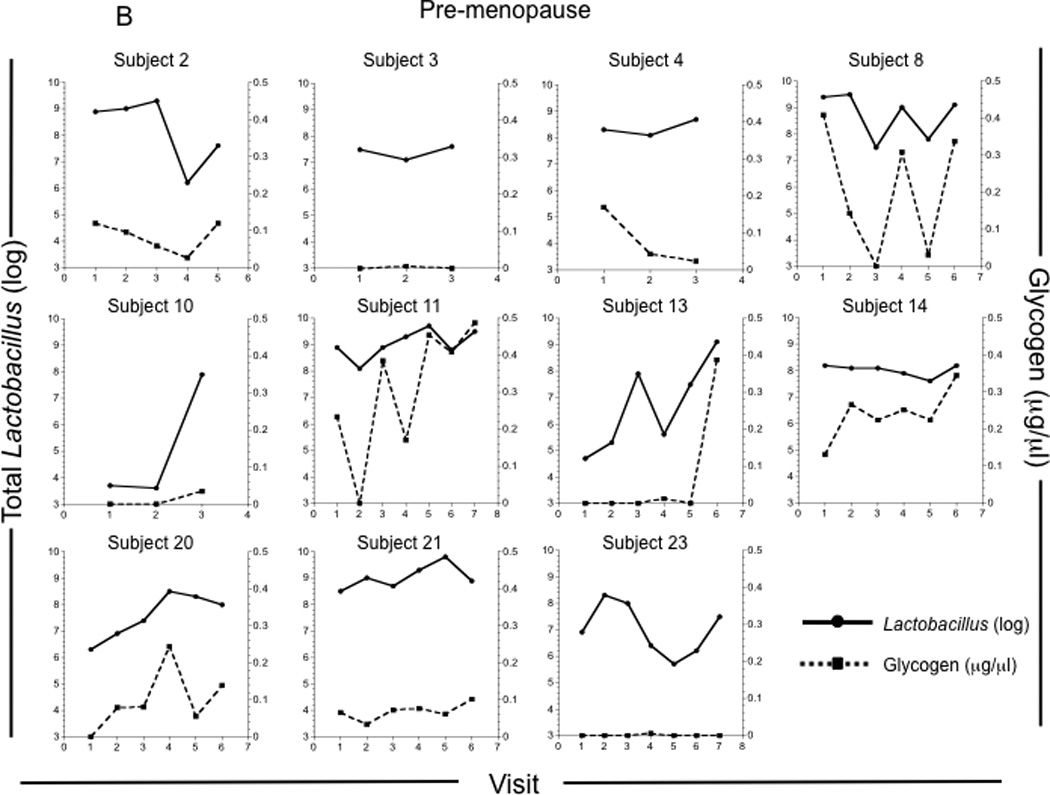
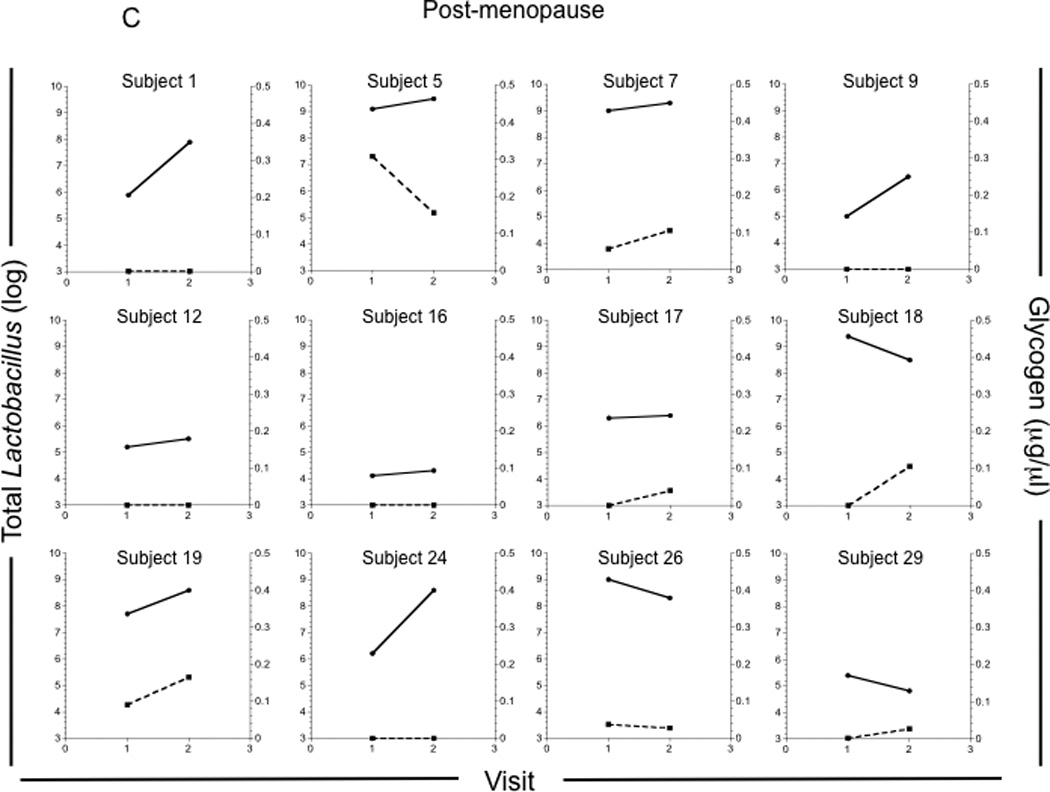
Methods: Eighty-two cervicovaginal lavage samples were collected at different phases of the menstrual cycle from 11 premenopausal (4 HIV-uninfected and 7 HIV-infected) and 12 postmenopausal (7 HIV-uninfected and 5 HIV-infected) women during a 1- to 3-month period. Free glycogen was quantified in genital fluids. Lactobacillus levels were quantified by real-time polymerase chain reaction. Estrogen and progesterone levels in blood were determined by enzyme-linked immunosorbent assay.
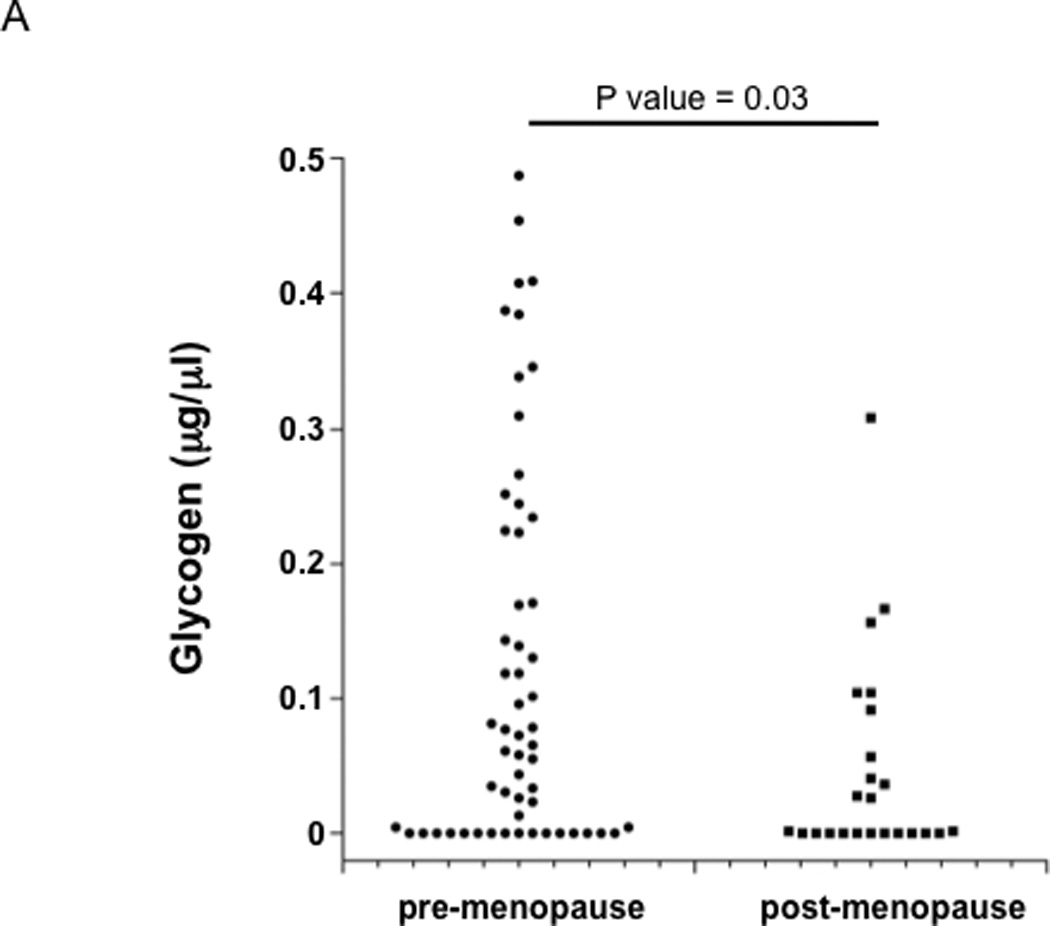
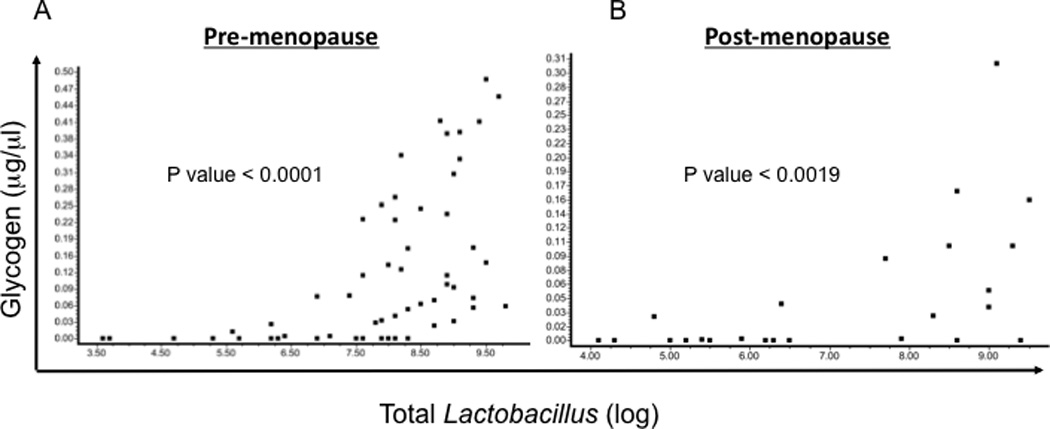
Results: Free glycogen was detected in both premenopausal and postmenopausal women. Across all samples, those from postmenopausal women had significantly lower levels of free glycogen than those from premenopausal women (median, 0.002 vs 0.065 μg/μL, respectively; P = 0.03). Lactobacillus levels correlated positively with free glycogen in both premenopausal (Spearman r = 0.68, P < 0.0001) and postmenopausal (r = 0.60, P < 0.002) women. Samples from premenopausal women had higher Lactobacillus levels and lower vaginal pH (median log, 8.1; median pH, 4) than those from postmenopausal women (median log, 7.1; median pH, 4.6), although these differences were not significant. HIV status had no significant effect on these relationships.
Conclusions: Free glycogen is detected in both premenopausal and postmenopausal women and correlates with Lactobacillus in both groups. These results point to the complexity of the relationship between menopause and vaginal microbiota and indicate that more careful studies of the role of glycogen are warranted.
Conflict of interest statement
Figures
Comment in
-
A spoonful of sugar.Menopause. 2015 Jul;22(7):689-90. doi: 10.1097/GME.0000000000000483. Menopause. 2015. PMID: 25988801 No abstract available.
References
-
- Sha BE, Zariffard MR, Wang QJ, et al. Female genital-tract HIV load correlates inversely with Lactobacillus species but positively with bacterial vaginosis and Mycoplasma hominis. J Infect Dis. 2005;191(1):25–32. - PubMed
-
- Cu-Uvin S, Hogan JW, Caliendo AM, Harwell J, Mayer KH, Carpenter CC. Association between bacterial vaginosis and expression of human immunodeficiency virus type 1 RNA in the female genital tract. Clin Infect Dis. 2001;33(6):894–896. - PubMed
Publication types
MeSH terms
Substances
Grants and funding
LinkOut - more resources
Full Text Sources
