. 2014 Dec 23;9(12):e114585.
doi: 10.1371/journal.pone.0114585. eCollection 2014.

MicroRNA-503 acts as a tumor suppressor in osteosarcoma by targeting L1CAM

Affiliations

MicroRNA-503 acts as a tumor suppressor in osteosarcoma by targeting L1CAM

Yang Chong et al. PLoS One. .

Retraction in

Abstract

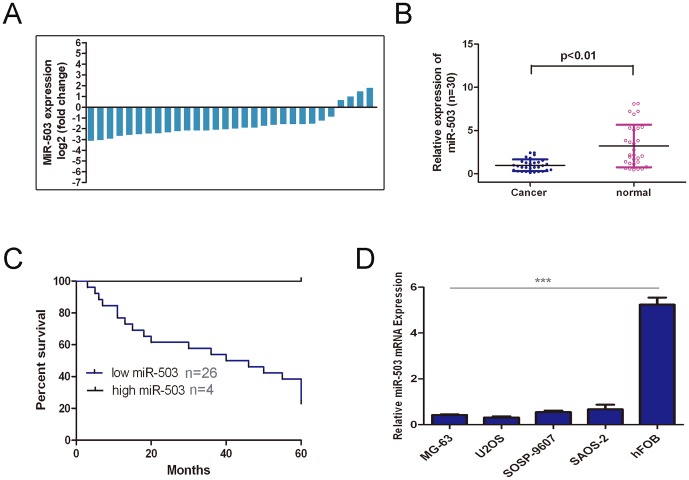
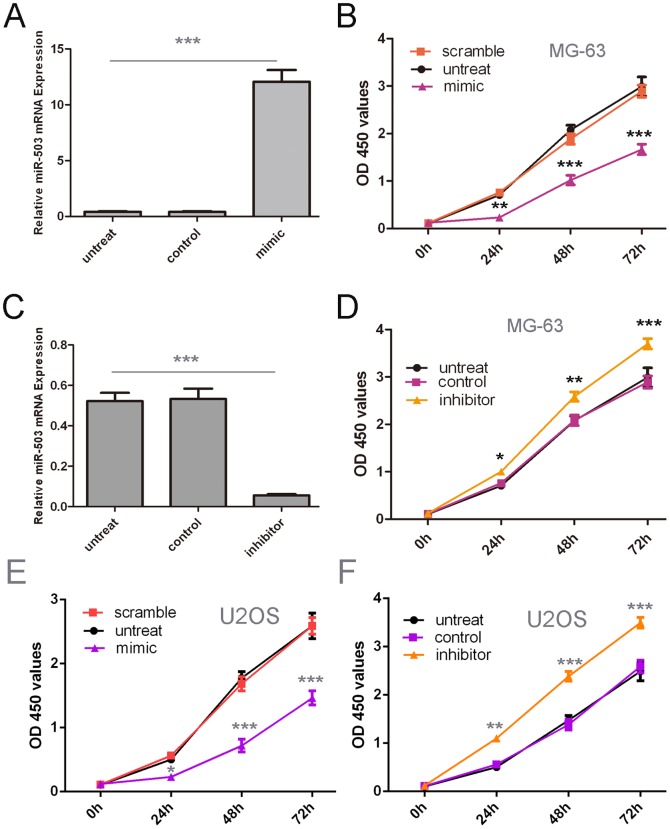
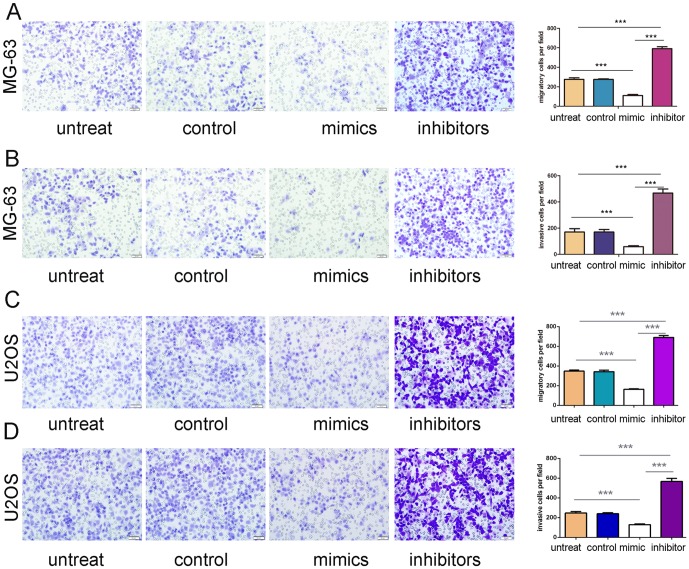
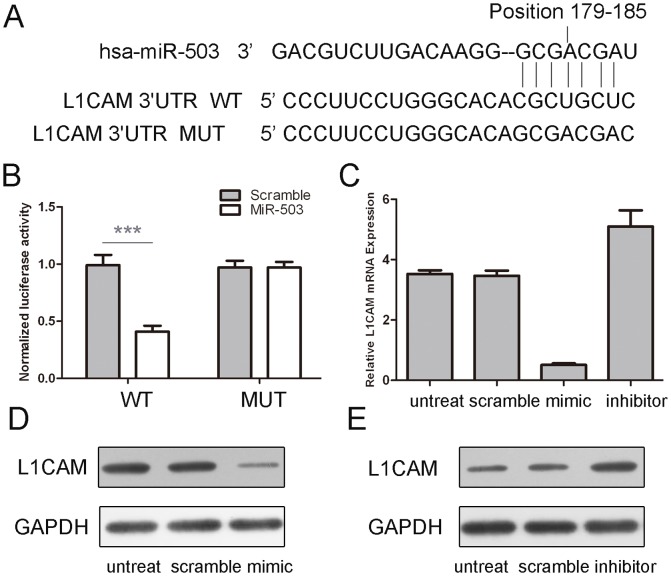
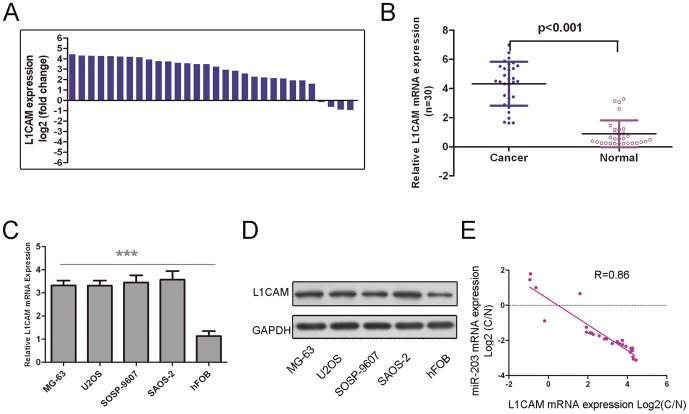
Deregulated microRNAs and their roles in tumorigenesis have attracted much attention in recent years. Although miR-503 was shown to be important in tumorigenesis, its role in osteosarcoma remains unknown. In this study, we focused on the expression and mechanisms of miR-503 in osteosarcoma development. We found that miR-503 was down-regulated in osteosarcoma cell lines and primary tumor samples, and the restoration of miR-503 reduced cell proliferation, migration and invasion. Low level of miR-503 in patients with osteosarcoma was associated with considerably shortened disease-free survival. Furthermore, bioinformatic prediction and experimental validation revealed that the anti-tumor effect of miR-503 was probably exerted through targeting and repressing of L1CAM expression. L1CAM was up-regulated in osteosarcoma cell lines and primary tumor samples and the expression level of L1CAM were negatively correlated with miR-503 levels in osteosarcoma tissues. Collectively, our data identify the important roles of miR-503 in osteosarcoma pathogenesis, indicating its potential application in cancer therapy.


Conflict of interest statement

Competing Interests: The authors have declared that no competing interests exist.

Figures

Figure 1
Figure 1. The expression of miR-503 was down-regulated in osteosarcoma (A)qRT-PCR analysis of miR-503 expression in 30 pair'sosteosarcoma tissues and their corresponding adjacent normal tissues.
The expression of miR-503 was normalized to U6 snRNA. (B) Relative miR-503expressionlevels inosteosarcoma tissues and their corresponding adjacent normal tissues. (C) Loss of miR-503 levels in patients with osteosarcoma was associated with associated with considerably shortened disease-free survival. (D) The relative expression levels were determined by qRT-PCR in Human osteosarcoma cell lines (MG-63, U2OS, SOSP-9607, and SAOS-2)and hFOB. ***p<0.001.
Figure 2
Figure 2. Overexpression of miR-503inhibited proliferation of osteosarcoma cells.
(A) qRT-PCR analysis of miR-503 expression after the transfection of miR-503 mimics or scramble or no transfection. (B) The CCK8 assay used to evalute the proliferation of theMG-63 cells after transfection with the miR-503 mimics or scramble or no transfection. (C) RT-PCR analysis of miR-503 expression after the transfection of miR-503inhibitor or control or no transfection. (D) The CCK8 assay used to evalute the proliferation of theMG-63 cells after transfection with the miR-503 inhibitor or control or no transfection. (E) The CCK8 assay used to evalute the proliferation of theU2OScells after transfection with the miR-503 mimics or scramble or no transfection. (F)The CCK8 assay used to evalute the proliferation of theU2OScells after transfection with the miR-503 inhibitor or control or no transfection, *p<0.05, ** p<0.01, and ***p<0.001.
Figure 3
Figure 3. Overexpression of miR-503inhibitedmigration and invasion of osteosarcoma cells.
(A) Migration assays of the MG-63cells after treatment with miRNA mimics, inhibitors or scramble or no transfection; the relative ratio of migratory cells per field is shown on the right. (B) Invasion analysis of the MG-63 cells after treatment withmiRNA mimics, inhibitors or scramble or no transfection; the relative ratio of invasive cells per field is shownon the right. (C) Migration assays of the U2OScells after treatment with miRNA mimics, inhibitors or scramble or no transfection; the relative ratio of migratory cells per field is shown on the right. (D) Invasion analysis of the U2OScells after treatment withmiRNA mimics, inhibitors or scramble or no transfection; the relative ratio of invasive cells per field is shownon the right, *p<0.05, ** p<0.01, and ***p<0.001.
Figure 4
Figure 4. miR-503 targeted L1CAM in osteosarcoma cells.
(A) The sequences of miR-503 binding sites within the human L1CAM 3'UTRs and schematic reporter constructs, in this panel, L1CAM -WT represent the reporter constructs containing the entire 3'UTR sequences of L1CAM. L1CAM -MUT represent the reporter constructs containing mutated nucleotides. (B) The analysis of the relative luciferase activities of L1CAM -WT, L1CAM -MUT. The error bars are derived from triplicate expriments. (C) qRT-PCR analysis of L1CAM mRNA expression in the Mg-63 cells after treatment withmiRNA mimics or scramble or no transfection. The expression of L1CAM was normalized to GAPDH. (D) Western blot analysis ofL1CAM expression in the MG-63 cells transfected with miR-503mimics or scramble or no transfection. GAPDH was also detected as a loading control.***p<0.001.
Figure 5
Figure 5. L1CAM was inversely expressed with miR-503 in osteosarcoma (A) qRT-PCR analysis of L1CAM expression in 30 pair's osteosarcoma tissues and their corresponding adjacent normal tissues.
The expression of L1CAM was normalized to GAPDH. (B) Relative L1CAMexpressionlevels inosteosarcoma tissues and their corresponding adjacent normal tissues.(C) The L1CAM relative mRNA expression levels were determined by qRT-PCR in Human osteosarcoma cell lines (MG-63, U2OS, SOSP-9607, and SAOS-2)) and hFOB. (D) Western blot analysis ofL1CAM expression in Human osteosarcoma cell lines (MG-63, U2OS, SOSP-9607, and SAOS-2)and hFOB. (D) Analysis of correlation of miR-503 and L1CAM expression in osteosarcoma tissues. (Two-tailed Pearson's correlation analysis, r = −0.86; p<0.01, n = 30). Data was presented as log 2 of fold change of osteosarcoma tissues relative to non-tumor adjacent tissues.***p<0.001.

References

    1. Rainusso N, Wang LL, Yustein JT (2013) The adolescent and young adult with cancer: state of the art — bone tumors. Curr Oncol Rep 15:296–307. - PubMed
    1. Long XH, Mao JH, Peng AF, Zhou Y, Huang SH, et al. (2013) Tumor suppressive microRNA-424 inhibits osteosarcoma cell migration and invasion via targeting fatty acid synthase. Exp Ther Med 5:1048–1052. - PMC - PubMed
    1. Yang J, Zhang W (2013) New molecular insights into osteosarcoma targeted therapy. Curr Opin Oncol 25:398–406. - PubMed
    1. Hughes DP (2009) How the NOTCH pathway contributes to the ability of osteosarcoma cells to metastasize. Cancer Treat Res 152:479–496. - PubMed
    1. Liang W, Gao B, Fu P, Xu S, Qian Y, et al. (2013) The miRNAs in the pathgenesis of osteosarcoma. Front Biosci (Landmark Ed) 18:788–794. - PubMed

Publication types

LinkOut - more resources