

Characterisation of cyanobacterial bicarbonate transporters in E. coli shows that SbtA homologs are functional in this heterologous expression system
- PMID: 25536191
- PMCID: PMC4275256
- DOI: 10.1371/journal.pone.0115905
Characterisation of cyanobacterial bicarbonate transporters in E. coli shows that SbtA homologs are functional in this heterologous expression system
Abstract
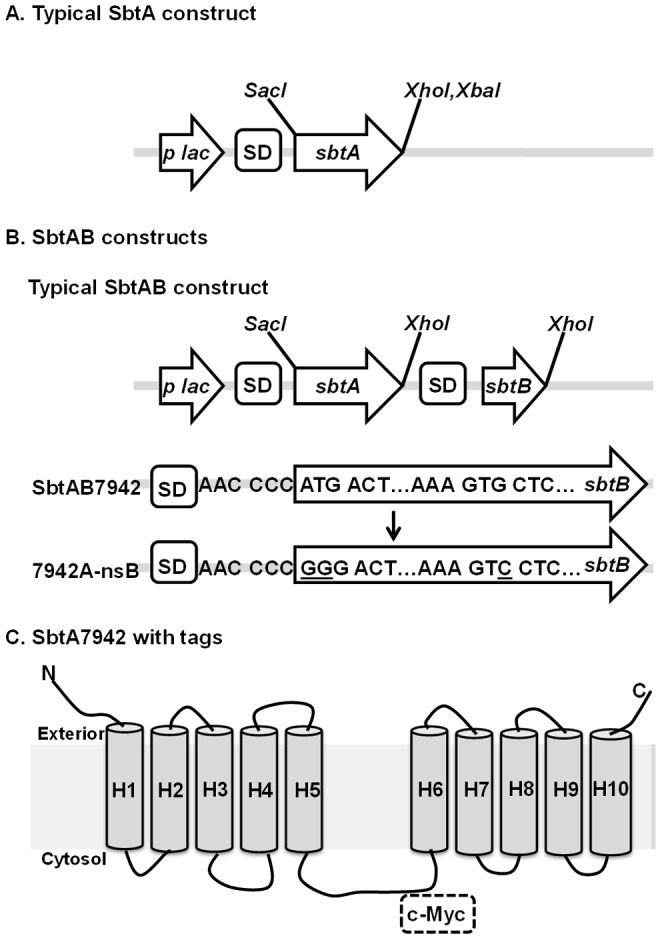
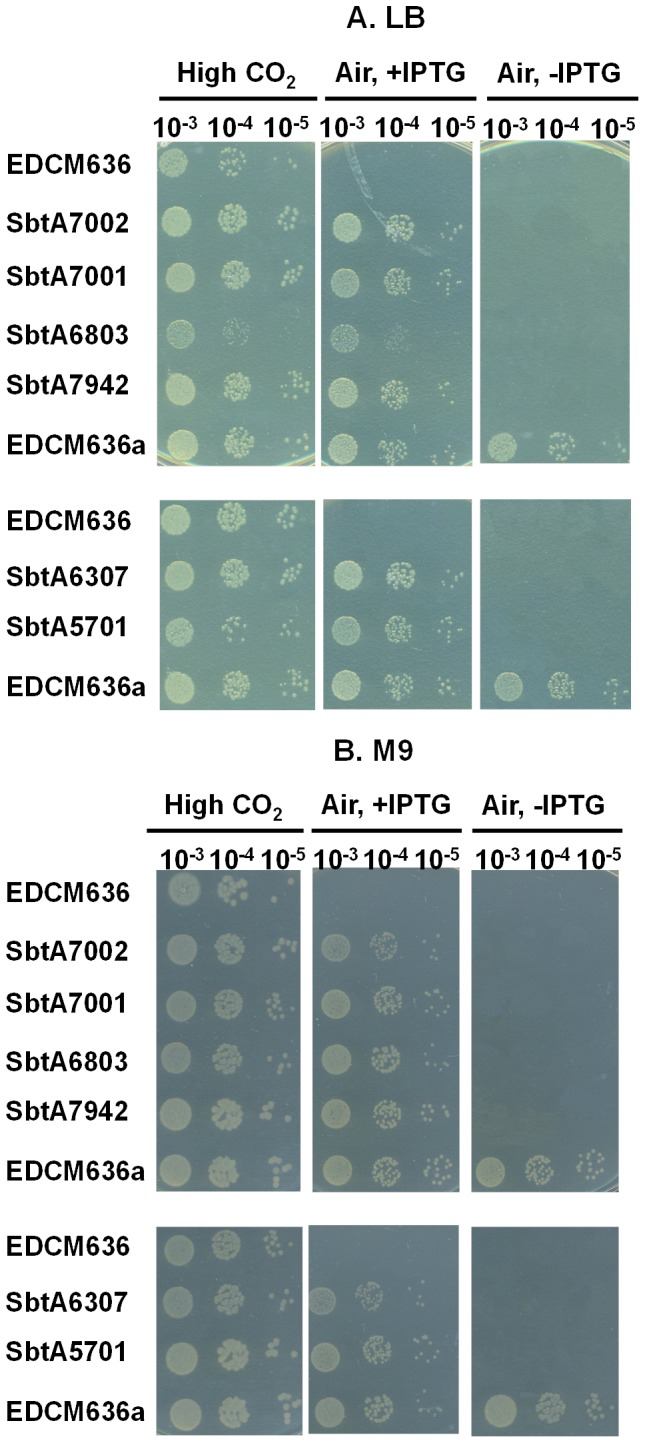
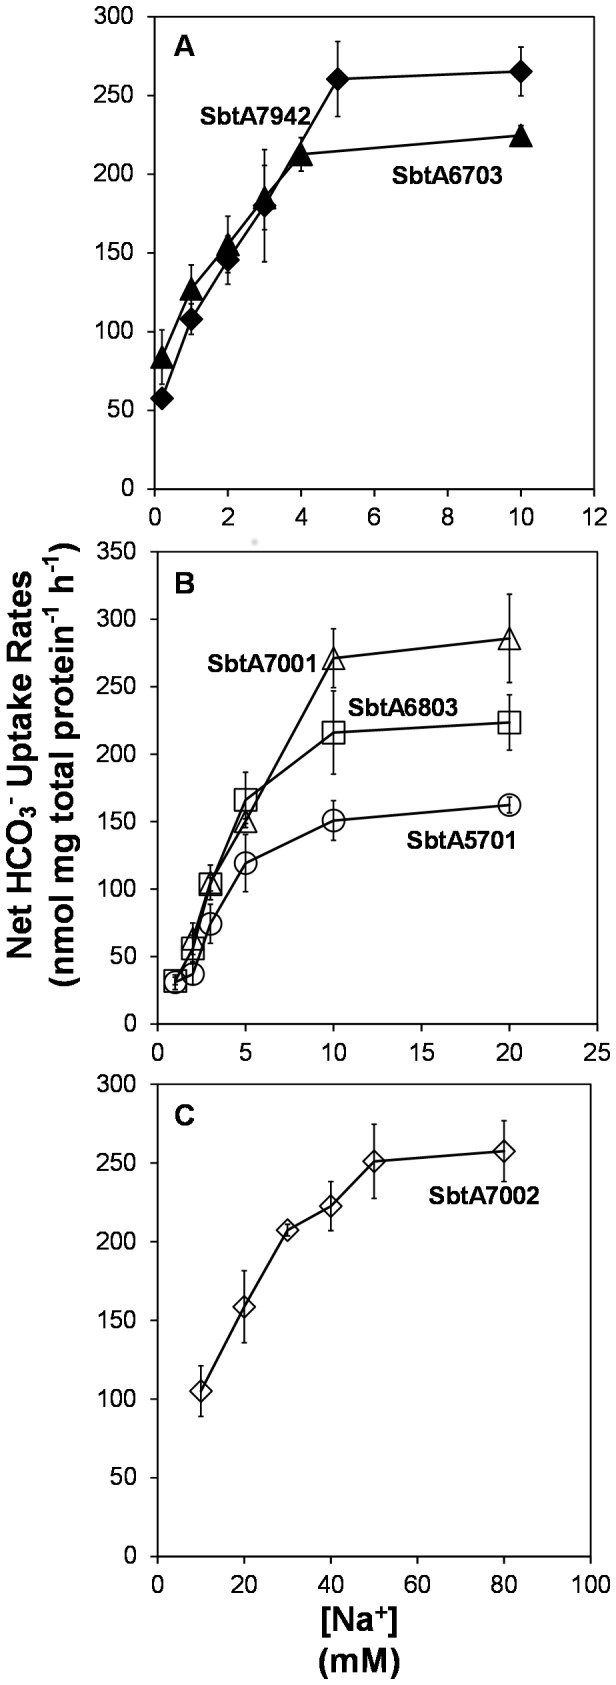
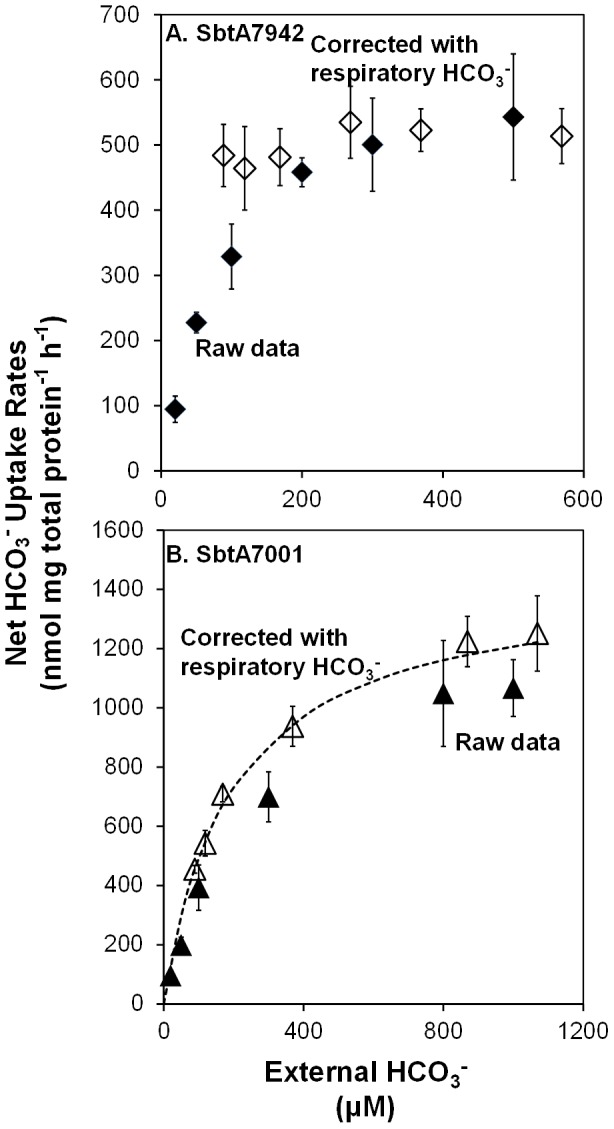
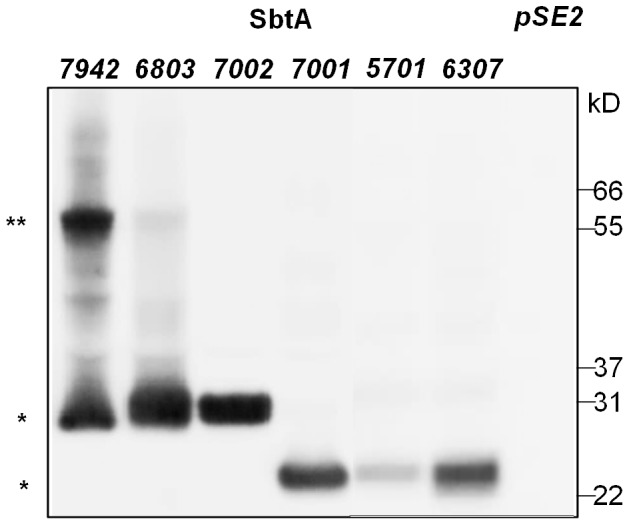
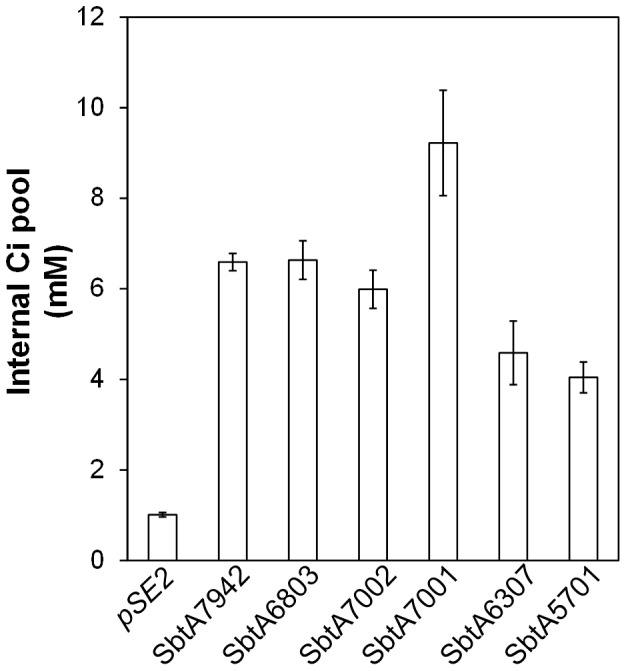
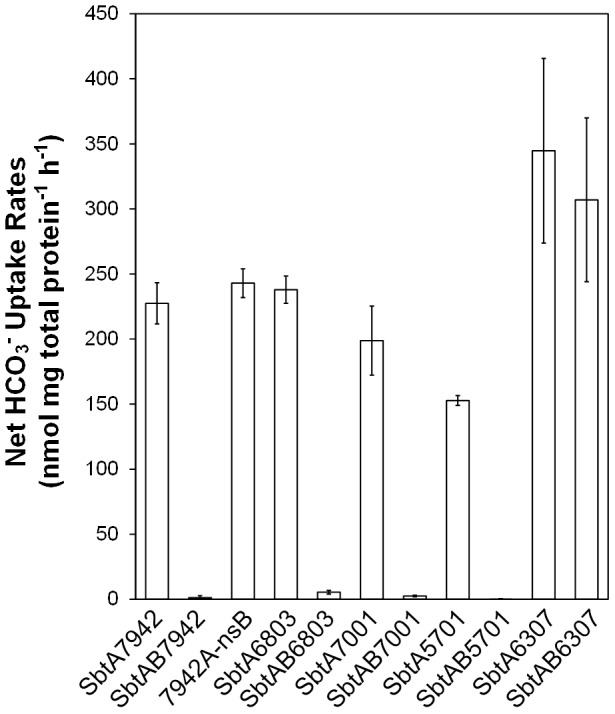
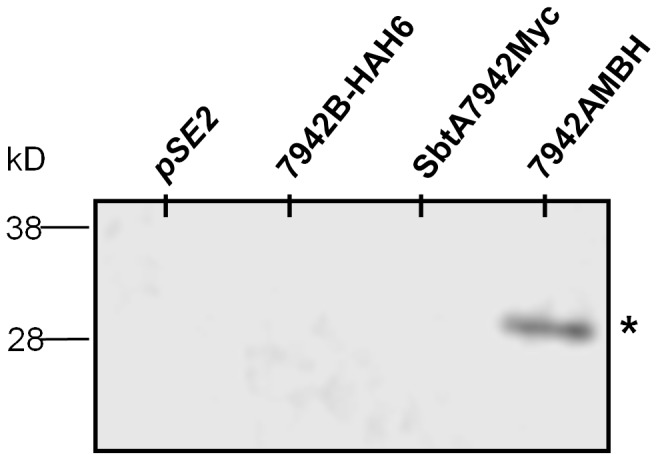
Cyanobacterial HCO3(-) transporters BCT1, SbtA and BicA are important components of cyanobacterial CO2-concentration mechanisms. They also show potential in applications aimed at improving photosynthetic rates and yield when expressed in the chloroplasts of C3 crop species. The present study investigated the feasibility of using Escherichia coli to assess function of a range of SbtA and BicA transporters in a heterologous expression system, ultimately for selection of transporters suitable for chloroplast expression. Here, we demonstrate that six β-forms of SbtA are active in E. coli, although other tested bicarbonate transporters were inactive. The sbtA clones were derived from Synechococcus sp. WH5701, Cyanobium sp. PCC7001, Cyanobium sp. PCC6307, Synechococcus elongatus PCC7942, Synechocystis sp. PCC6803, and Synechococcus sp. PCC7002. The six SbtA homologs varied in bicarbonate uptake kinetics and sodium requirements in E. coli. In particular, SbtA from PCC7001 showed the lowest uptake affinity and highest flux rate and was capable of increasing the internal inorganic carbon pool by more than 8 mM relative to controls lacking transporters. Importantly, we were able to show that the SbtB protein (encoded by a companion gene near sbtA) binds to SbtA and suppresses bicarbonate uptake function of SbtA in E. coli, suggesting a role in post-translational regulation of SbtA, possibly as an inhibitor in the dark. This study established E. coli as a heterologous expression and analysis system for HCO3(-) transporters from cyanobacteria, and identified several SbtA transporters as useful for expression in the chloroplast inner envelope membranes of higher plants.
Conflict of interest statement
Figures
Similar articles
-
Structural Basis for the Allosteric Regulation of the SbtA Bicarbonate Transporter by the PII-like Protein, SbtB, from Cyanobium sp. PCC7001.Biochemistry. 2019 Dec 17;58(50):5030-5039. doi: 10.1021/acs.biochem.9b00880. Epub 2019 Dec 3. Biochemistry. 2019. PMID: 31746199
-
Transplastomic integration of a cyanobacterial bicarbonate transporter into tobacco chloroplasts.J Exp Bot. 2014 Jul;65(12):3071-80. doi: 10.1093/jxb/eru156. Epub 2014 Apr 18. J Exp Bot. 2014. PMID: 24965541 Free PMC article.
-
Specific and Efficient Targeting of Cyanobacterial Bicarbonate Transporters to the Inner Envelope Membrane of Chloroplasts in Arabidopsis.Front Plant Sci. 2016 Feb 2;7:16. doi: 10.3389/fpls.2016.00016. eCollection 2016. Front Plant Sci. 2016. PMID: 26870048 Free PMC article.
-
Topology mapping to characterize cyanobacterial bicarbonate transporters: BicA (SulP/SLC26 family) and SbtA.Mol Membr Biol. 2014 Sep;31(6):177-82. doi: 10.3109/09687688.2014.953222. Mol Membr Biol. 2014. PMID: 25222859 Review.
-
The cyanobacterial CCM as a source of genes for improving photosynthetic CO2 fixation in crop species.J Exp Bot. 2013 Jan;64(3):753-68. doi: 10.1093/jxb/ers257. Epub 2012 Oct 1. J Exp Bot. 2013. PMID: 23028015 Review.
Cited by
-
Tetragonal crystal form of the cyanobacterial bicarbonate-transporter regulator SbtB from Synechocystis sp. PCC 6803.Acta Crystallogr F Struct Biol Commun. 2020 Sep 1;76(Pt 9):438-443. doi: 10.1107/S2053230X20010523. Epub 2020 Aug 19. Acta Crystallogr F Struct Biol Commun. 2020. PMID: 32880592 Free PMC article.
-
Synthetic Genetic Elements Enable Rapid Characterization of Inorganic Carbon Uptake Systems in Cupriavidus necator H16.ACS Synth Biol. 2025 Mar 21;14(3):943-953. doi: 10.1021/acssynbio.4c00869. Epub 2025 Mar 6. ACS Synth Biol. 2025. PMID: 40048245
-
Phosphoproteome of the cyanobacterium Synechocystis sp. PCC 6803 and its dynamics during nitrogen starvation.Front Microbiol. 2015 Mar 31;6:248. doi: 10.3389/fmicb.2015.00248. eCollection 2015. Front Microbiol. 2015. PMID: 25873915 Free PMC article.
-
The Freshwater Cyanobacterium Synechococcus elongatus PCC 7942 Does Not Require an Active External Carbonic Anhydrase.Plants (Basel). 2024 Aug 20;13(16):2323. doi: 10.3390/plants13162323. Plants (Basel). 2024. PMID: 39204759 Free PMC article.
-
Engineering the cyanobacterial ATP-driven BCT1 bicarbonate transporter for functional targeting to C3 plant chloroplasts.J Exp Bot. 2024 Aug 28;75(16):4926-4943. doi: 10.1093/jxb/erae234. J Exp Bot. 2024. PMID: 38776254 Free PMC article.
References
-
- Zhu X-G, Long SP, Ort DR (2010) Improving Photosynthetic Efficiency for Greater Yield. Ann Rev Plant Biol 61:235–261. - PubMed
-
- Kimball BA, Kobayashi K, Bindi M (2002) Responses of Agricultural Crops to Free-Air CO2 Enrichment. In: Donald LS, editor. Advances in Agronomy: Academic Press. pp. 293–368.
-
- Long SP, Zhu X-G, Naidu SL, Ort DR (2006) Can improvement in photosynthesis increase crop yields? Plant Cell Environ 29:315–330. - PubMed
Publication types
MeSH terms
Substances
LinkOut - more resources
Full Text Sources
Other Literature Sources
Molecular Biology Databases
Miscellaneous
