

Folate receptor-targeted multimodality imaging of ovarian cancer in a novel syngeneic mouse model
- PMID: 25536192
- PMCID: PMC4319688
- DOI: 10.1021/mp500628g
Folate receptor-targeted multimodality imaging of ovarian cancer in a novel syngeneic mouse model
Abstract
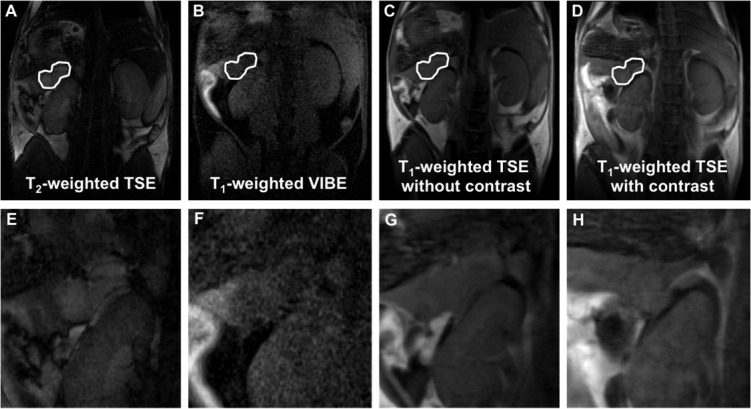
A new transplantable ovarian tumor model is presented using a novel folate receptor (FR) positive, murine ovarian cancer cell line that emulates the human disease and induces widespread intraperitoneal (i.p.) tumors in immunocompetent mice within 4-8 weeks of implantation. Tumor development was monitored using a new positron emission tomography (PET) FR-targeting reporter with PET/computerized tomography (PET/CT) and fluorescence molecular tomography (FMT) using a commercial FR-targeting reporter. Conventional structural magnetic resonance imaging (MRI) was also performed. Adult female C57BL/6 mice were injected i.p. with 6 × 10(6) MKP-L FR+ cells. Imaging was performed weekly beginning 2 weeks after tumor induction. The albumin-binding, FR-targeting ligand cm09 was radiolabeled with the positron emitter (68)Ga and used to image the tumors with a small animal PET/CT. The FR-reporter FolateRSense 680 (PerkinElmer) was used for FMT and flow cytometry. Preclinical MRI (7 T) without FR-targeting was compared with the PET and FMT molecular imaging. Tumors were visible by all three imaging modalities. PET/CT had the highest imaging sensitivity at 3-3.5 h postadministration (mean %IA/g mean > 6) and visualized tumors earlier than the other two modalities with lower kidney uptake (mean %IA/g mean < 17) than previously reported FR-targeting agents in late stage disease. FMT showed relatively low FR-targeted agent in the bladder and kidneys, but yielded the lowest anatomical image resolution. MRI produced the highest resolution images, but it was difficult to distinguish tumors from abdominal organs during early progression since a FR-targeting MRI reporter was not used. Nevertheless, there was good correlation of imaging biomarkers between the three modalities. Tumors in the mouse ovarian cancer model could be detected using FR-targeted imaging as early as 2 weeks post i.p. injection of tumor cells. An imaging protocol should combine one or more of the modalities, e.g., PET/CT or PET/MRI for optimal tumor detection and delineation from surrounding tissues.
Keywords: 68Ga; FolateRSense; MRI; PET/CT; cm09; fluorescence molecular tomography; folate receptor targeting; immunocompetent ovarian cancer mouse model.
Figures


Similar articles
-
In vivo imaging of folate receptor positive tumor xenografts using novel 68Ga-NODAGA-folate conjugates.Mol Pharm. 2012 May 7;9(5):1136-45. doi: 10.1021/mp200418f. Epub 2012 Apr 23. Mol Pharm. 2012. PMID: 22497506
-
Pemetrexed improves tumor selectivity of 111In-DTPA-folate in mice with folate receptor-positive ovarian cancer.J Nucl Med. 2008 Apr;49(4):623-9. doi: 10.2967/jnumed.107.047704. Epub 2008 Mar 14. J Nucl Med. 2008. PMID: 18344429
-
Synthesis and Preclinical Evaluation of Folate-NOTA-Al(18)F for PET Imaging of Folate-Receptor-Positive Tumors.Mol Pharm. 2016 May 2;13(5):1520-7. doi: 10.1021/acs.molpharmaceut.5b00989. Epub 2016 Apr 18. Mol Pharm. 2016. PMID: 27054811 Free PMC article.
-
[149/152/155/161Tb]-Labeled DOTA-folate conjugated to an albumin-binding entity.2012 Dec 3 [updated 2012 Dec 27]. In: Molecular Imaging and Contrast Agent Database (MICAD) [Internet]. Bethesda (MD): National Center for Biotechnology Information (US); 2004–2013. 2012 Dec 3 [updated 2012 Dec 27]. In: Molecular Imaging and Contrast Agent Database (MICAD) [Internet]. Bethesda (MD): National Center for Biotechnology Information (US); 2004–2013. PMID: 23285495 Free Books & Documents. Review.
-
Imaging the folate receptor on cancer cells with 99mTc-etarfolatide: properties, clinical use, and future potential of folate receptor imaging.J Nucl Med. 2014 May;55(5):701-4. doi: 10.2967/jnumed.113.133074. Epub 2014 Apr 14. J Nucl Med. 2014. PMID: 24732155 Review.
Cited by
-
PROTACs: great opportunities for academia and industry (an update from 2020 to 2021).Signal Transduct Target Ther. 2022 Jun 9;7(1):181. doi: 10.1038/s41392-022-00999-9. Signal Transduct Target Ther. 2022. PMID: 35680848 Free PMC article. Review.
-
Discovery of Furanone-Based Radiopharmaceuticals for Diagnostic Targeting of COX-1 in Ovarian Cancer.ACS Omega. 2019 May 31;4(5):9251-9261. doi: 10.1021/acsomega.9b01093. Epub 2019 May 24. ACS Omega. 2019. PMID: 31172046 Free PMC article.
-
Nanomaterial-Enabled Cancer Therapy.Mol Ther. 2017 Jul 5;25(7):1501-1513. doi: 10.1016/j.ymthe.2017.04.026. Epub 2017 May 19. Mol Ther. 2017. PMID: 28532763 Free PMC article. Review.
-
Fluorescent Polymer Dots for Tracking SKOV3 Cells in Living Mice with Probe-Based Confocal Laser Endomicroscopy.Mol Imaging Biol. 2019 Dec;21(6):1026-1033. doi: 10.1007/s11307-019-01343-4. Mol Imaging Biol. 2019. PMID: 30877592
-
Multimodal molecular 3D imaging for the tumoral volumetric distribution assessment of folate-based biosensors.Med Biol Eng Comput. 2018 Jul;56(7):1135-1148. doi: 10.1007/s11517-017-1755-2. Epub 2017 Dec 1. Med Biol Eng Comput. 2018. PMID: 29192382
References
-
- Roby K. F.; Taylor C. C.; Sweetwood J. P.; Cheng Y.; Pace J. L.; Tawfik O.; Persons D. L.; Smith P. G.; Terranova P. F. Development of a syngeneic mouse model for events related to ovarian cancer. Carcinogenesis 2000, 214585–91. - PubMed
Publication types
MeSH terms
Substances
Grants and funding
LinkOut - more resources
Full Text Sources
Other Literature Sources
Medical
