

Cause-specific risk of hospital admission related to extreme heat in older adults
- PMID: 25536257
- PMCID: PMC4319792
- DOI: 10.1001/jama.2014.15715
Cause-specific risk of hospital admission related to extreme heat in older adults
Abstract
Importance: Heat exposure is known to have a complex set of physiological effects on multiple organ systems, but current understanding of the health effects is mostly based on studies investigating a small number of prespecified health outcomes such as cardiovascular and respiratory diseases.
Objectives: To identify possible causes of hospital admissions during extreme heat events and to estimate their risks using historical data.
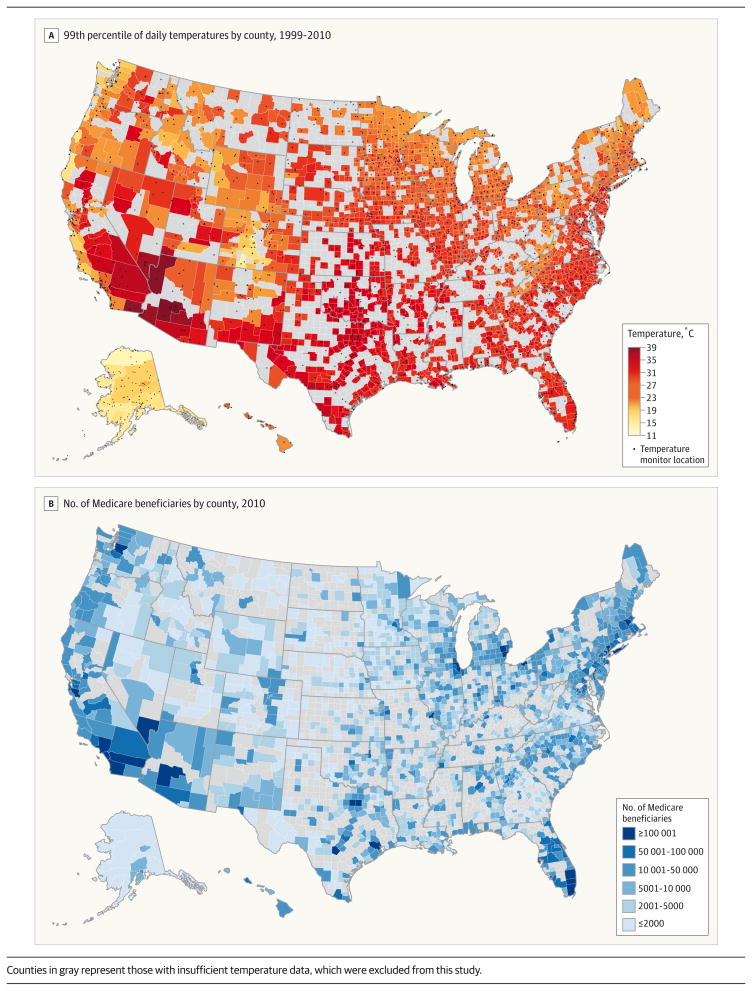
Design, setting, and population: Matched analysis of time series data describing daily hospital admissions of Medicare enrollees (23.7 million fee-for-service beneficiaries [aged ≥65 years] per year; 85% of all Medicare enrollees) for the period 1999 to 2010 in 1943 counties in the United States with at least 5 summers of near-complete (>95%) daily temperature data.
Exposures: Heat wave periods, defined as 2 or more consecutive days with temperatures exceeding the 99th percentile of county-specific daily temperatures, matched to non-heat wave periods by county and week.
Main outcomes and measures: Daily cause-specific hospitalization rates by principal discharge diagnosis codes, grouped into 283 disease categories using a validated approach.
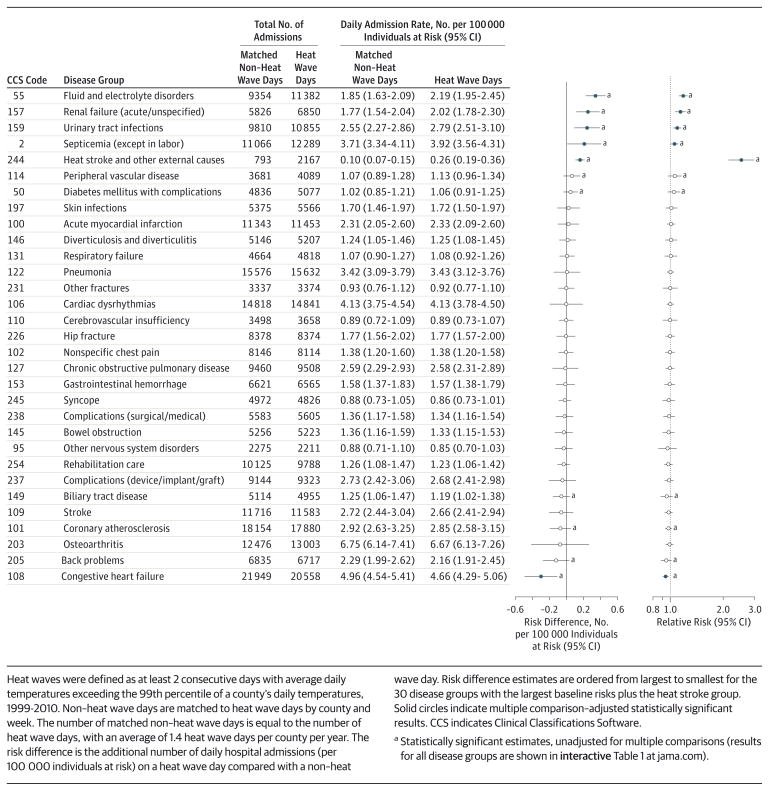
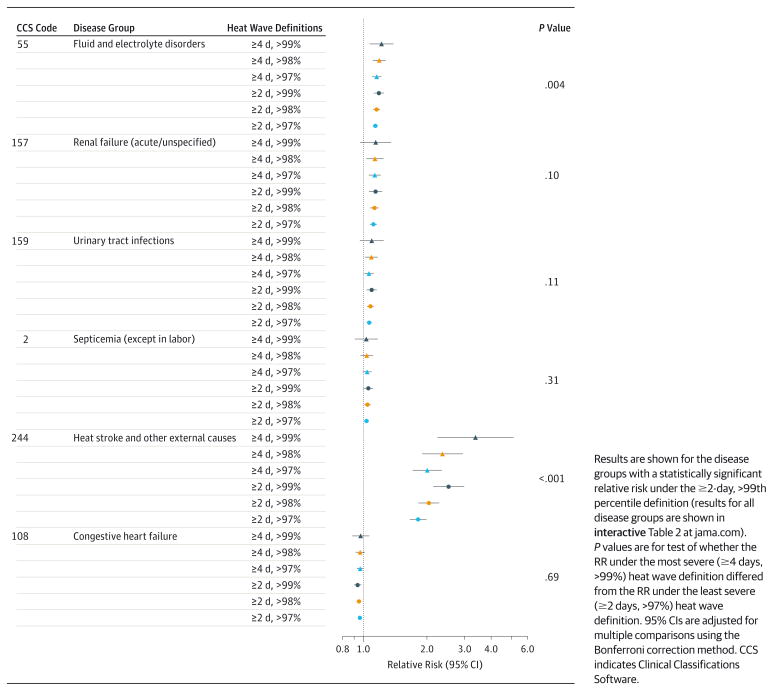
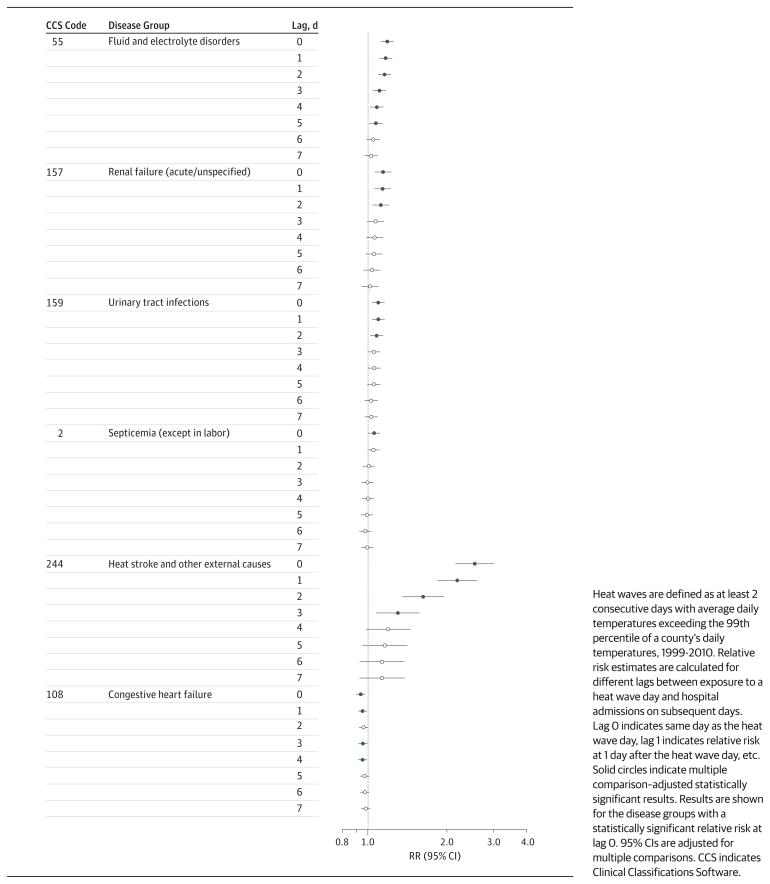
Results: Risks of hospitalization for fluid and electrolyte disorders, renal failure, urinary tract infection, septicemia, and heat stroke were statistically significantly higher on heat wave days relative to matched non-heat wave days, but risk of hospitalization for congestive heart failure was lower (P < .05). Relative risks for these disease groups were 1.18 (95% CI, 1.12-1.25) for fluid and electrolyte disorders, 1.14 (95% CI, 1.06-1.23) for renal failure, 1.10 (95% CI, 1.04-1.16) for urinary tract infections, 1.06 (95% CI, 1.00-1.11) for septicemia, and 2.54 (95% CI, 2.14-3.01) for heat stroke. Absolute risk differences were 0.34 (95% CI, 0.22-0.46) excess admissions per 100,000 individuals at risk for fluid and electrolyte disorders, 0.25 (95% CI, 0.12-0.39) for renal failure, 0.24 (95% CI, 0.09-0.39) for urinary tract infections, 0.21 (95% CI, 0.01-0.41) for septicemia, and 0.16 (95% CI, 0.10-0.22) for heat stroke. For fluid and electrolyte disorders and heat stroke, the risk of hospitalization increased during more intense and longer-lasting heat wave periods (P < .05). Risks were generally highest on the heat wave day but remained elevated for up to 5 subsequent days.
Conclusions and relevance: Among older adults, periods of extreme heat were associated with increased risk of hospitalization for fluid and electrolyte disorders, renal failure, urinary tract infection, septicemia, and heat stroke. However, the absolute risk increase was small and of uncertain clinical importance.
Conflict of interest statement
Figures
Similar articles
-
Heat stroke admissions during heat waves in 1,916 US counties for the period from 1999 to 2010 and their effect modifiers.Environ Health. 2016 Aug 8;15(1):83. doi: 10.1186/s12940-016-0167-3. Environ Health. 2016. PMID: 27503399 Free PMC article.
-
Medical diagnoses of heat wave-related hospital admissions in older adults.Prev Med. 2018 May;110:81-85. doi: 10.1016/j.ypmed.2018.02.001. Epub 2018 Feb 8. Prev Med. 2018. PMID: 29428173 Free PMC article.
-
Heatwaves and hospitalizations due to hyperthermia in defined climate regions in the conterminous USA.Environ Monit Assess. 2019 Jun 28;191(Suppl 2):394. doi: 10.1007/s10661-019-7412-5. Environ Monit Assess. 2019. PMID: 31254102
-
Heatstroke presentations to urban hospitals during BC's extreme heat event: lessons for the future.CJEM. 2024 Feb;26(2):111-118. doi: 10.1007/s43678-023-00622-y. Epub 2023 Dec 28. CJEM. 2024. PMID: 38153655 Free PMC article. Review.
-
Heat and the Heart.Yale J Biol Med. 2023 Jun 30;96(2):197-203. doi: 10.59249/HGAL4894. eCollection 2023 Jun. Yale J Biol Med. 2023. PMID: 37396980 Free PMC article. Review.
Cited by
-
Hospitalizations from Hypertensive Diseases, Diabetes, and Arrhythmia in Relation to Low and High Temperatures: Population-Based Study.Sci Rep. 2016 Jul 26;6:30283. doi: 10.1038/srep30283. Sci Rep. 2016. PMID: 27456033 Free PMC article.
-
Short term exposure to fine particulate matter and hospital admission risks and costs in the Medicare population: time stratified, case crossover study.BMJ. 2019 Nov 27;367:l6258. doi: 10.1136/bmj.l6258. BMJ. 2019. PMID: 31776122 Free PMC article.
-
Assessing proximate intermediates between ambient temperature, hospital admissions, and mortality in hemodialysis patients.Environ Res. 2022 Mar;204(Pt B):112127. doi: 10.1016/j.envres.2021.112127. Epub 2021 Sep 25. Environ Res. 2022. PMID: 34582801 Free PMC article.
-
The Chronic Kidney Disease Water Intake Trial: Protocol of a Randomized Controlled Trial.Can J Kidney Health Dis. 2017 Aug 22;4:2054358117725106. doi: 10.1177/2054358117725106. eCollection 2017. Can J Kidney Health Dis. 2017. PMID: 28856009 Free PMC article.
-
Acute kidney injury biomarkers and hydration assessments following prolonged mild hypohydration in healthy young adults.Am J Physiol Renal Physiol. 2023 Aug 1;325(2):F199-F213. doi: 10.1152/ajprenal.00086.2023. Epub 2023 Jun 15. Am J Physiol Renal Physiol. 2023. PMID: 37318992 Free PMC article.
References
-
- National Weather Service. [Accessed May 24, 2013];National weather service 73-year list of severe weather fatalities. 2013 http://www.nws.noaa.gov/om/hazstats/resources/weather_fatalities.pdf.
-
- McMichael AJ, Woodruff RE, Hales S. Climate change and human health: present and future risks. Lancet. 2006;367(9513):859–869. - PubMed
-
- Bouchama A, Knochel JP. Heat stroke. N Engl J Med. 2002;346(25):1978–1988. - PubMed
-
- Leon LR, Helwig BG. Heat stroke: role of the systemic inflammatory response. J Appl Physiol (1985) 2010;109(6):1980–1988. - PubMed
Publication types
MeSH terms
Grants and funding
- DP5 OD012161/OD/NIH HHS/United States
- R35 CA197449/CA/NCI NIH HHS/United States
- T32 ES007142/ES/NIEHS NIH HHS/United States
- R21 ES021427/ES/NIEHS NIH HHS/United States
- R21 ES020152/ES/NIEHS NIH HHS/United States
- 2P01CA134294-06/CA/NCI NIH HHS/United States
- 1K18HS021991-01A1/HS/AHRQ HHS/United States
- P01 CA134294/CA/NCI NIH HHS/United States
- R21ES022585/ES/NIEHS NIH HHS/United States
- R21ES020152/ES/NIEHS NIH HHS/United States
- 5R21ES021427-02/ES/NIEHS NIH HHS/United States
- K18 HS021991/HS/AHRQ HHS/United States
- R21 ES022585/ES/NIEHS NIH HHS/United States
- P30 ES000002/ES/NIEHS NIH HHS/United States
- R01ES019560/ES/NIEHS NIH HHS/United States
- R01 ES019560/ES/NIEHS NIH HHS/United States
- P30ES000002/ES/NIEHS NIH HHS/United States
LinkOut - more resources
Full Text Sources
Other Literature Sources
