A method for estimating and removing streaking artifacts in quantitative susceptibility mapping
- PMID: 25536496
- PMCID: PMC4406048
- DOI: 10.1016/j.neuroimage.2014.12.043
A method for estimating and removing streaking artifacts in quantitative susceptibility mapping
Abstract
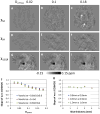
Quantitative susceptibility mapping (QSM) is a novel MRI method for quantifying tissue magnetic property. In the brain, it reflects the molecular composition and microstructure of the local tissue. However, susceptibility maps reconstructed from single-orientation data still suffer from streaking artifacts which obscure structural details and small lesions. We propose and have developed a general method for estimating streaking artifacts and subtracting them from susceptibility maps. Specifically, this method uses a sparse linear equation and least-squares (LSQR)-algorithm-based method to derive an initial estimation of magnetic susceptibility, a fast quantitative susceptibility mapping method to estimate the susceptibility boundaries, and an iterative approach to estimate the susceptibility artifact from ill-conditioned k-space regions only. With a fixed set of parameters for the initial susceptibility estimation and subsequent streaking artifact estimation and removal, the method provides an unbiased estimate of tissue susceptibility with negligible streaking artifacts, as compared to multi-orientation QSM reconstruction. This method allows for improved delineation of white matter lesions in patients with multiple sclerosis and small structures of the human brain with excellent anatomical details. The proposed methodology can be extended to other existing QSM algorithms.
Keywords: High resolution brain imaging; Multiple sclerosis; Quantitative susceptibility mapping; Streaking artifact removal.
Copyright © 2014. Published by Elsevier Inc.
Figures


Similar articles
-
Streaking artifact reduction for quantitative susceptibility mapping of sources with large dynamic range.NMR Biomed. 2015 Oct;28(10):1294-303. doi: 10.1002/nbm.3383. Epub 2015 Aug 27. NMR Biomed. 2015. PMID: 26313885 Free PMC article.
-
Technical Note: Optimization of quantitative susceptibility mapping by streaking artifact detection.Med Phys. 2020 Nov;47(11):5715-5722. doi: 10.1002/mp.14460. Epub 2020 Oct 7. Med Phys. 2020. PMID: 32945538
-
Quantitative Susceptibility Mapping Using the Multiple Dipole-inversion Combination with k-space Segmentation Method.Magn Reson Med Sci. 2017 Oct 10;16(4):340-350. doi: 10.2463/mrms.mp.2016-0062. Epub 2017 Mar 27. Magn Reson Med Sci. 2017. PMID: 28367904 Free PMC article.
-
Quantitative Susceptibility Mapping: Concepts and Applications.Clin Neuroradiol. 2015 Oct;25 Suppl 2:225-30. doi: 10.1007/s00062-015-0432-9. Epub 2015 Jul 22. Clin Neuroradiol. 2015. PMID: 26198880 Review.
-
Quantitative susceptibility mapping: current status and future directions.Magn Reson Imaging. 2015 Jan;33(1):1-25. doi: 10.1016/j.mri.2014.09.004. Epub 2014 Oct 25. Magn Reson Imaging. 2015. PMID: 25267705 Review.
Cited by
-
Nigral Iron Deposition Is Associated With Levodopa-Induced Dyskinesia in Parkinson's Disease.Front Neurosci. 2021 Mar 22;15:647168. doi: 10.3389/fnins.2021.647168. eCollection 2021. Front Neurosci. 2021. PMID: 33828454 Free PMC article.
-
DTI Tract-Based Quantitative Susceptibility Mapping: An Initial Feasibility Study to Investigate the Potential Role of Myelination in Brain Connectivity Change in Cerebral Palsy Patients During Autologous Cord Blood Cell Therapy Using a Rotationally-Invariant Quantitative Measure.J Magn Reson Imaging. 2021 Jan;53(1):251-258. doi: 10.1002/jmri.27286. Epub 2020 Jul 16. J Magn Reson Imaging. 2021. PMID: 32677156 Free PMC article. Clinical Trial.
-
Feasibility and intra-and interobserver reproducibility of quantitative susceptibility mapping with radiomic features for intracranial dissecting intramural hematomas and atherosclerotic calcifications.Sci Rep. 2023 Mar 4;13(1):3651. doi: 10.1038/s41598-023-30745-2. Sci Rep. 2023. PMID: 36871117 Free PMC article.
-
Simultaneous quantitative susceptibility mapping (QSM) and R2* for high iron concentration quantification with 3D ultrashort echo time sequences: An echo dependence study.Magn Reson Med. 2018 Apr;79(4):2315-2322. doi: 10.1002/mrm.27062. Epub 2018 Jan 4. Magn Reson Med. 2018. PMID: 29314215 Free PMC article.
-
Mapping of apparent susceptibility yields promising diagnostic separation of progressive supranuclear palsy from other causes of parkinsonism.Sci Rep. 2019 Apr 15;9(1):6079. doi: 10.1038/s41598-019-42565-4. Sci Rep. 2019. PMID: 30988382 Free PMC article.
References
-
- de Rochefort L, Liu T, Kressler B, Liu J, Spincemaille P, Lebon V, Wu JL, Wang Y. Quantitative susceptibility map reconstruction from MR phase data using Bayesian regularization: validation and application to brain imaging. Magn Reson Med. 2010;63:194–206. - PubMed
Publication types
MeSH terms
Grants and funding
LinkOut - more resources
Full Text Sources
Other Literature Sources
Medical

