. 2014 Dec 23;12(12):e1002002.
doi: 10.1371/journal.pbio.1002002. eCollection 2014 Dec.

Macrophages contribute to the cyclic activation of adult hair follicle stem cells

Affiliations

Macrophages contribute to the cyclic activation of adult hair follicle stem cells

Donatello Castellana et al. PLoS Biol. .

Abstract

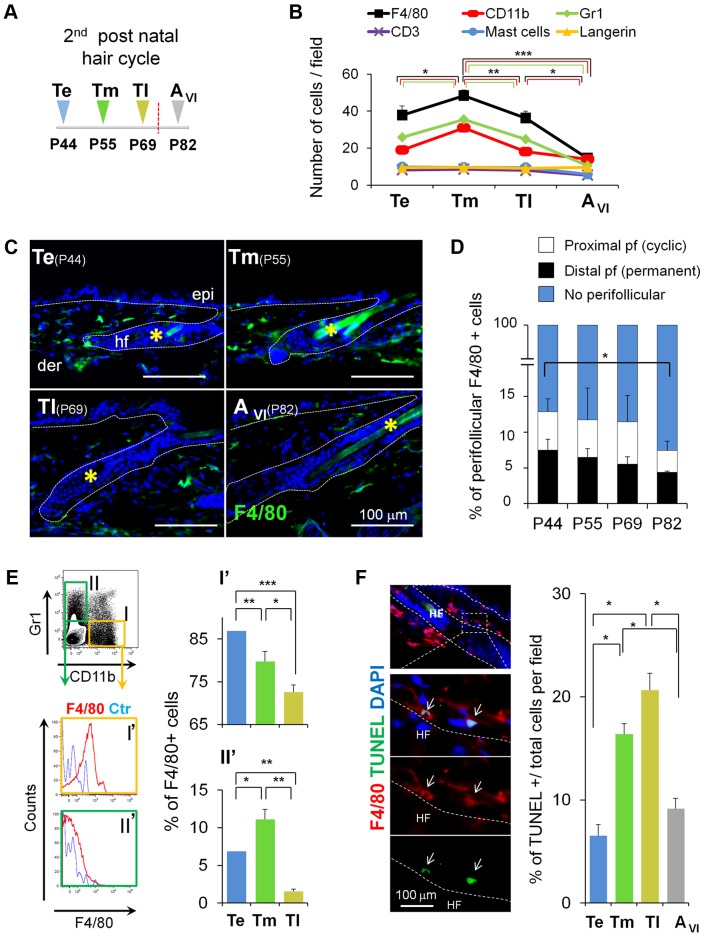
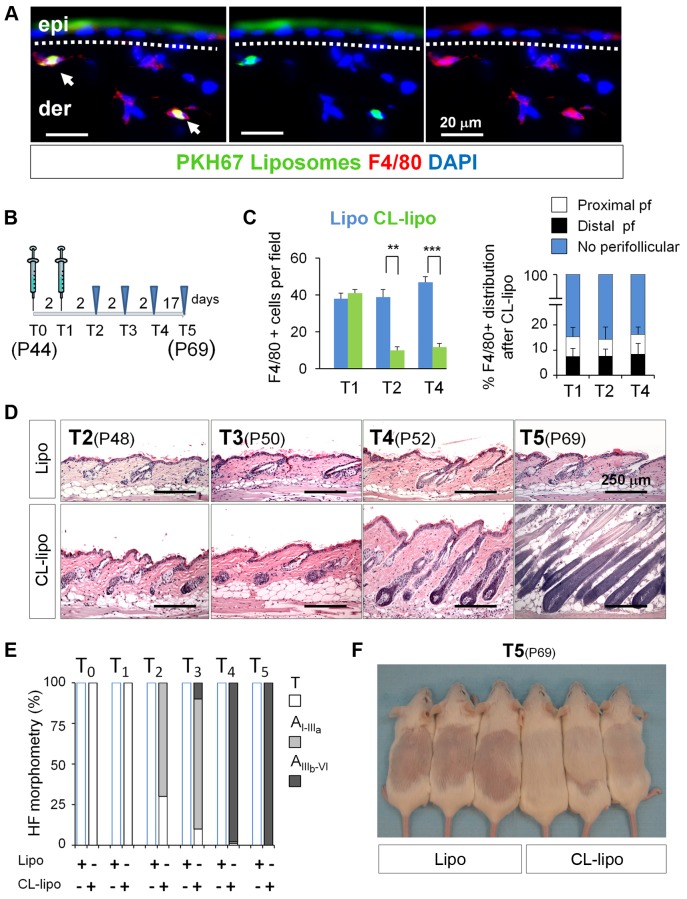
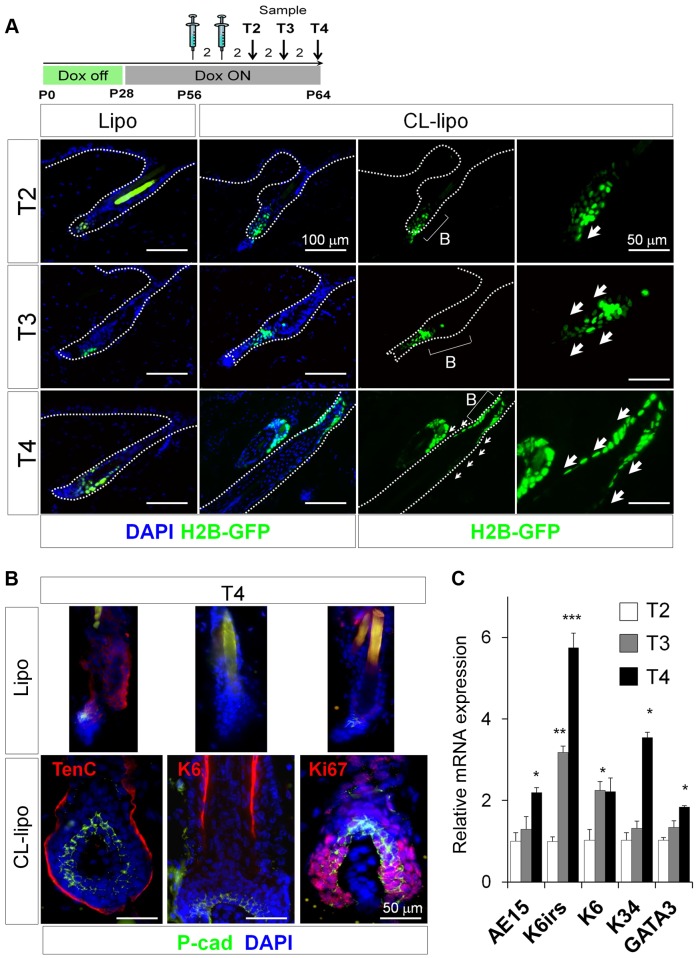
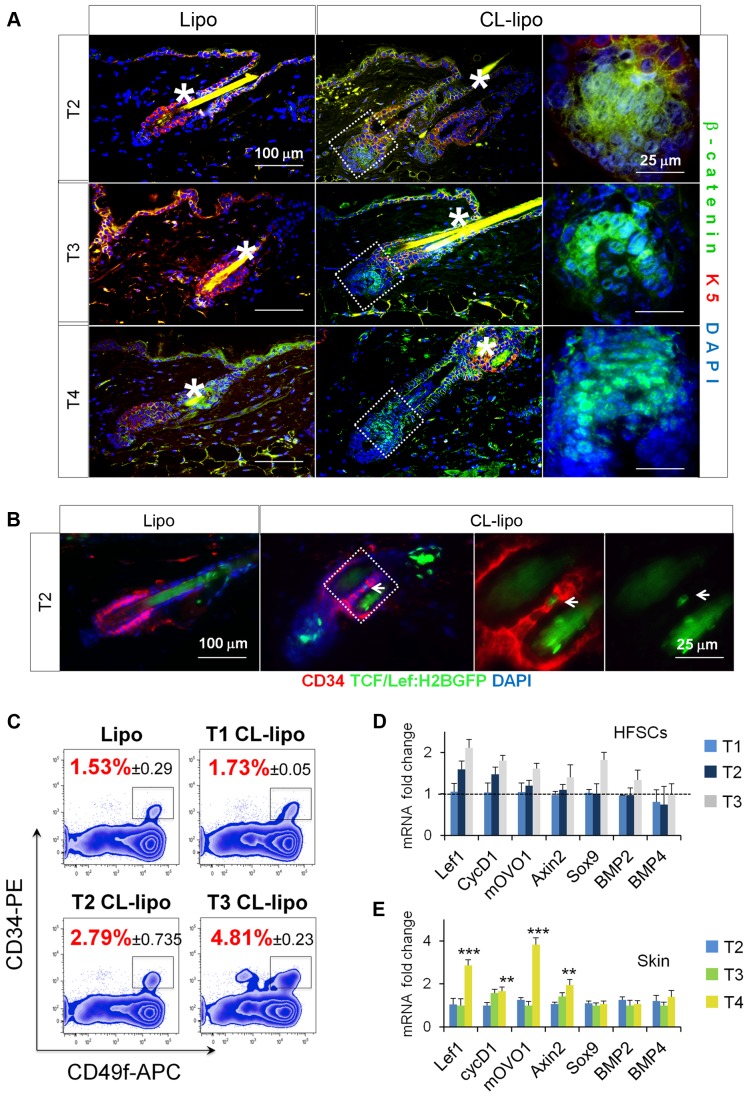
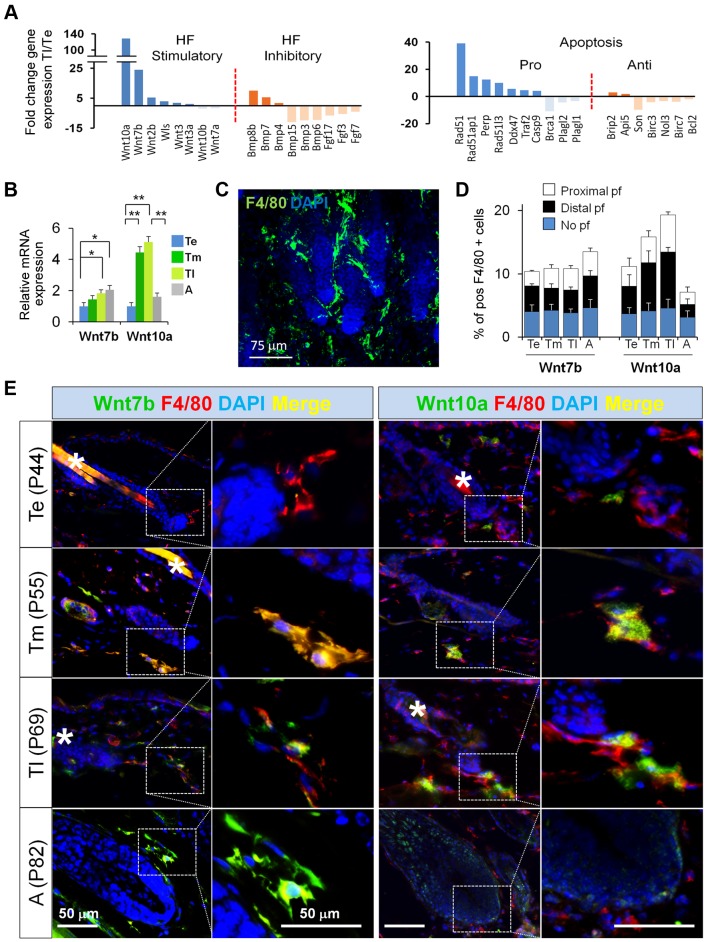
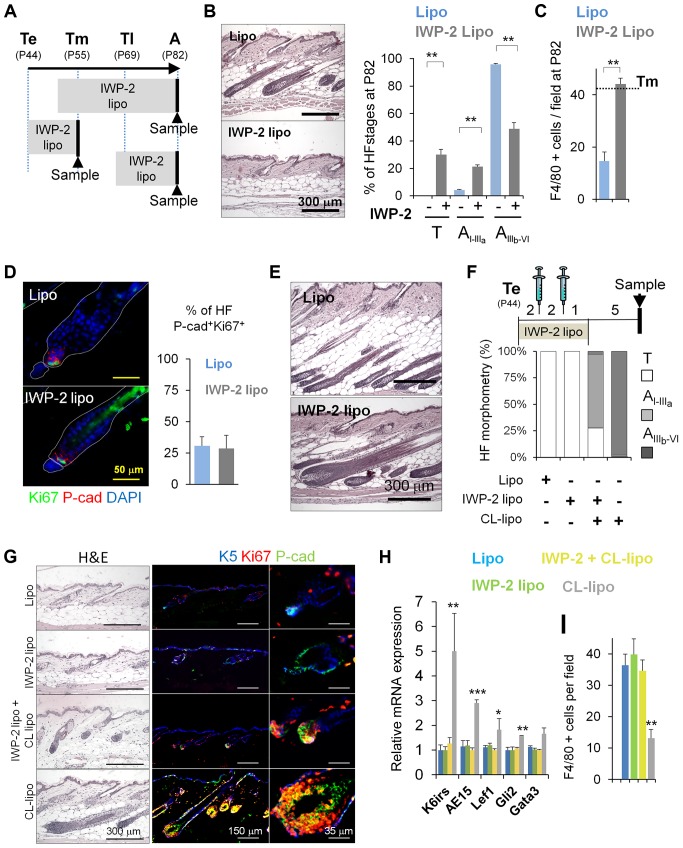
Skin epithelial stem cells operate within a complex signaling milieu that orchestrates their lifetime regenerative properties. The question of whether and how immune cells impact on these stem cells within their niche is not well understood. Here we show that skin-resident macrophages decrease in number because of apoptosis before the onset of epithelial hair follicle stem cell activation during the murine hair cycle. This process is linked to distinct gene expression, including Wnt transcription. Interestingly, by mimicking this event through the selective induction of macrophage apoptosis in early telogen, we identify a novel involvement of macrophages in stem cell activation in vivo. Importantly, the macrophage-specific pharmacological inhibition of Wnt production delays hair follicle growth. Thus, perifollicular macrophages contribute to the activation of skin epithelial stem cells as a novel, additional cue that regulates their regenerative activity. This finding may have translational implications for skin repair, inflammatory skin diseases and cancer.


Conflict of interest statement

The authors have declared that no competing interests exist.

Figures

Figure 1
Figure 1. Skin-resident macrophages decrease in number before the onset of anagen.
(A) Time course of isolation of backskin samples. The second telogen period was subdivided into three stages followed by anagen. P44, early telogen (Te); P55, mid telogen (Tm); P69, late telogen (Tl); and P82, anagen (AVI). (B) Fluctuations in the number of skin-resident immune cells during the second hair cycle analyzed by immunofluorescence. Note the decrease in cells expressing the myeloid markers CD11b, Gr1, F4/80 before the onset of anagen. Each histogram point represents the mean value of positive cells per 10× magnification field. 10 fields/section/mouse were analyzed; n = 4. See also Figure S1. (C) Expression of F4/80 cells (green) in skin at Te, Tm, Tl, and AVI stages, counterstained with DAPI (blue). Bar = 100 µm; *hair shaft autofluorescence. (D) Fluctuations in the number of perifollicular macrophages during the second hair cycle analyzed by immunofluorescence. Note the decrease in F4/80+ at AVI. Each histogram point represents the mean value of positive cells per 10× magnification field at 30 µm distance from HF . 10 fields/section/mouse were analyzed; n = 4. (E) FACS analysis of single cell suspensions from total skin samples harvested at Te, Tm, and Tl stages. Histograms show the percentage of F4/80+ cells gated from the CD11b+Gr1cells (I) and Cd11bGr1+ (II) populations; n = 7–12. The gating strategy is shown in Figure S3A. (F) TUNEL+F4/80+ cells in Tm. Histograms show the percentage of TUNEL positive cells in the FACS sorted CD11b+F4/80+Gr1 macrophage population (I) analyzed in cytospin preparations; n = 3. The gating strategy is shown in Figure S11 A. Note: n refers to the number of mice, per point per condition. *p≤0.05; **p<0.005; ***p<0.0005. All data used to generate the histograms can be found in Data S1.
Figure 2
Figure 2. Reduction of macrophage numbers in early telogen induces precocious HF growth.
(A) The specific uptake of liposomes by macrophages was analyzed by co-immunofluorescence analysis of F4/80+ cells (red) and the detection of the liposomal PKH67 label (green) in skin sections after the injection of PKH67-liposomes. Arrows indicate double labeling; n = 2. Bar = 20 µm. (B) P44 mice were injected in the backskin for two alternated days with CL-lipo. Samples were collected for analyses at the time indicated in the diagram. (C) Histograms represent the quantification of F4/80+ cells in the backskin after treatment with CL-lipo and Lipo (left). Also shown is the distribution of F4/80+ cells in the backskin after treatment with CL-lipo (right). 10 fields/section/mouse were analyzed; n = 4. (D) Hematoxylin–eosin staining of backskin samples isolated after treatment with CL-lipo and Lipo controls. Bar = 250 µm, n = 4. (E) Histomorphometric analysis of HF stages after macrophages reduction. 100 HFs/mouse were analyzed; n = 4. (F) Appearance of the hair coat at T5 (P69), after shaving and treatment with CL-lipo and Lipo controls at T0 (P44). **p<0.005; ***p<0.0005. Note: n refers to the number of mice, per point per condition. All data used to generate the histograms can be found in Data S1.
Figure 3
Figure 3. Reduction of macrophage numbers in Telogen induces precocious exiting and differentiation of HF-SCs.
(A) Representative backskin sections of K5tTA-pTREH2B-GFP mice, subjected to a pulse-chase treatment with doxycycline, followed by treatment at P56 for two alternated days with CL-lipo or Lipo controls. Arrows show the mobilization of LRCs (green); n = 3. Dox, doxycycline. (B) Immunofluorescence analysis of P-cad, Tenascin C (TenC), Keratin6 (K6), and the proliferation marker Ki67; n = 4. *Hair shaft autofluorescence. Bar = 50 µm. (C) Relative mRNA expression of the differentiation markers trichohyalin (AE15), K6irs, K6, K34, and GATA3 from total backskin samples after treatment with CL-lipo, normalized to Lipo controls; n = 2–4. *p≤0.05. All data used to generate the histograms can be found in Data S1.
Figure 4
Figure 4. Reduction of skin macrophages is associated with activation of β-catenin/Wnt signaling.
(A) Immunofluorescence analysis of β-catenin (green) and K5 (red) in backskin sections of mice treated with CL-lipo and Lipo controls; n = 4. *Hair shaft autofluorescence. Bar = 25 µm. (B) Immunofluorescence analysis of CD34 (red) and H2B-GFP signal (green) in T2 backskin sections of TCF/Lef:H2B-GFP transgenic mice treated with CL-lipo and Lipo controls; n = 3. Arrows point to GFP positive cells. Bar = 25 µm. The gating strategy is shown in Figure S11 B. (C) FACS analysis of single cell suspensions of CD34+CD49f+ HF-SCs (gated) isolated from backskin of mice treated with CL-lipo or Lipo controls at specified time points; n = 2–4. (D) Relative mRNA expression of canonical Wnt/β-catenin target genes and BMP signaling genes in HF-SCs isolated as indicated in (B); n = 2–4. (E) Relative mRNA expression of canonical Wnt/β-catenin target genes and BMP signaling genes in total back-skin samples after treatment with CL-lipo compared to Lipo controls; n = 6. Note: n refers to the number of mice, per point per condition. *p≤0.05. All data used to generate the histograms can be found in Data S1.
Figure 5
Figure 5. Resident macrophages express HF-SC stimulatory factors before the onset of anagen.
(A) CD11b+Gr1F4/80+ macrophages were FACS-isolated from Te and Tl backskin samples. Their mRNAs were purified and used to perform microarray analyses to evaluate changes in gene expression at Tl (P69) versus Te (P44). Histograms show a shortlist of up- and downregulated genes that have been involved in the control of HF-SC activation and apoptosis. The gating strategy is shown in Figure S3 A. (B) Relative mRNA expression of Wnt7b and Wnt10a in FACS-sorted CD11b+Gr1F4/80+ cells at Te, Tm, Tl, and A; n = 3. The gating strategy is shown in Figure S3A. (C) Immunofluorescence staining of F4/80+ perifollicular macrophages (green). (D) Each histogram point represents the mean value of double positive F4/80+Wnt7b+ and F480+Wnt10a+ over total F4/80+ perifollicular macrophages. 10 fields/section/mouse were analyzed; n = 4. (E) Immunofluorescence of Wnt7b (green)/F4/80 (red), and Wnt10a (green)/F4/80 (red), counterstained with DAPI (blue) of skin sections at Te, Tm, Tl, and A; n = 3. Bar = 50 µm. n.s. non significant, Note: n refers to the number of mice, per point per condition. *p≤0.05. All data used to generate the histograms can be found in Data S1.
Figure 6
Figure 6. Inhibition of the production of Wnts by skin macrophages delays hair growth.
(A) Scheme illustrating the subcutaneous treatment with IWP-2-liposomes (IWP-2-lipo) to target mature phagocytic macrophages at different telogenic stages. Arrowheads indicate the time in which skin samples were collected. (B) Histological analyses of skin sections harvested at A (P82), after being treated with IWP-2-lipo starting before Tm (P50); n = 8. Quantification of the stage of HFs telogen (T), Early anagen (AI–IIIa), late anagen (AIIIb–VI); n = 8. (C) Histogram shows the quantification of the number of F4/80+ cells at A (P82), after being treated with IWP-2-lipo starting before Tm (P50). 10 fields/section/mouse were analyzed; n = 3. Dotted line represents Tm threshold levels. (D) Mice were injected in the backskin with IWP-2-lipo and Lipo controls starting at Te (P44). Samples were collected at Tm (P55), and processed for immunofluorescence analyses of Ki67 and P-cad (HG). The histogram shows the percentage of HFs with a HG positive for Ki67+Pcad+ cells; n = 3. (E) Histological analysis of skin sections harvested at A (P82) after being treated with IWP-2-lipo starting at P67, two days before Tl; n = 3. (F–G) Histomorphometric analysis of HF stages and histological analyses of skin sections of mice treated for 5 days with IWP2-lipo and Lipo controls. Over the curse of this treatment, CL-lipo and Lipo controls (syringes) were administered twice every 2 days. Samples were collected 6 days later. Immunostaining shows proliferating HG (Ki67+P-cad+). 100 HFs/mouse were analyzed; n = 6. (H) Relative mRNA expression of HF differentiation markers in total skin samples treated as described in (F); n = 6. (I) Histogram shows the quantification of the number of F4/80+ cells per field, after being treated as described in Figure 6F; n = 3. Note: n refers to the number of mice, per point per condition. *p≤0.05, **p<0.005; ***p<0.0005. All data used to generate the histograms can be found in Data S1.

References

    1. Tadeu AM, Horsley V (2014) Epithelial stem cells in adult skin. Curr Top Dev Biol 107: 109–131. - PMC - PubMed
    1. Di Meglio P, Perera GK, Nestle FO (2011) The multitasking organ: recent insights into skin immune function. Immunity 35: 857–869. - PubMed
    1. Gurtner GC, Werner S, Barrandon Y, Longaker MT (2008) Wound repair and regeneration. Nature 453: 314–321. - PubMed
    1. Gay D, Kwon O, Zhang Z, Spata M, Plikus MV, et al. (2013) Fgf9 from dermal gammadelta T cells induces hair follicle neogenesis after wounding. Nat Med 19: 916–923. - PMC - PubMed
    1. Coussens LM, Werb Z (2002) Inflammation and cancer. Nature 420: 860–867. - PMC - PubMed

Publication types