. 2015 Jul;17(7):978-91.
doi: 10.1093/neuonc/nou343. Epub 2014 Dec 23.

Increasing glioma-associated monocytes leads to increased intratumoral and systemic myeloid-derived suppressor cells in a murine model

Affiliations

Increasing glioma-associated monocytes leads to increased intratumoral and systemic myeloid-derived suppressor cells in a murine model

Michael Chae et al. Neuro Oncol. 2015 Jul.

Abstract

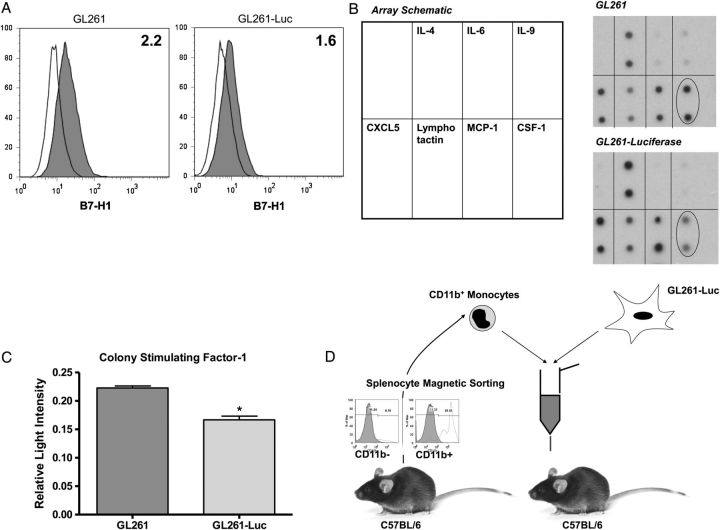
Background: Patients with glioblastoma multiforme (GBM) exhibit marked intratumoral and systemic immunosuppression. GBM is heavily infiltrated with monocytic cells. Monocytes contacting GBM cells develop features of immunosuppressive myeloid-derived suppressor cells (MDSCs), which are elevated in GBM patients. Therefore, we hypothesized that circulating MDSC levels could be raised in vivo by increasing glioma-associated macrophages.

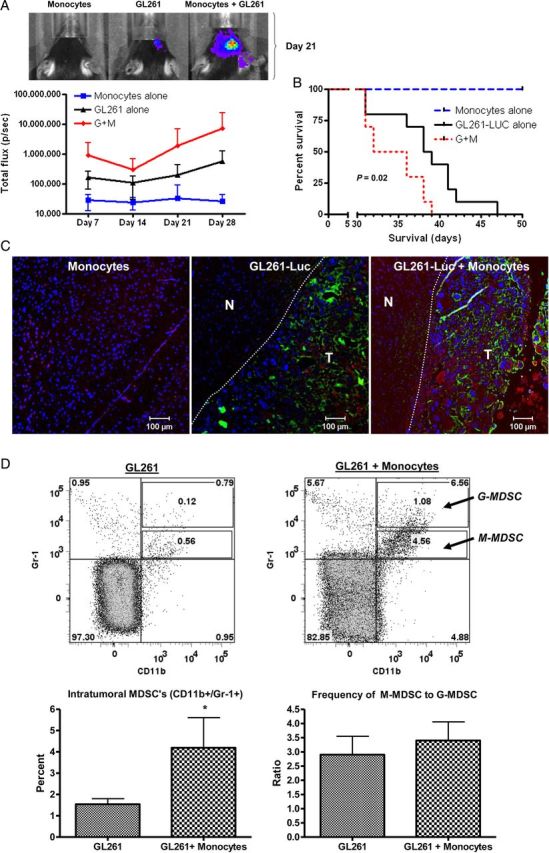
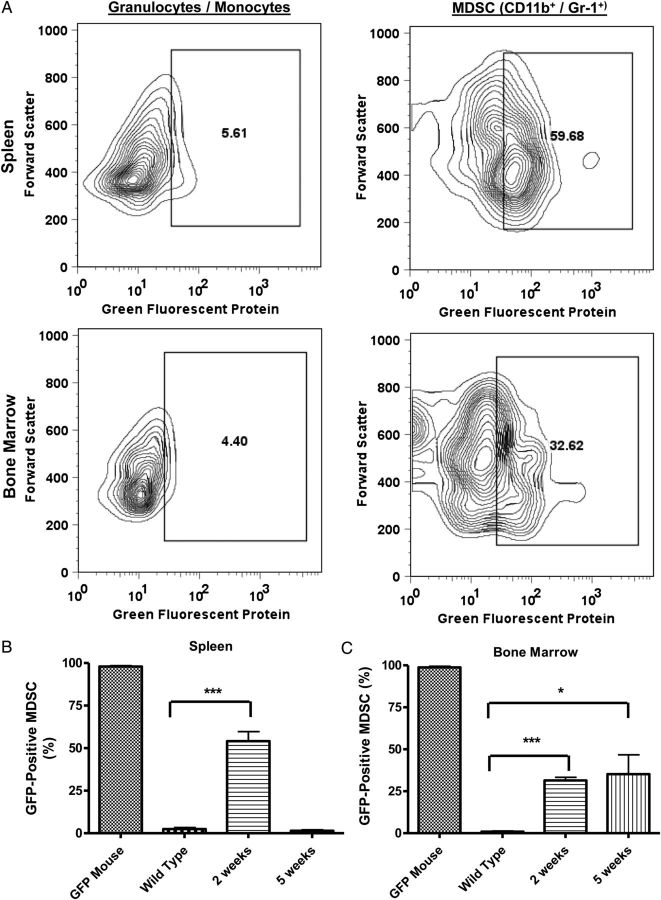
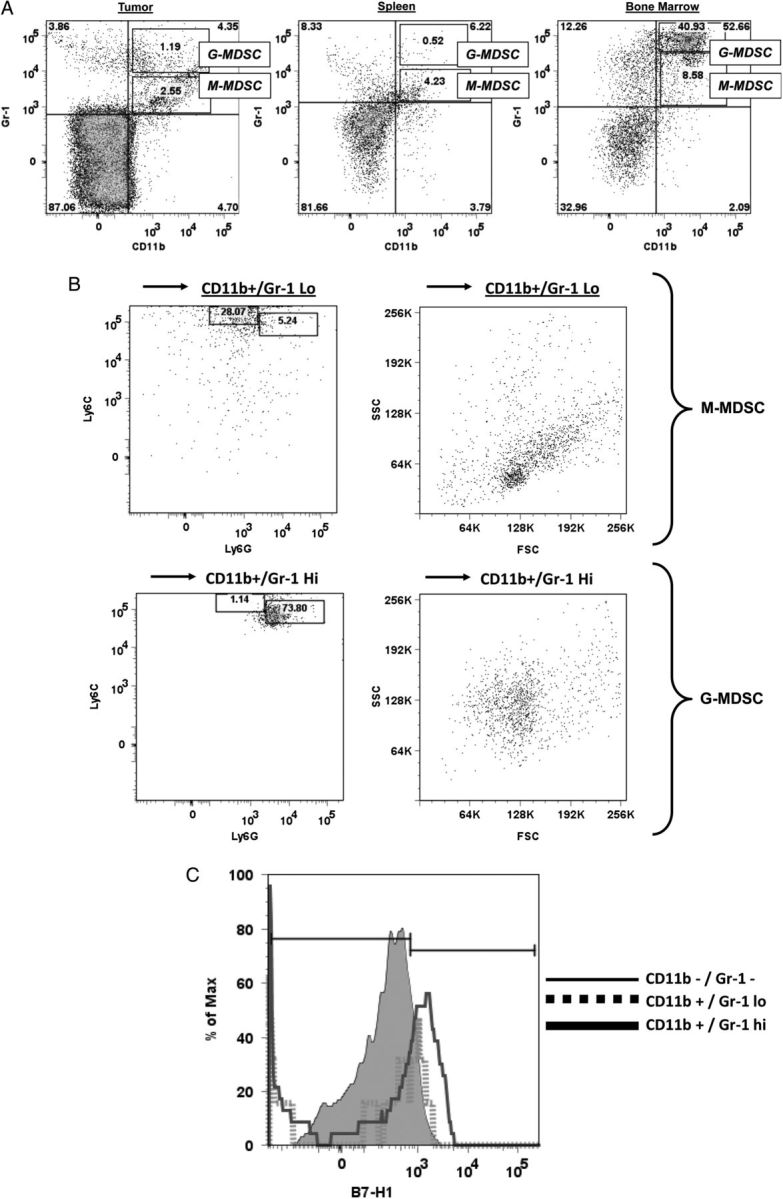
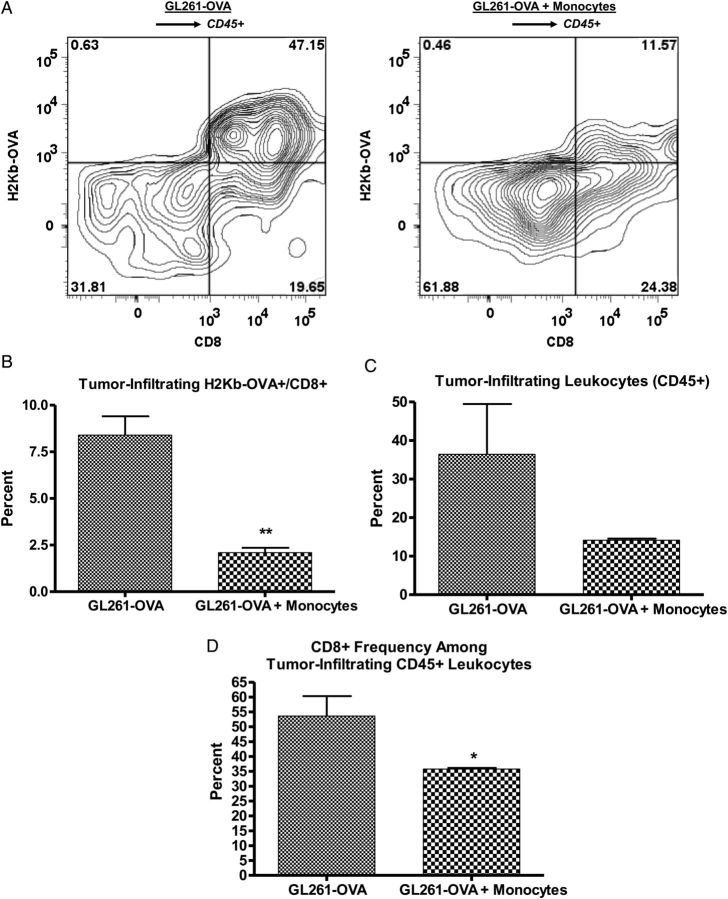
Methods: GL261-luciferase glioma was implanted intracranially in C57BL/6 mice with or without additional normal syngeneic CD11b+ monocytes. Tumor growth and intratumoral and systemic MDSC (CD11b+/Gr-1+) levels were determined. Green fluorescent protein (GFP)-transgenic monocytes were coinjected intracranially with GL261-luciferase cells. GFP+ cell frequency among splenic and bone marrow MDSCs was determined. Impact of increased MDSC's on spontaneous immune responses to tumor cells expressing a model antigen (ovalbumin [OVA]) was determined.

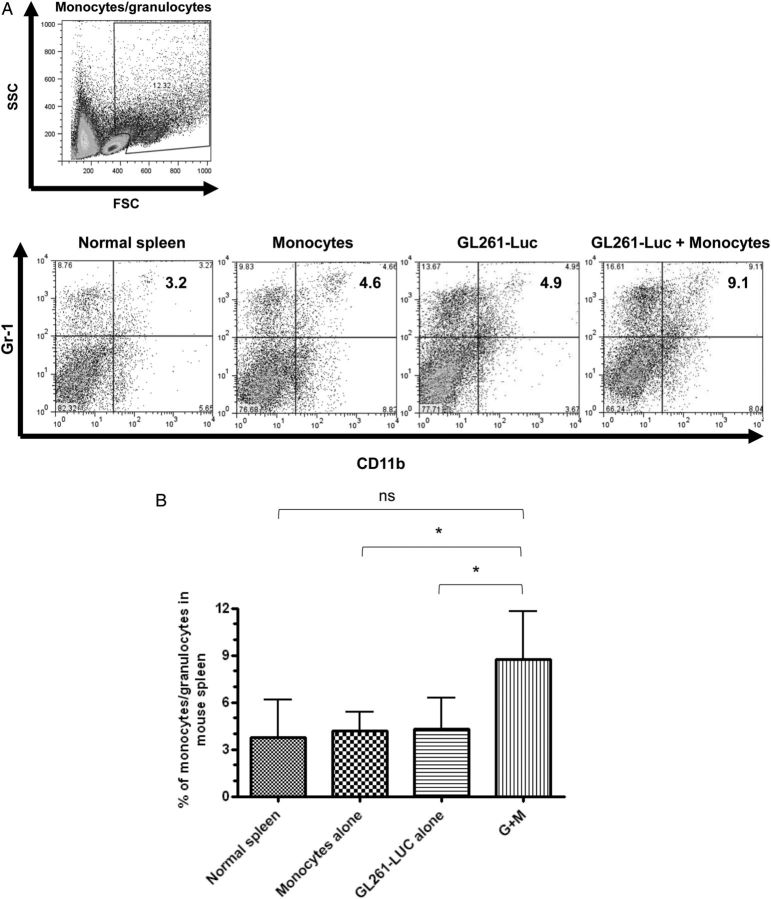
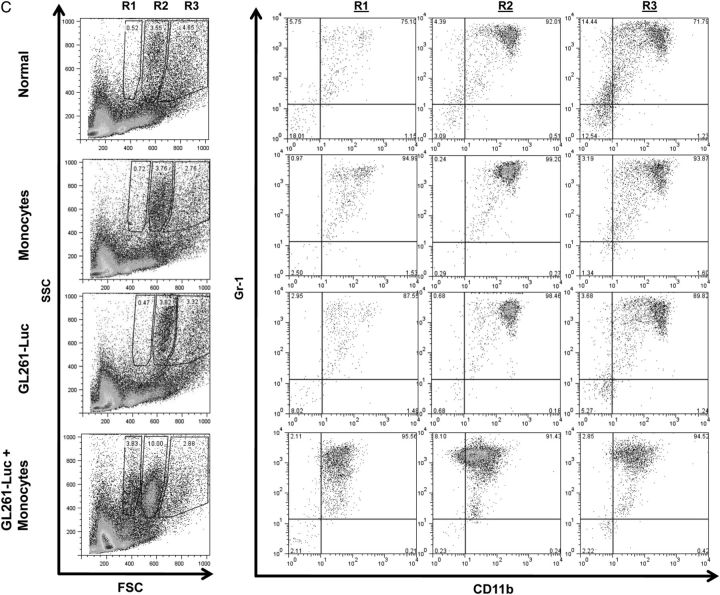
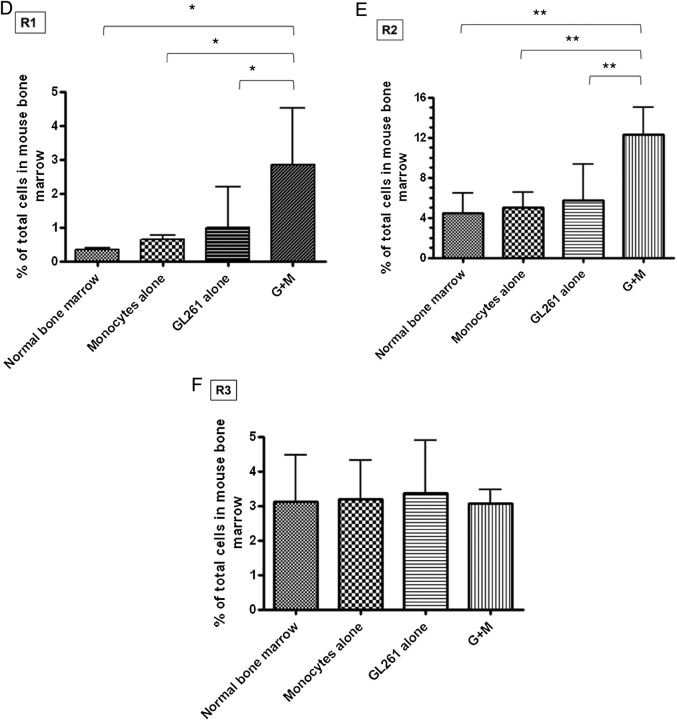
Results: Tumors grew faster and MDSC's were increased in tumor, spleen, and bone marrow in mice receiving GL261-Luc plus monocytes. Many (30%-50%) systemic MDSC's were GFP+ in mice receiving intracranial tumor plus GFP-transgenic monocytes, suggesting that they originated from glioma-associated monocytes. Tumor-infiltrating OVA-specific CD8+ T cells were markedly reduced in mice receiving GL261-OVA and monocytes compared with mice receiving GL261-OVA alone.

Conclusions: Increasing glioma-associated macrophages in intracranial GL261 glioma decreases survival and markedly increases intratumoral and systemic MDSC's, many of which originate directly from glioma-associated macrophages. This is associated with decreased spontaneous immune responses to a model antigen. To our knowledge, this is the first evidence in cancer that systemic MDSC's can arise directly from normal monocytes that have undergone intratumoral immunosuppressive education.

Keywords: GL261; glioma; immunosuppression; myeloid-derived suppressor cell; tumor-associated macrophage.


Figures

Fig. 1.
Fig. 1.
Variation in immune phenotype between GL261 and GL261-Luc. (A) Representative flow cytomtery histograms demonstrating modest constitutive B7-H1 expression by both GL261 and GL261-Luc. Clear histograms = isotype control. Shaded histograms = anti–B7-H1 antibody. Numbers represent standardized fluorescence intensity. (B) Cytokine expression arrays for GL261 and GL261-Luc. Both express similar amounts of IL-4, CXCL5, lymphotactin, and MCP-1 but minimal IL-6. CSF-1 expression (oval) was reduced in GL261-Luc. (C) Densitometry results from cytokine expression array (relative light intensity compared with total protein positive control) confirming significant reduction in CSF-1 expression by GL261-Luc compared with GL261 (mean ± SD; *P < .05). (D) Schematic of proposed in vivo model system, including representative flow cytometry histograms documenting ∼90% purity of CD11b+ splenocytes after magnetic sorting.
Fig. 2.
Fig. 2.
Increasing glioma-associated monocytes increases intracranial GL261-Luc growth. (A) Increased bioluminescence in mice receiving GL261-Luc and monocytes compared with controls with tumor or monocytes alone is apparent by day 7 and never resolves. Representative photographs from mice with bioluminescence closest to mean values at day 21 are shown. G + M = GL261-Luc + monocytes. N = 10 per group. Data = mean ± SEM. (B) Kaplan–Meier curve showing decreased survival for mice receiving GL261-Luc and monocytes. G + M = GL261-Luc + monocytes. N = 10 per group. (C) Representative fluorescence micrographs demonstrating increased monocytes in mice receiving GL261-Luc plus monocytes. Blue = DAPI (nuclei), green = luciferase (tumor), red = F4/80 (monocytes). N = normal brain. T = tumor. Dashed line indicates edge of most defined tumor bulk. (D) Representative flow cytometry dot plots and bar graphs of pooled data from 4 mice per group demonstrating increased frequency of CD11b+/Gr-1+ MDSCs within GL261-Luc + monocyte tumors. Note that these are primarily CD11b+/Gr-1lo M-MDSCs and not CD11+/Gr-1hi G-MDSCs, and the ratio of M-MDSCs to G-MDSCs does not change when MDSC frequency is increased by coinjecting monocytes with tumor cells. *P = .05.
Fig. 3.
Fig. 3.
Increasing glioma-associated monocytes leads to increased systemic MDSCs. (A) Representative dot plots showing gating strategy for monocytes/granulocytes in splenocytes and identifying CD11b+/Gr-1+ MDSCs from among these. SSC, side scatter. (B) Bar graph showing that CD11b+/Gr-1+ MDSCs are increased in splenocytes of mice receiving intracranial GL261-Luc plus monocytes (G + M). N = 10/group. ns = not significant. (C) Representative dot plots demonstrating gating strategy to identify monocytes/granulocytes in bone marrow and identifying CD11b+/Gr-1+ MDSCs from among these. Note that 3 populations corresponding to monocytes/granulocytes (R1–R3) were identified with similar side scatter (SSC) but increasing forward scatter (FSC) (size). Increases in MDSCs were primarily seen in the R1 and R2 (smaller size) gates in mice receiving both intracranial tumor and monocytes. These MDSCs also had a relative reduction in the intensity of CD11b expression. (D) Bar graph showing increased MDSCs in the R1 bone marrow gate (small size monocytes/granulocytes) in mice receiving both intracranial tumor and monocytes. N = 10/group. (E) Bar graph showing increased MDSCs in the R2 bone marrow gate (intermediate size monocytes/granulocytes) in mice receiving both intracranial tumor and monocytes. N = 10/group. (F) Bar graph showing no change in MDSCs in the R3 bone marrow gate (large monocytes/granulocytes) in mice receiving both intracranial tumor and monocytes. N = 10/group. All bar graphs = mean ± SEM. *P < .05, **P < .01.
Fig. 3.
Fig. 3.
Increasing glioma-associated monocytes leads to increased systemic MDSCs. (A) Representative dot plots showing gating strategy for monocytes/granulocytes in splenocytes and identifying CD11b+/Gr-1+ MDSCs from among these. SSC, side scatter. (B) Bar graph showing that CD11b+/Gr-1+ MDSCs are increased in splenocytes of mice receiving intracranial GL261-Luc plus monocytes (G + M). N = 10/group. ns = not significant. (C) Representative dot plots demonstrating gating strategy to identify monocytes/granulocytes in bone marrow and identifying CD11b+/Gr-1+ MDSCs from among these. Note that 3 populations corresponding to monocytes/granulocytes (R1–R3) were identified with similar side scatter (SSC) but increasing forward scatter (FSC) (size). Increases in MDSCs were primarily seen in the R1 and R2 (smaller size) gates in mice receiving both intracranial tumor and monocytes. These MDSCs also had a relative reduction in the intensity of CD11b expression. (D) Bar graph showing increased MDSCs in the R1 bone marrow gate (small size monocytes/granulocytes) in mice receiving both intracranial tumor and monocytes. N = 10/group. (E) Bar graph showing increased MDSCs in the R2 bone marrow gate (intermediate size monocytes/granulocytes) in mice receiving both intracranial tumor and monocytes. N = 10/group. (F) Bar graph showing no change in MDSCs in the R3 bone marrow gate (large monocytes/granulocytes) in mice receiving both intracranial tumor and monocytes. N = 10/group. All bar graphs = mean ± SEM. *P < .05, **P < .01.
Fig. 4.
Fig. 4.
Many systemic MDSCs originate from glioma-associated monocytes. (A) Representative flow cytometry zebra plots of splenocytes and bone marrow from a mouse that received intracranial GL261-Luc plus syngeneic GFP-transgenic monocytes 2 weeks earlier. Note that there are very few GFP+ cells among monocytes/granulocytes as a whole but that gating on CD11b+/Gr-1+ MDSCs from among these cells demonstrates that large numbers are GFP+, suggesting that they originated from glioma-associated monocytes. (B) Bar graphs demonstrating increased GFP+ splenic MDSCs in mice receiving intracranial tumor plus GFP+ monocytes compared with normal (wild-type) controls 2 weeks post-intracranial injection. This is absent by 5 weeks after injection. Note: splenic MDSCs from GFP-transgenic mice are included as positive controls. N = 3 per group. (C) Bar graphs demonstrating increased GFP+ bone marrow MDSCs in mice receiving intracranial tumor plus GFP+ monocytes compared with normal (wild-type) controls 2 weeks post-intracranial injection. This is persistent 5 weeks after injection. Note: bone marrow MDSCs from GFP-transgenic mice are included as positive controls. N = 3 per group. All bar graphs = mean ± SEM. *P = .05, ***P < .001.
Fig. 5.
Fig. 5.
MDSC phenotype varies with location. (A) Representative dot plots showing CD11b+/Gr-1+ MDSCs in tumor, spleen, and bone marrow from mice that received intracranial GL261 + monocytes. Note that 2 MDSC populations can be identified, CD11b+/Gr-1hi (corresponding to G-MDSC) and CD11b+/Gr-1lo (corresponding to M-MDSC). M-MDSCs are more common than G-MDSCs in tumor and spleen, but G-MDSCs are more common in bone marrow. (B) Representative Ly6C/Ly6G expression and forward-scatter (FSC)/side-scatter (SSC) profiles of CD11b+/Gr-1lo or CD11b+/Gr-1hi bone marrow cells. CD11b+/Gr-1lo cells are largely Ly6Chi/Ly6Glo and are relatively smaller and less granular, compatible with M-MDSCs. CD11b+/Gr-1hi cells are largely Ly6Clo/Ly6Ghi and are relatively larger and more granular, compatible with G-MDSCs. (C) Histogram demonstrating increased B7-H1 expression in CD11b+/Gr-1hi cells (G-MDSCs) compared with CD11b+/Gr-1lo cells (M-MDSCs) or non-MDSC cells (CD11b−/Gr-1−).
Fig. 6.
Fig. 6.
Decreased antigen-specific immune response in mice with increased MDSCs. (A) Representative zebra plots showing gating strategy to determine CD8+/H2Kb-OVA–specific frequency among CD45+ leukocytes from tumors of mice receiving GL261-OVA alone or GL261-OVA plus monocytes (increased MDSCs). (B) Bar graph showing significant decrease in tumor-infiltrating OVA-specific CD8+ T cells as a percentage of tumor cells in mice receiving GL261-OVA plus monocytes compared with GL261-OVA alone. (C) Bar graph showing trend to decreased tumor-infiltrating leukocytes (CD45+) as a percentage of tumor cells in mice receiving GL261-OVA plus monocytes compared with GL261-OVA alone. (D) Bar graph showing significant decrease in CD8+ T-cell frequency among tumor-infiltrating CD45+ leukocytes in mice receiving GL261-OVA plus monocytes compared with GL261-OVA alone. N = 3 per group. *P < .05. **P < .01.

References

    1. Stupp R, Mason WP, van den Bent MJ, et al. Radiotherapy plus concomitant and adjuvant temozolomide for glioblastoma. N Engl J Med. 2005;352(10):987–996. - PubMed
    1. Liau LM, Prins RM, Kiertscher SM, et al. Dendritic cell vaccination in glioblastoma patients induces systemic and intracranial T-cell responses modulated by the local central nervous system tumor microenvironment. Clin Cancer Res. 2005;11(15):5515–5525. - PubMed
    1. Sampson JH, Heimberger AB, Archer GE, et al. Immunologic escape after prolonged progression-free survival with epidermal growth factor receptor variant III peptide vaccination in patients with newly diagnosed glioblastoma. J Clin Oncol. 2010;28(31):4722–4729. - PMC - PubMed
    1. Parney IF, Farr-Jones MA, Chang LJ, et al. Human glioma immunobiology in vitro: implications for immunogene therapy. Neurosurgery. 2000;46(5):1169–1177; discussion 1177–1178. - PubMed
    1. Parsa AT, Waldron JS, Panner A, et al. Loss of tumor suppressor PTEN function increases B7-H1 expression and immunoresistance in glioma. Nat Med. 2007;13(1):84–88. - PubMed

Publication types