. 2015 May;33(5):1577-88.
doi: 10.1002/stem.1943.

Age-Associated Increase in BMP Signaling Inhibits Hippocampal Neurogenesis

Affiliations

Age-Associated Increase in BMP Signaling Inhibits Hippocampal Neurogenesis

Hanadie Yousef et al. Stem Cells. 2015 May.

Abstract

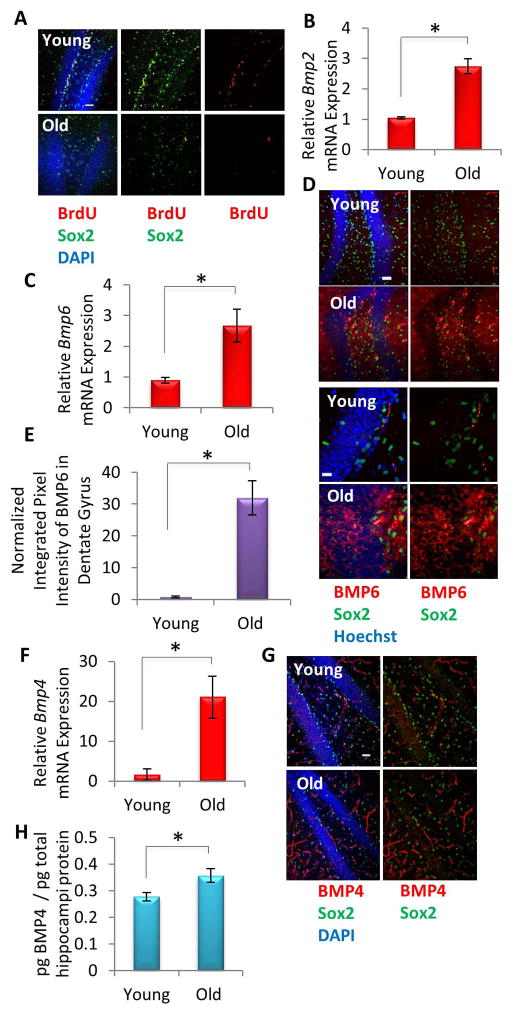
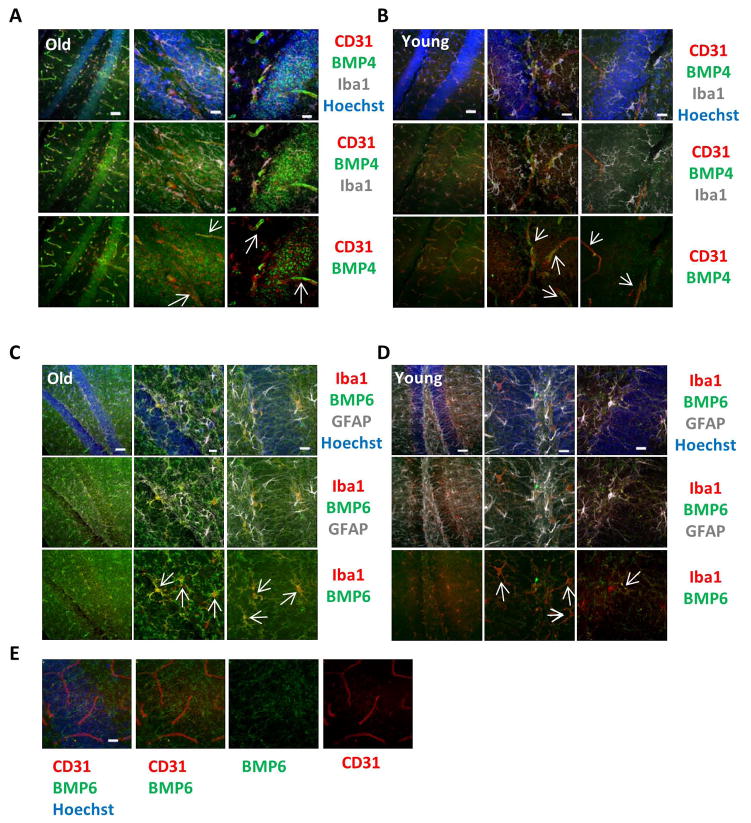
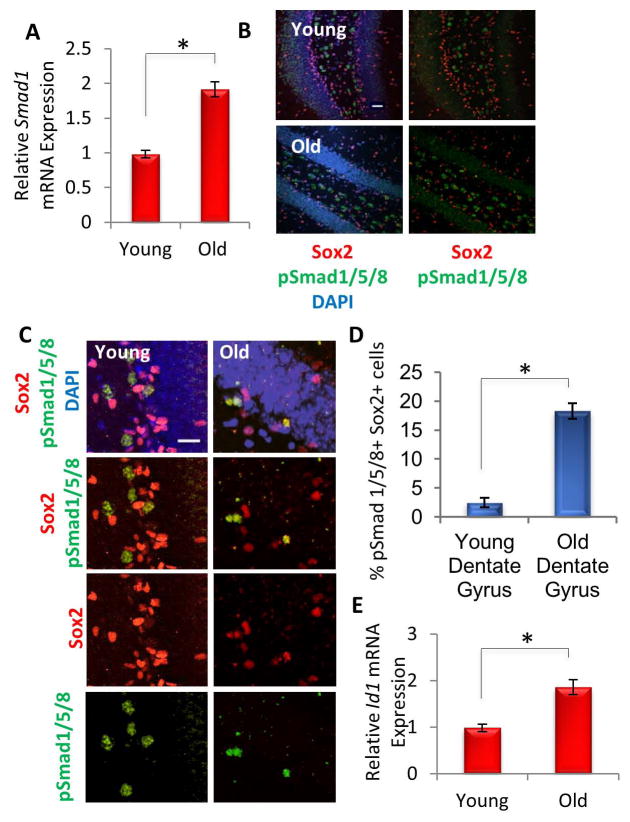
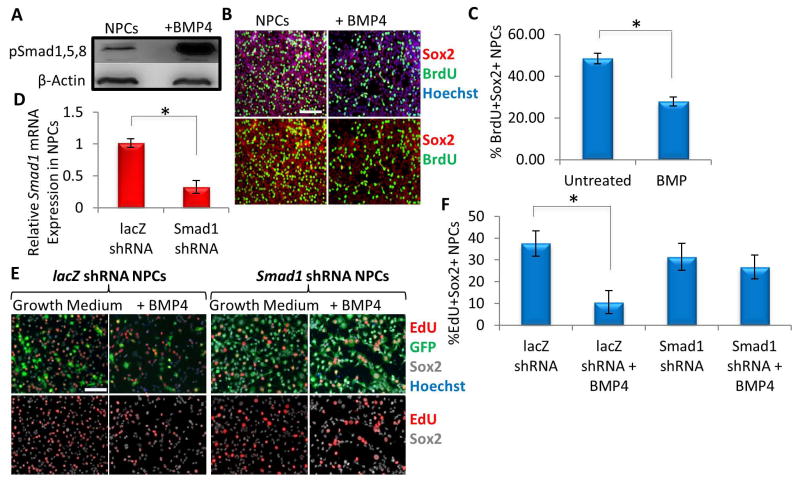
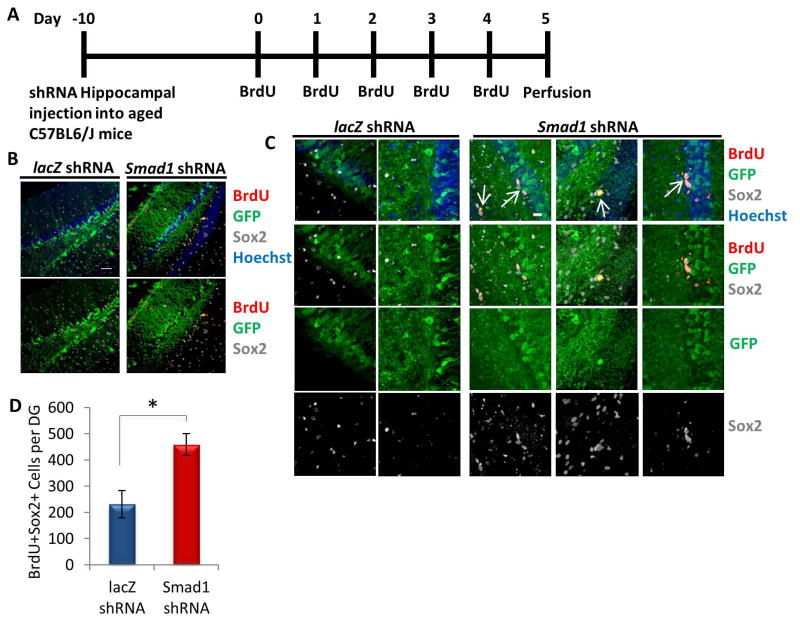
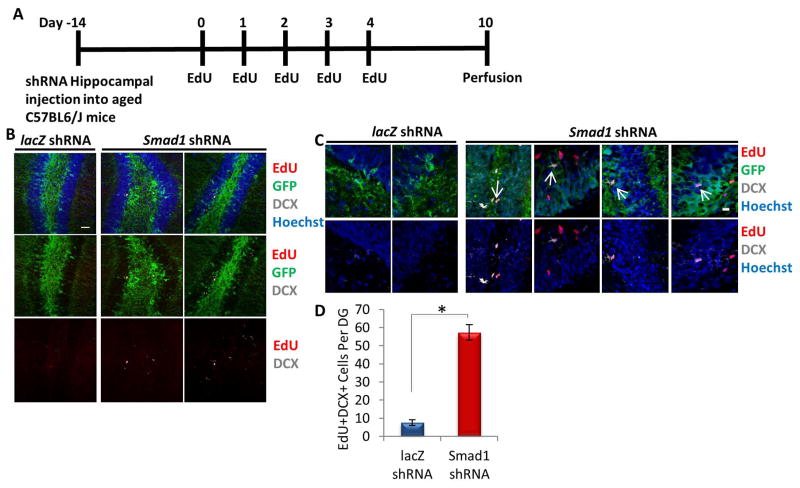
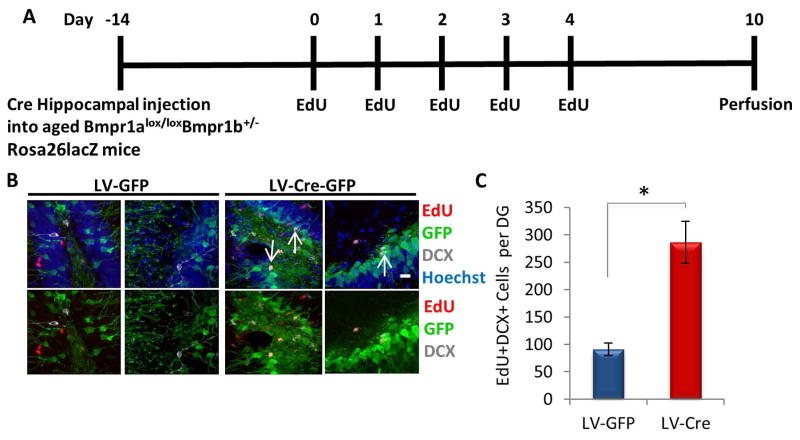
Hippocampal neurogenesis, the product of resident neural stem cell proliferation and differentiation, persists into adulthood but decreases with organismal aging, which may contribute to the age-related decline in cognitive function. The mechanisms that underlie this decrease in neurogenesis are not well understood, although evidence in general indicates that extrinsic changes in an aged stem cell niche can contribute to functional decline in old stem cells. Bone morphogenetic protein (BMP) family members are intercellular signaling proteins that regulate stem and progenitor cell quiescence, proliferation, and differentiation in various tissues and are likewise critical regulators of neurogenesis in young adults. Here, we establish that BMP signaling increases significantly in old murine hippocampi and inhibits neural progenitor cell proliferation. Furthermore, direct in vivo attenuation of BMP signaling via genetic and transgenic perturbations in aged mice led to elevated neural stem cell proliferation, and subsequent neurogenesis, in old hippocampi. Such advances in our understanding of mechanisms underlying decreased hippocampal neurogenesis with age may offer targets for the treatment of age-related cognitive decline.

Keywords: Adult stem cells; Aging; BMP signaling; Neural stem cell; Neurogenesis; Proliferation; Stem cell-microenvironment interactions.


Conflict of interest statement

There are no conflict of interests.

Figures

Figure 1
Figure 1. BMPs Increase with Age Locally in Mice Hippocampi
(A) Young (2 month) and old (24 month) mice (n=3) were given daily IP injections of BrdU for 5 days, followed by perfusion and PFA fixation. Immunofluorescence (IF) was performed for Sox2 (green) and BrdU (red), with Dapi (blue) labeling all nuclei. Representative images are shown. Scale bar = 100 μM (B) Quantification of Bmp2 mRNA expression by qRT-PCR performed on RNA extracted from young and old hippocampi. The relative expression levels were normalized to GAPDH and presented relative to that of young hippocampi. Significant differences were identified by Student’s t-tests (*p<0.008). Error bars indicate standard error of the mean (n=4 mice per group). (C) qRT-PCR quantification of Bmp6 mRNA was performed on RNA extracted from young and old hippocampi. The expression levels were normalized to GAPDH and presented relative to that of young hippocampi. Significant differences were identified by Student’s t-tests (*p<0.05). Error bars indicate standard error of the mean (n=5 young, 4 old). (D) Immunofluorescence was performed on perfused young and old brain tissue sections (n=3 young, 3 old) for Sox2 (green) and BMP6 (red), with Hoechst (blue) labeling all nuclei. Representative low and high magnification images are shown. Scale bar = 50 μM (E) Integrated pixel intensity of BMP6 immunofluorescence in young and old dentate gyri tissue sections was calculated using ImageJ. Pixel intensities are presented relative to young dentate gyri. Significant differences were identified by Student’s t-tests (*p<0.003). Error bars indicate standard error of the mean (n=3 young, 3 old). (F) qRT-PCR quantification of Bmp4 mRNA was performed on RNA extracted from young and old hippocampi. The expression levels were normalized to GAPDH and presented relative to that of young hippocampi. Significant differences were identified by unpaired Student’s t-tests (*p<0.05). Error bars indicate standard error of the mean (n=3 young, 3 old mice per group). (G) Immunofluorescence was performed on perfused young and old brain tissue sections (n=3), for Sox2 (green) and BMP4 (red), with DAPI (blue) labeling all nuclei. Representative images are shown. Scale bar = 50 μM (H) An ELISA was performed on young and old hippocampal protein lysate to assess the level of BMP4. Significant differences were identified by Student’s t-tests (*p<0.05), and error bars indicate standard error of the mean (n=5 young, 5 old).
Figure 2
Figure 2. BMP4 and BMP6 colocalization with endothelial cells or microglia
(A) Immunofluorescence was performed on perfused old and young brain tissue sections for BMP4 (green), CD31 (red), and Iba1 (gray), with Hoechst (blue) labeling all nuclei. Representative low and high magnification images are shown. Scale bars = 50 μm. Arrows indicate areas of BMP4 and CD31 colocalization. (B) Immunofluorescence was performed on perfused old and young brain tissue sections for BMP6 (green), Iba1 (red), and GFAP (gray), with Hoechst (blue) labeling all nuclei. Representative low and high magnification images are shown. Scale bars = 50 μm. Arrows indicate areas of BMP6 and Iba1 colocalization. (C) Immunofluorescence was performed on perfused young brain tissue sections for BMP6 (green) and CD31 (red), with Hoechst (blue) labeling all nuclei. Representative high magnification images are shown and indicate there is no colocalization of BMP6 with endothelium. Scale bars = 50 μm.
Figure 3
Figure 3. Downstream effectors of BMP Signaling increase with Age in Mice Hippocampi
(A) qRT-PCR quantification of Smad1 mRNA expression in young and old hippocampi. The relative expression levels were normalized to GAPDH and presented relative to that of young hippocampi. Significant differences were identified by Student’s t-tests (*p<0.01), and error bars indicate the standard error of the mean (n=3). (B) Immunofluorescence was performed on young and old brain tissue sections (n=4) for pSmad1/5/8 (green) and Sox2 (red), with DAPI (blue) labeling all nuclei. Representative images are shown. Scale bar = 100 μM (C) Representative high magnification images of brain sections stained for pSmad1/5/8 (green) and Sox2 (red), with DAPI (blue) labeling all nuclei. Scale bar = 50 μM (D) Quantification of the percentage of pSmad1/5/8+ Sox2+ neural stem and progenitor cells in the denate gyrus demonstrates an increase with age in BMP signaling to NPCs. Significant differences were identified by Student’s t-tests (*p<0.01), and error bars indicate the standard deviation (n=4) (E) qRT-PCR quantification of Id1 mRNA levels in RNA extracted from young and old hippocampi. The relative expression levels were normalized to GAPDH and presented relative to that of young hippocampi. Significant differences were identified by Student’s t-tests (*p<0.02), and error bars indicate the standard error of the mean (n=4).
Figure 4
Figure 4. BMP inhibits neural progenitor cell proliferation
(A) Immunoblotting analysis shows that BMP4 (50 ng/mL) addition for 30 minutes activated its downstream effectors pSmad1/5/8 in rNPCs cultured in growth medium (DMF12 + N2 + 10 ng/mL FGF2). Protein loading was normalized to β-actin (B) Functional validation of increasing BMP4. Primary rNPCs were cultured in growth medium in the presence or absence of BMP4 (100 ng/mL) for 24 hrs. A 2 hour BrdU (10 μM) pulse was performed before cell fixation to label proliferating cells. Immunofluorescence was performed for BrdU (green) and Sox2 (red), with Hoechst (blue) labeling all nuclei. Representative images are shown. Scale bar = 100 μM (C) Proliferation of rNPCs were quantified by cell scoring in 25 random fields of each condition using an automated imager and MetaXpress cell scoring software. Results are displayed as the mean percent of BrdU+ proliferating rNPCs +/−SD, respectively. Significant differences were identified by Student’s t-tests (*p< 0.001), and error bars indicate the standard deviation (n=4). (D) Quantification of Smad1 mRNA expression by qRT-PCR was performed on RNA extracted from mNPCs transduced with shRNA to Smad1 or control virus and passaged for 2 weeks. The relative cDNA expression level was normalized to GAPDH and presented relative to that of mNPCs transduced with lacZ shRNA lentivirus. Significant differences were identified by Student’s t-tests (*p<0.05). Error bars indicate standard deviation (n=3). (E) rNPCs were transduced with control or Smad1 shRNA lentivirus. 72 hours post transduction, cells were cultured for 16 hours in growth medium (containing FGF2) in the presence or absence of BMP4 (200 ng/mL). A 4 hour EdU (30 μM) pulse was performed before cell fixation to label proliferating cells. Immunofluorescence was performed for GFP (green), EdU (red) and Sox2 (gray), with Hoechst (blue) labeling all nuclei. Representative images are shown. Scale bar = 100 μM. (F) Proliferation of rNPCs were quantified by cell scoring in 36 random fields of each condition using an automated imager and MetaXpress cell scoring software. Results are displayed as the mean percent of EdU+ proliferating rNPCs +/−SD, respectively. Significant differences were identified by Student’s t-tests (*p< 2 x1034), and error bars indicate the standard deviation (n=36 technical replicates, with 4 biological replicates per condition).
Figure 5
Figure 5. Increase in NPC proliferation in aged hippocampi by in vivo genetic inhibition of pSmad1
(A) Schematic of stereotaxic lentiviral injection experiment. Aged (18 month old) mice received stereotaxic injections into hippocampi (coordinates from bregma: AP: −2.12, ML: +/−1.5, VD: −1.55) of lentiviral vectors delivering either shRNA against Smad1 or shRNA against lacZ. The mice were allowed to recover for 10 days, followed by daily BrdU (50 mg/kg) intraperitonial injections for 5 days. Mice were perfused the morning after the last BrdU injection (Day 5). (B) Brain sections of lacZ or Smad1 shRNA injected mice (n=5 lacZ shRNA, 4 Smad1 shRNA) spanning the entire hippocampus were immunostained with GFP (green), BrdU (red), and Sox2 (gray), with Hoechst (blue) labeling cell nuclei. Representative images are shown. Scale bar = 50 μM. (C) Representative high magnification of immunostaining of the subgranular zone of the dentate gyrus.. Scale bar = 50 μM. Arrows indicate Sox2+BrdU+ proliferating NPCs in the SGZ of Smad1 shRNA injected mice. (D) Smad1 shRNA increases the number of BrdU+Sox2+ cells per GFP+ aged murine dentate gyrus. Significant differences were identified by Student’s t-tests (*p<0.04). Error bars indicate standard error of the mean (n=5 lacZ shRNA, 4 Smad1 shRNA brains)
Figure 6
Figure 6. Increase of type 2b cell proliferation in aged hippocampi by in vivo genetic inhibition of Smad1
(A) Schematic of injection experiment. Aged (18 month old) mice received stereotaxic injections into hippocampi (coordinates from bregma: AP: −2.12, ML: +/−1.5, VD: −1.55) of lentiviral vectors delivering either shRNA against Smad1 or shRNA against lacZ. The mice were allowed to recover for 14 days, followed by daily EdU (50 mg/kg) intraperitonial injections for 5 days. Five days after the last EdU injection, mice were saline and 4% PFA perfused. (B) Brain sections of lacZ or Smad1 shRNA injected mice (n=3 lacZ shRNA, 5 Smad1 shRNA) spanning the entire hippocampus were immunostained with GFP (green), EdU (red) and DCX (gray), with Hoechst (blue) labeling cell nuclei. Representative images are shown. Scale bar = 50 μM. (C) Representative high magnification images are shown. Scale bar = 50 μM. Arrows indicate DCX+BrdU+ proliferating neuronal precursors in the SGZ of Smad1 shRNA injected mice. (D) Smad1 shRNA increases the number of EdU+DCX+GFP+ cells in aged murine dentate gyri. Significant differences were identified by unpaired Student’s t-tests (*p<0.0002), and Mann Whitney value of *p<0.04. Error bars indicate standard error of the mean (n=3 lacZ shRNA, 5 Smad1 shRNA).
Figure 7
Figure 7. Increase in type 2b cell proliferation in aged hippocampi by in vivo Cre-mediated Bmpr1a deletion
(A) Schematic of stereotaxic lentiviral vector injection experiment. Aged (18–22 month old) Bmpr1alox/lox Bmpr1b+/− Rosa26lacZ mice received stereotaxic injections into hippocampi (coordinates from bregma: AP: −2.12, ML: +/−1.5, VD: −1.55) of lentiviral vectors encoding either Cre-GFP or GFP. The mice were allowed to recover for 14 days, followed by daily EdU (50 mg/kg) intraperitonial injections for 5 days. Mice were saline and PFA perfused 5 days after the last EdU injection (Day 10). (B) Brain sections of Cre or GFP injected mice (n=5) spanning the entire hippocampus were immunostained with GFP (green), EdU (red), and DCX (gray), with Hoechst (blue) labeling cell nuclei. Representative images are shown. Scale bar = 50 μM. Arrows indicate DCX+BrdU+ proliferating NPCs in the SGZ of Cre injected mice. (C) Cre-induced deletion of Bmpr1a increases the number of EdU+DCX+ cells in GFP+ aged murine dentate gyri. Significant differences were identified by Student’s t-tests (*p<0.03). Error bars indicate standard error of the mean (n=5 per group).

References

    1. Ming G, Song H. Adult neurogenesis in the mammalian central nervous system. [Accessed October 17, 2013];ANNU REV NEUROSCI. 2005 28:223–50. Available at: http://www.ncbi.nlm.nih.gov/pubmed/16022595. - PubMed
    1. Deng W, Aimone JB, Gage FH. New neurons and new memories: how does adult hippocampal neurogenesis affect learning and memory? NAT REV NEUROSCI. 2010;11(5):339–350. Available at: http://dx.doi.org/10.1038/nrn2822. - DOI - PMC - PubMed
    1. Deng W, Saxe MD, Gallina IS, et al. Adult-born hippocampal dentate granule cells undergoing maturation modulate learning and memory in the brain. [Accessed October 20, 2013];J NEUROSCI. 2009 29(43):13532–42. Available at: http://www.pubmedcentral.nih.gov/articlerender.fcgi?artid=2787190&tool=p.... - PMC - PubMed
    1. Oboti L, Savalli G, Giachino C, et al. Integration and sensory experience-dependent survival of newly-generated neurons in the accessory olfactory bulb of female mice. EUR J NEUROSCI. 2009;29(4):679–692. Available at: http://dx.doi.org/10.1111/j.1460-9568.2009.06614.x. - DOI - PubMed
    1. Maslov AY, Barone Ta, Plunkett RJ, et al. Neural stem cell detection, characterization, and age-related changes in the subventricular zone of mice. [Accessed October 26, 2013];J NEUROSCI. 2004 24(7):1726–33. Available at: http://www.ncbi.nlm.nih.gov/pubmed/14973255. - PMC - PubMed

Publication types