Review
. 2014 Dec 5:7:97.
doi: 10.3389/fnmol.2014.00097. eCollection 2014.

Monitoring activity in neural circuits with genetically encoded indicators

Affiliations
Review

Monitoring activity in neural circuits with genetically encoded indicators

Gerard J Broussard et al. Front Mol Neurosci. .

Abstract

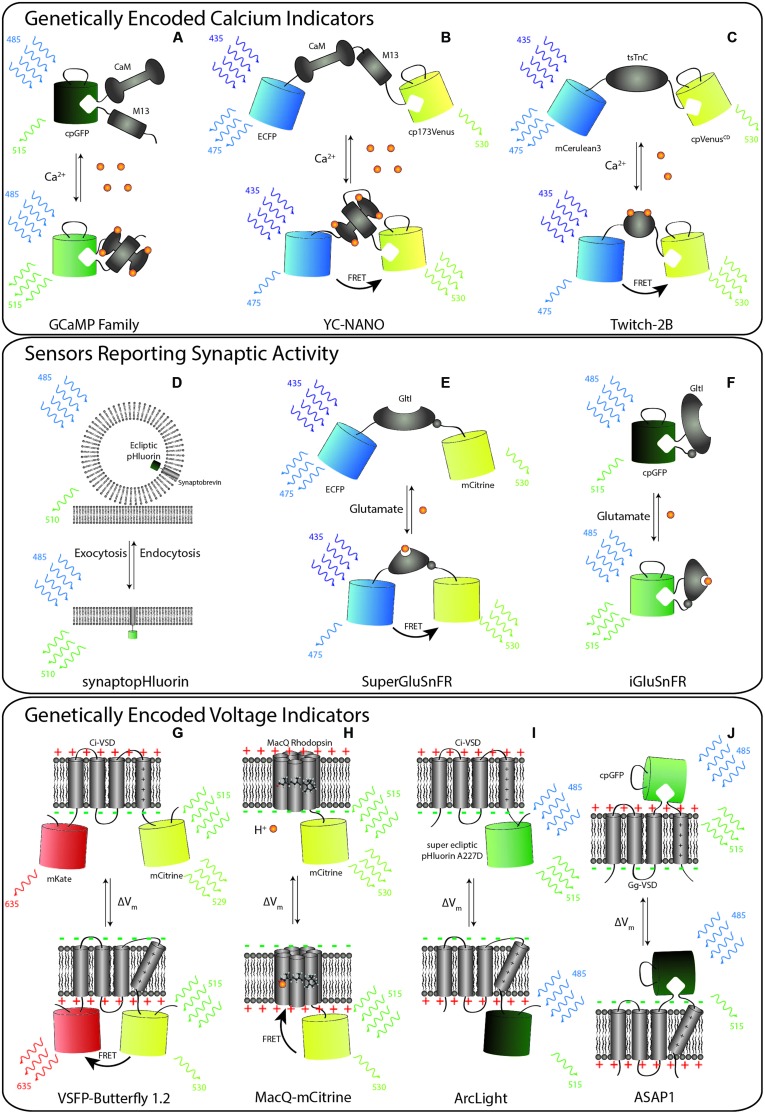
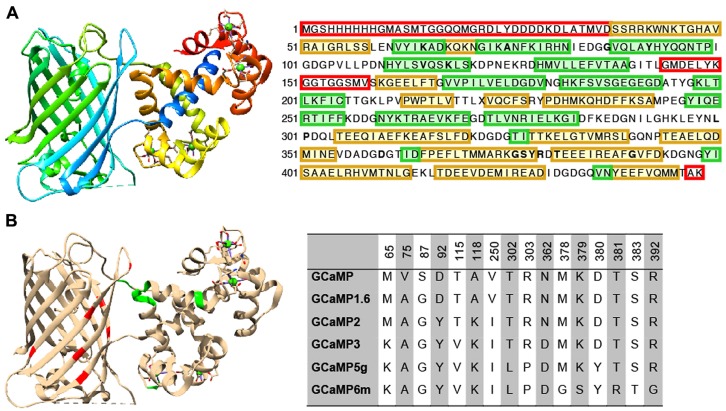
Recent developments in genetically encoded indicators of neural activity (GINAs) have greatly advanced the field of systems neuroscience. As they are encoded by DNA, GINAs can be targeted to genetically defined cellular populations. Combined with fluorescence microscopy, most notably multi-photon imaging, GINAs allow chronic simultaneous optical recordings from large populations of neurons or glial cells in awake, behaving mammals, particularly rodents. This large-scale recording of neural activity at multiple temporal and spatial scales has greatly advanced our understanding of the dynamics of neural circuitry underlying behavior-a critical first step toward understanding the complexities of brain function, such as sensorimotor integration and learning. Here, we summarize the recent development and applications of the major classes of GINAs. In particular, we take an in-depth look at the design of available GINA families with a particular focus on genetically encoded calcium indicators (GCaMPs), sensors probing synaptic activity, and genetically encoded voltage indicators. Using the family of the GCaMP as an example, we review established sensor optimization pipelines. We also discuss practical considerations for end users of GINAs about experimental methods including approaches for gene delivery, imaging system requirements, and data analysis techniques. With the growing toolbox of GINAs and with new microscopy techniques pushing beyond their current limits, the age of light can finally achieve the goal of broad and dense sampling of neuronal activity across time and brain structures to obtain a dynamic picture of brain function.

Keywords: calcium sensor; genetically encoded sensors; in vivo imaging; mammalian and rodent brain; neural activity; synaptic activity reporter; voltage sensor.


Figures

FIGURE 1
FIGURE 1
Schematic representation of selected members of genetically encoded indicators of neural activity (GINA). (A–C) Calcium indicators. (A) GCaMP6 consists of circularly permuted green fluorescent protein (cpGFP) inserted between calmodulin (CaM) and an M13 peptide. Upon calcium binding, conformational changes in the CaM–M13 complex induce fluorescence changes in the circularly permuted enhanced green fluorescent protein (cpEGFP). (B) YC-Nano contains CaM–M13 complex sandwiched between the donor FP (ECFP) to the acceptor FP (cp173Venus). Upon calcium binding, conformational changes of CaM–M13 complex increases Förster resonance energy transfer (FRET) between the FP pair. The result is an increase in the ratio of the fluorescence in the yellow to blue channels. (C) Likewise, Twitch-2B increases FRET upon calcium being bound by its calcium sensitive domain, tsTnC. (D–F) GINAs reporting synaptic activity. (D) SynaptopHluorin consists of a ecliptic pHluorin FP fused to the C-terminus of the vesicular protein. Vesicular release places the FP in the low pH environment of the extracellular space, which leads to the deprotonation of the fluorophore and increases pHluorin fluorescence. (E) SuperGluSnFR is a linear fusion of CFP, the Escherichia coli glutamate binding domain, GltI, and mCitrine. Upon glutamate binding, the conformational changes of GltI result in FRET between CFP to mCitrine. (F) iGluSnFR contains a cpGFP fused to the glutamate binding domain. The conformation changes of Gltl induced upon glutamate binding results in deprotonation and increased fluorescence of cpGFP. (G–J) Genetically encoded voltage indicators. (G) Upon membrane depolarization, the voltage-sensing domain of Ci-VSP enters its activated state. The FPs of voltage sensitive fluorescent protein (VSFP)-Butterfly 1.2 are thus drawn into close proximity to one another, increasing FRET. (H) The opsin-based MacQ-mCitrine reduces fluorescence output upon membrane depolarization. This effect is driven by enhanced FRET from the mCitrine FP to the weakly fluorescent retinal caused by a shift in the cofactor absorption spectrum upon protonation of the Schiff base. (I) ArcLight consists of Ci-VSD and super ecliptic pHluorin carrying the point mutation A227D. Depolarization of the membrane results in a decrease in the fluorescence output of the pHluorin, but the mechanism of this change remains elusive. (J) ASAP-1 contains cpGFP fused into an extracellular linker (S3–S4 linker) of the Gag-VSP voltage sensitive domain. Depolarization quenches the fluorescence of the cpGFP.
FIGURE 2
FIGURE 2
Structure and beneficial mutations of GCaMPs. (A) Crystal structure (Ding et al., 2014) and primary sequence of GCaMP6m. Distinct regions of the crystal structure are indicated by color. The cooler the color, the closer the sequence is to N-terminus. The primary sequence is annotated such that yellow shading corresponds to ß-strands, green shading corresponds to α-helices, and residues in red are those that do not crystallize (i.e., pRSET domain and linkers). (B) Beneficial mutations of GCaMPs. Crystal structure of GCaMP6m is annotated with iteratively evolved residues. Red residues are from the cpGFP and green ones are from calmodulin. Note that these residues are typically at the interface between the two domains. Residue matrix shows the evolution of GCaMP lineage with incrementally improved performance. Individual beneficial residues are highlighted in the primary sequence of GCaMP6m in (A).

References

    1. Ahrens K. F., Heider B., Lee H., Isacoff E. Y., Siegel R. M. (2012). Two-photon scanning microscopy of in vivo sensory responses of cortical neurons genetically encoded with a fluorescent voltage sensor in rat. Front. Neural Circuits. 6:15 10.3389/fncir.2012.00015 - DOI - PMC - PubMed
    1. Ai H. W., Baird M. A., Shen Y., Davidson M. W., Campbell R. E. (2014). Engineering and characterizing monomeric fluorescent proteins for live-cell imaging applications. Nat. Protoc. 9 910–928 10.1038/nprot.2014.054 - DOI - PubMed
    1. Akemann W., Mutoh H., Perron A., Rossier J., Knöpfel T. (2010). Imaging brain electric signals with genetically targeted voltage-sensitive fluorescent proteins. Nat. Methods 7 643–649 10.1038/nmeth.1479 - DOI - PubMed
    1. Akemann W., Sasaki M., Mutoh H., Imamura T., Honkura N., Knöpfel T. (2013). Two-photon voltage imaging using a genetically encoded voltage indicator. Sci. Rep. 3 2231 10.1038/srep02231 - DOI - PMC - PubMed
    1. Akerboom J., Carreras Calderón N., Tian L., Wabnig S., Prigge M., Tolö J., et al. (2013). Genetically encoded calcium indicators for multi-color neural activity imaging and combination with optogenetics. Front. Mol. Neurosci. 6:2 10.3389/fnmol.2013.00002 - DOI - PMC - PubMed