

The microbes we eat: abundance and taxonomy of microbes consumed in a day's worth of meals for three diet types
- PMID: 25538865
- PMCID: PMC4266855
- DOI: 10.7717/peerj.659
The microbes we eat: abundance and taxonomy of microbes consumed in a day's worth of meals for three diet types
Abstract
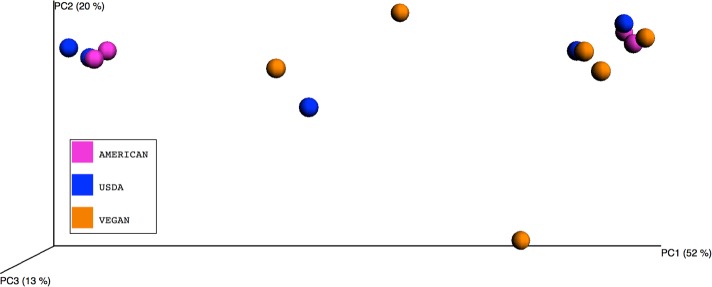
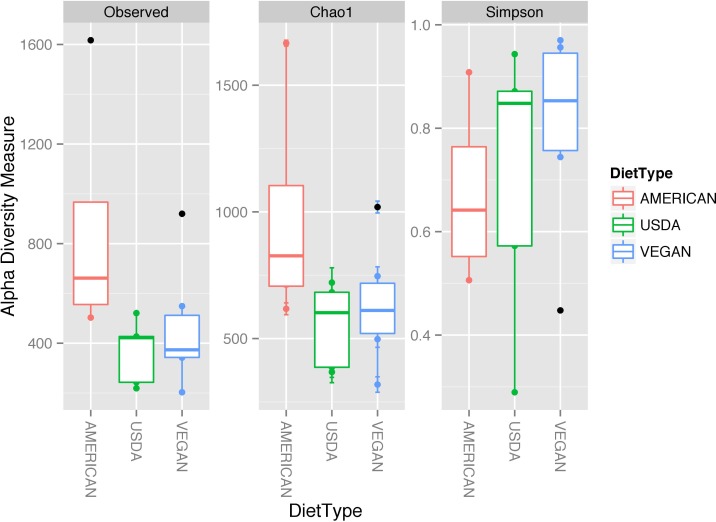
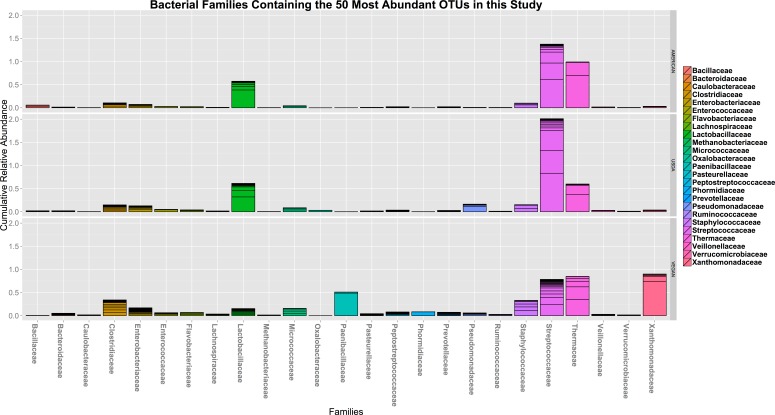
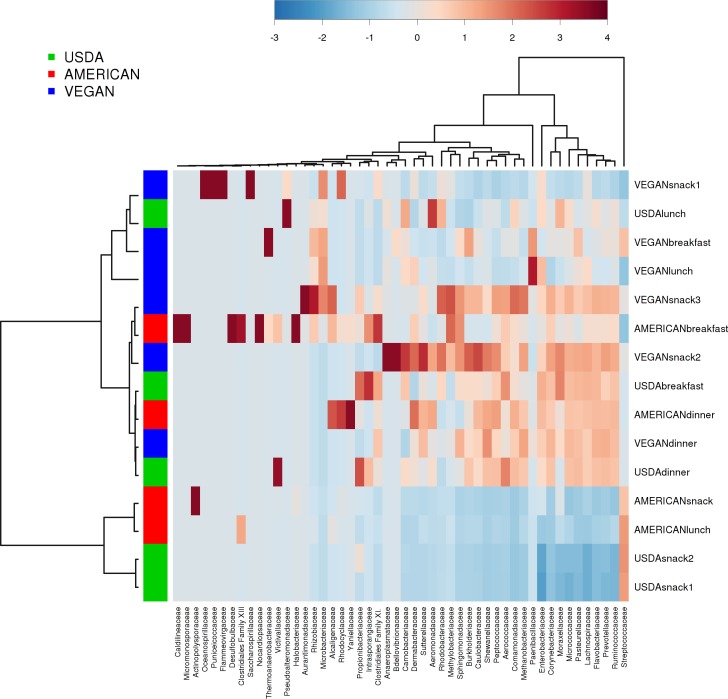
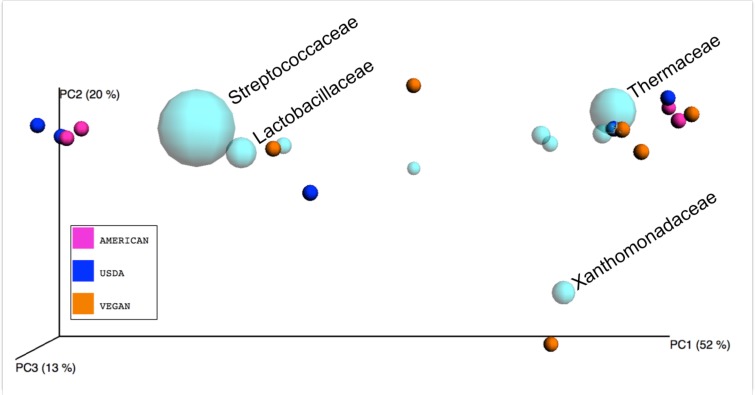
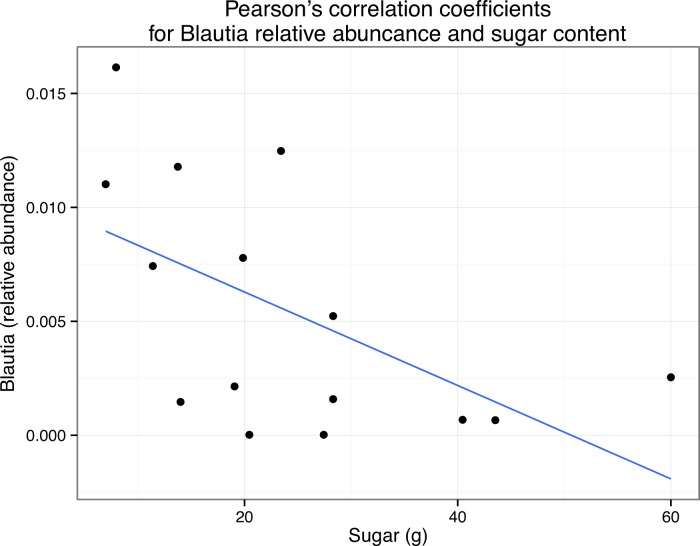
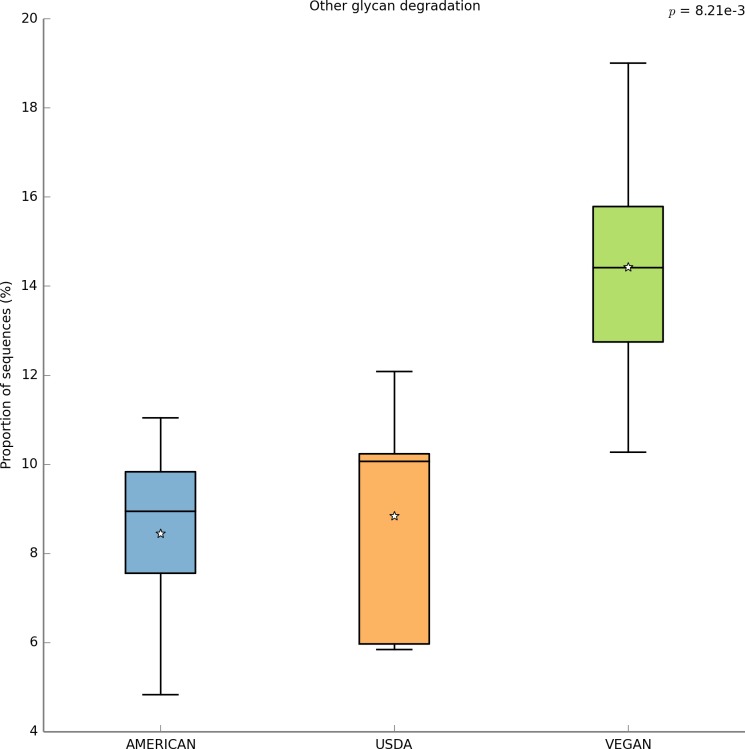
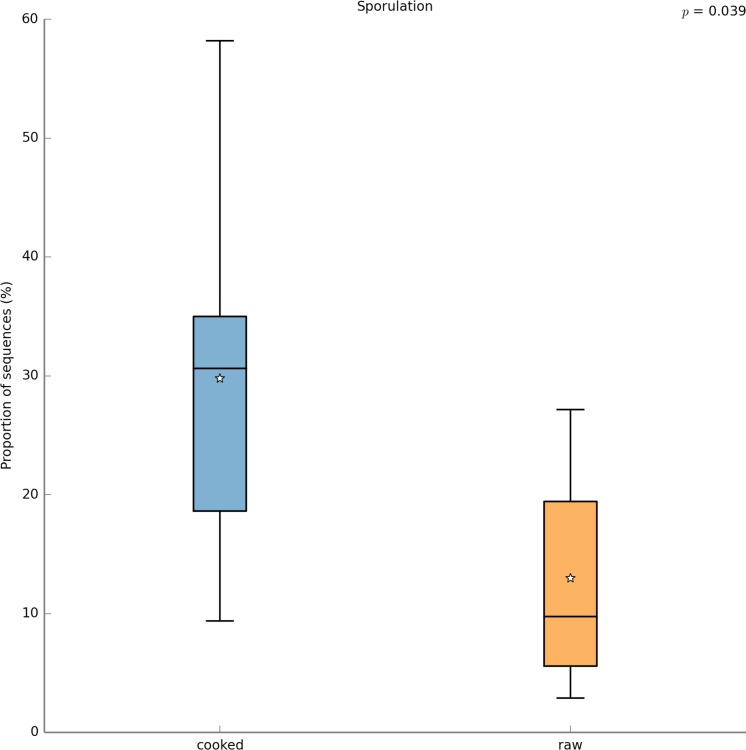
Far more attention has been paid to the microbes in our feces than the microbes in our food. Research efforts dedicated to the microbes that we eat have historically been focused on a fairly narrow range of species, namely those which cause disease and those which are thought to confer some "probiotic" health benefit. Little is known about the effects of ingested microbial communities that are present in typical American diets, and even the basic questions of which microbes, how many of them, and how much they vary from diet to diet and meal to meal, have not been answered. We characterized the microbiota of three different dietary patterns in order to estimate: the average total amount of daily microbes ingested via food and beverages, and their composition in three daily meal plans representing three different dietary patterns. The three dietary patterns analyzed were: (1) the Average American (AMERICAN): focused on convenience foods, (2) USDA recommended (USDA): emphasizing fruits and vegetables, lean meat, dairy, and whole grains, and (3) Vegan (VEGAN): excluding all animal products. Meals were prepared in a home kitchen or purchased at restaurants and blended, followed by microbial analysis including aerobic, anaerobic, yeast and mold plate counts as well as 16S rRNA PCR survey analysis. Based on plate counts, the USDA meal plan had the highest total amount of microbes at 1.3 × 10(9) CFU per day, followed by the VEGAN meal plan and the AMERICAN meal plan at 6 × 10(6) and 1.4 × 10(6) CFU per day respectively. There was no significant difference in diversity among the three dietary patterns. Individual meals clustered based on taxonomic composition independent of dietary pattern. For example, meals that were abundant in Lactic Acid Bacteria were from all three dietary patterns. Some taxonomic groups were correlated with the nutritional content of the meals. Predictive metagenome analysis using PICRUSt indicated differences in some functional KEGG categories across the three dietary patterns and for meals clustered based on whether they were raw or cooked. Further studies are needed to determine the impact of ingested microbes on the intestinal microbiota, the extent of variation across foods, meals and diets, and the extent to which dietary microbes may impact human health. The answers to these questions will reveal whether dietary microbes, beyond probiotics taken as supplements-i.e., ingested with food-are important contributors to the composition, inter-individual variation, and function of our gut microbiota.
Keywords: 16S; Bioinformatics; Food microbiology; Illumina amplicon sequencing; Microbial communities; Microbial ecology; Microbiome; Microbiota; PICRUSt; QIIME.
Figures
References
-
- Arumugam M, Raes J, Pelletier E, Le Paslier D, Yamada T, Mende DR, Fernandes GR, Tap J, Bruls T, Batto J-M, Bertalan M, Borruel N, Casellas F, Fernandez L, Gautier L, Hansen T, Hattori M, Hayashi T, Kleerebezem M, Kurokawa K, Leclerc M, Levenez F, Manichanh C, BjNielsen H, Nielsen T, Pons N, Poulain J, Qin J, Sicheritz-Ponten T, Tims S, Torrents D, Ugarte E, Zoetendal EG, Wang J, Guarner F, Pedersen O, de Vos WM, Brunak S, Doré J, Antolín M, Artiguenave F, Blottiere HM, Almeida M, Brechot C, Cara C, Chervaux C, Cultrone A, Delorme C, Denariaz G, Dervyn R, Foerstner KU, Friss C, Van de Guchte M, Guedon E, Haimet F, Huber W, Van Hylckama-Vlieg J, Jamet A, Juste C, Kaci G, Knol J, Lakhdari O, Layec S, Le Roux K, Maguin E, Mérieux A, Melo Minardi R, M’rini C, Muller J, Oozeer R, Parkhill J, Renault P, Rescigno M, Sanchez N, Sunagawa S, Torrejon A, Turner K, Vandemeulebrouck G, Varela E, Winogradsky Y, Zeller G, Weissenbach J, Dusko Ehrlich S, Bork P. Enterotypes of the human gut microbiome. Nature. 2011;473:174–180. doi: 10.1038/nature09944. - DOI - PMC - PubMed
-
- Bray JR, Curtis JT. An ordination of the upland forest communities of Southern Wisconsin. Ecological Monographs. 1957;27–53:325. doi: 10.2307/1942268. - DOI
LinkOut - more resources
Full Text Sources
Other Literature Sources
