Review
. 2014 Dec;204(4):841-53.
doi: 10.1111/nph.12969.

The floral morphospace--a modern comparative approach to study angiosperm evolution

Review

The floral morphospace--a modern comparative approach to study angiosperm evolution

Marion Chartier et al. New Phytol. 2014 Dec.

Abstract

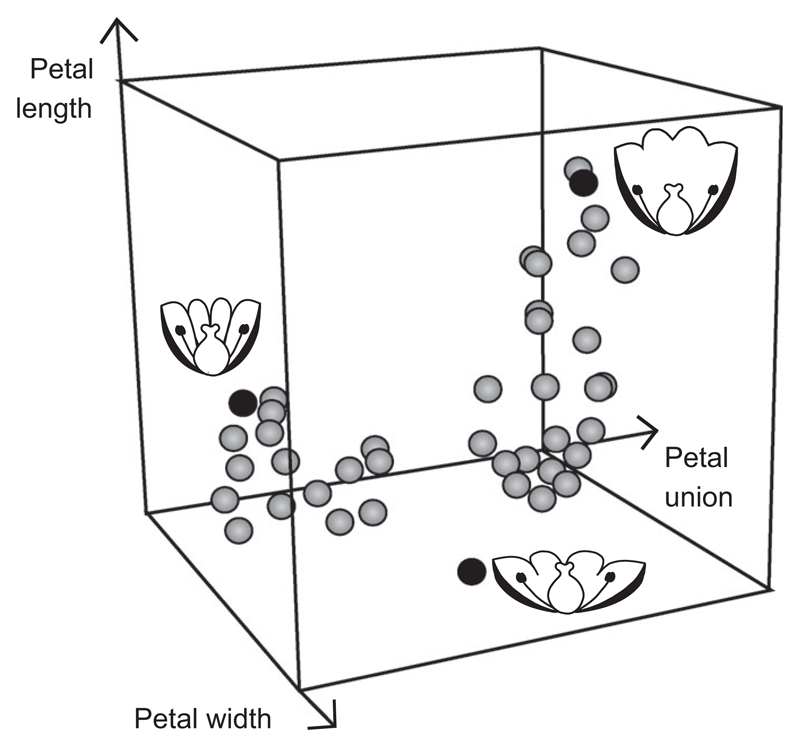
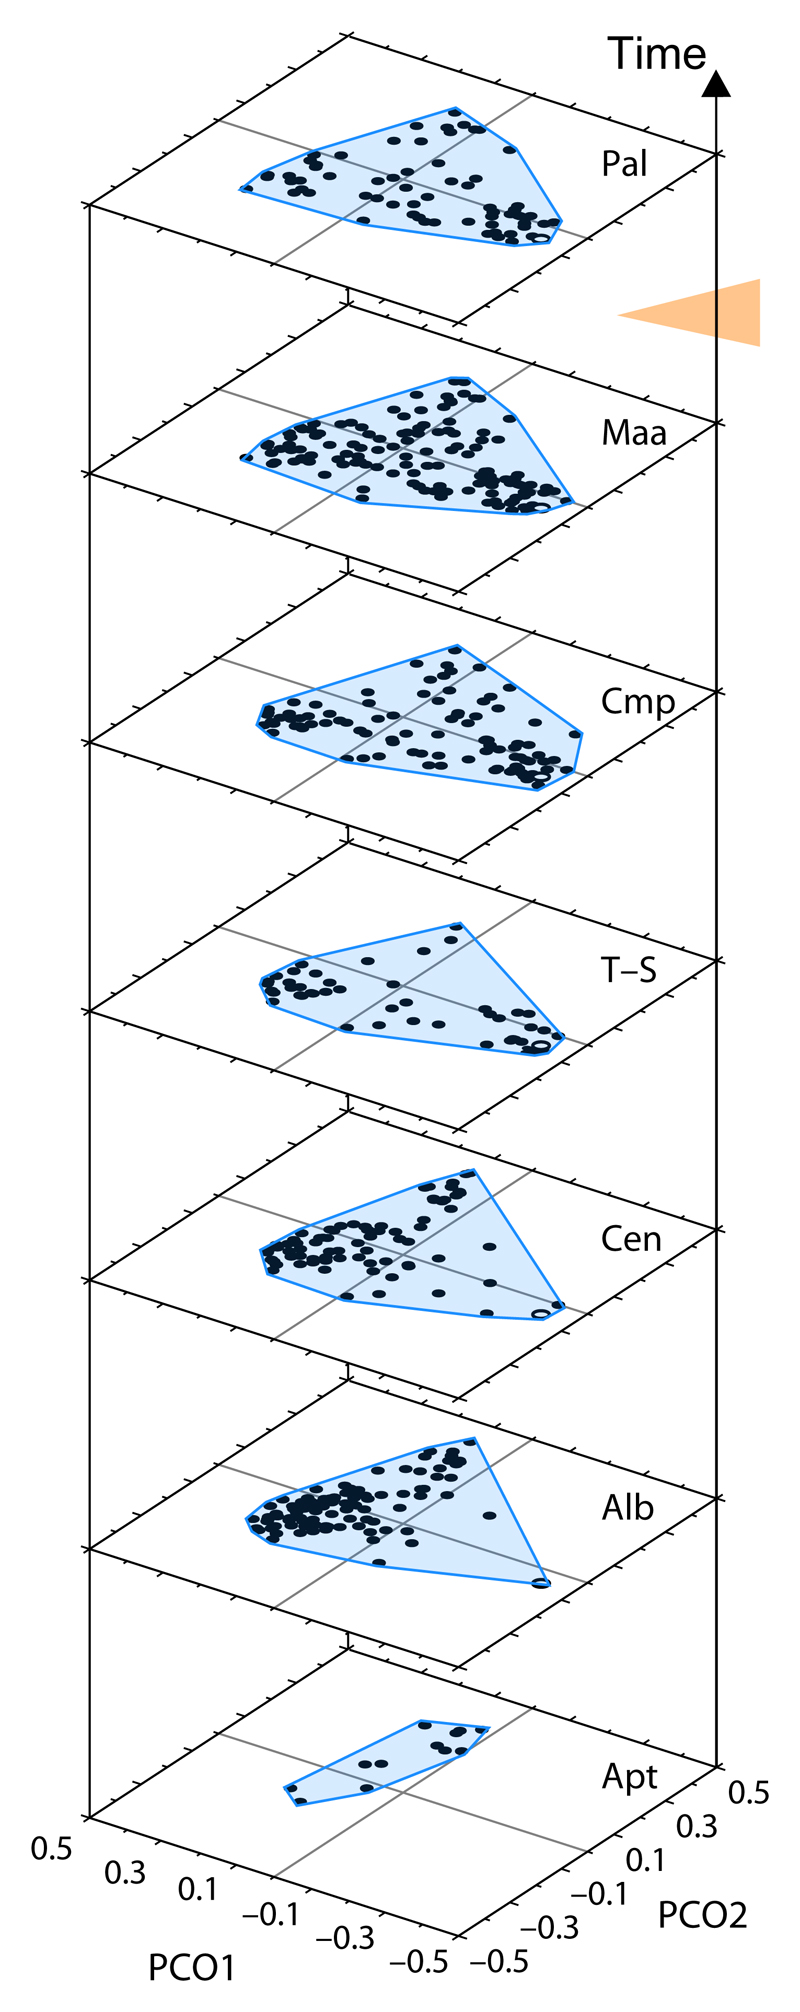
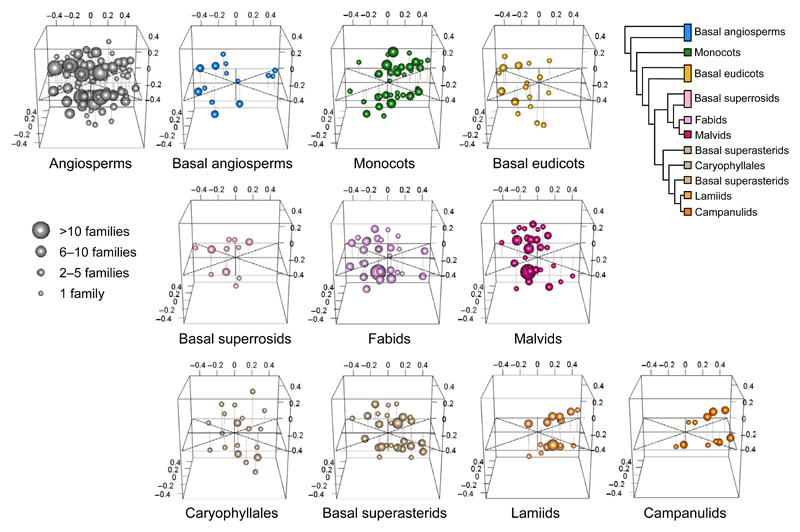
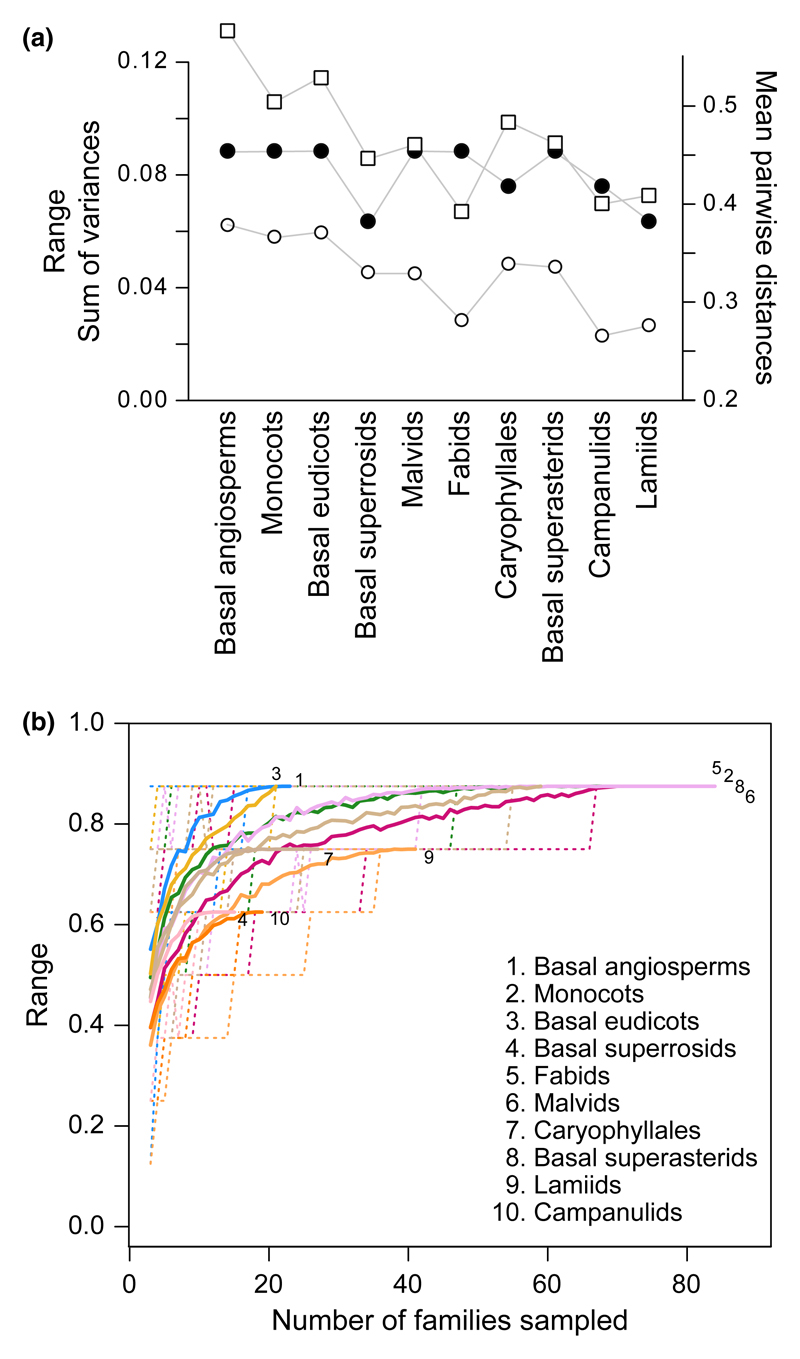
Morphospaces are mathematical representations used for studying the evolution of morphological diversity and for the evaluation of evolved shapes among theoretically possible ones. Although widely used in zoology, they--with few exceptions--have been disregarded in plant science and in particular in the study of broad-scale patterns of floral structure and evolution. Here we provide basic information on the morphospace approach; we review earlier morphospace applications in plant science; and as a practical example, we construct and analyze a floral morphospace. Morphospaces are usually visualized with the help of ordination methods such as principal component analysis (PCA) or nonmetric multidimensional scaling (NMDS). The results of these analyses are then coupled with disparity indices that describe the spread of taxa in the space. We discuss these methods and apply modern statistical tools to the first and only angiosperm-wide floral morphospace published by Stebbins in 1951. Despite the incompleteness of Stebbins’ original dataset, our analyses highlight major, angiosperm-wide trends in the diversity of flower morphology and thereby demonstrate the power of this previously neglected approach in plant science.


Figures

Fig. 1
Fig. 1
Illustration of a hypothetical 3D Euclidean flower morphospace. Each dimension is a variable describing a quantitative aspect of floral morphology (petal width, petal length, degree of petal union), and each point in this space is the position of a hypothetical flower in morphospace. Three of these flowers (black dots) are represented as sketches to illustrate that any displacement in this space that is not parallel to any of the axes can be directly interpreted as a simultaneous change in petal size and union.
Fig. 2
Fig. 2
Angiosperm pollen morphospace (built from 29 characters such as aperture type and position) through the Cretaceous and the Paleocene, based on North American fossils. The morphospace was constructed by plotting the scores of each species on the first two principal coordinate axes for each time interval. The evolution of morphospace occupation of angiosperm pollen over time is represented here by the size of the blue-shaded areas (convex hulls). Angiosperm taxonomic diversity decreased during the Cretaceous/Tertiary boundary extinction (orange arrowhead). Lupia (1999) showed that this event was not accompanied by a decrease in pollen disparity in the fossil record. Pal, Paleocene; Maa, Maastrichtian; Cmp,Campanian; T–S, Turonian to Santonian; Cen, Cenomanian; Alb, Albian; Apt, Aptian. Figure modified, with permission, from Lupia (1999) © 1999 The Paleontological Society.
Fig. 3
Fig. 3
Avian sensory color space filled with (a) 1300 reflectance data from the flowers of 876 plant species (as some flowers present several colors, several points belong to the same species); (b) reflectance data of fruits from 948 plant species. uv, l, m and s represent the maximum stimulation of uv-, long-, medium- and short-wavelength sensitivity cones of birds’ eyes. The authors showed that color diversity of fruits, measured as the volume of convex hulls in the space and corrected for the difference in sample size, was almost half the color diversity of flowers. Figure reproduced, with permission, from Stournaras et al. (2013) © 2013 John Wiley & Sons Inc.
Fig. 4
Fig. 4
Stebbins’ (1951) floral morphospace. (a) An adaptation of Stebbins’ original chart. Numbers in front of rows and on top of columns indicate characters under state ‘1’ (called ‘advanced’ in Stebbins’ article). For example, the top left square corresponds to the combination in which all characters are under state ‘0’ (called ‘primitive’ in Stebbins’ article); the square formed by the second row and the sixth column corresponds to the combination were characters 5, 4 and 6 are in state ‘1’ and all other characters are in state ‘0’; the bottom right square corresponds to the combination where all eight characters are in state ‘1’. Numbers in each square represent the number of angiosperm families for which the corresponding combination has been recorded. Combinations that were interpreted as ‘nearly impossible’ by Stebbins are highlighted in pink; the ones associated with ‘low survival’ are highlighted in orange (see Stebbins (1951) for further details and full interpretation). Figure redrawn, with permission, from Stebbins (1951) © John Wiley & Sons Inc. (b) Frequency of the 16 character states (2 per character) in angiosperm families according to Stebbins’ dataset. Each of the character states is schematized. Horizontal bars give the number of angiosperm families for which each character state was recorded by Stebbins (1951; see Supporting Information Table S1). (c) Frequency diagram of the 256 morphological character state combinations from Stebbins (1951). Binary vectors and schematizations of the six most successful combinations are given on the right part of the plot. (d) Number (N) of angiosperm families per angiosperm subgroup: as recorded in the sampling of Stebbins (1951) (blue bars) and as present in the APG III (2009); Stevens, 2001) classification (brown bars).
Fig. 5
Fig. 5
Three-dimensional nonmetric multidimensional scaling (NMDS) representation of 10 angiosperm subgroups adapted from APG III (2009; Stevens, 2001). Tree modified, with permission, from Soltis et al. (2011) © 2011 Botanical Society of America. Each plot shows in the same morphospace the particular realizations of character state combinations in one of the subgroups. Symbol size is proportional to the number of families exhibiting the corresponding combination (see legend in the figure). Raw data are from Stebbins (1951) and presented in Table S1. NMDS stress value = 0.0915.
Fig. 6
Fig. 6
(a) Disparity indices calculated for 10 angiosperm subgroups out of Stebbins’ (1951) dataset. Mean pairwise distances (open circles), range (closed circles), and sum of variances (open squares). (b) Rarefaction curves for the range. Curves represent the mean (solid lines) and 90% confidence intervals (dashed lines) of the indices calculated from 200random samplings without replacement for each sampling size.

References

    1. Ackerman JD, Cuevas AA, Hof D. Are deception-pollinated species more variable than those offering a reward? Plant Systematics and Evolution. 2011;293:91–99.
    1. Allen CE, Beldade P, Zwaan BJ, Brakefield PM. Difference in the selection response of serially repeated color pattern characters: standing variation, development, and evolution. BMC Evolutionary Biology. 2008;8:94. doi: 10.1186/1471-2148-8-94. - DOI - PMC - PubMed
    1. Anderson MJ. A new method for non-parametric multivariate analysis of variance. Austral Ecology. 2001;26:32–46.
    1. APG III. An update of the Angiosperm Phylogeny Group plants: APG III. Botanical Journal of the Linnean Society. 2009;161:105–121.
    1. Arnold SEJ, Faruq S, Savolainen V, McOwan PW, Chittka L. FReD: The Floral Reflectance Database — a web portal for analyses of flower colour. PLoS ONE. 2010;5:e14287. - PMC - PubMed

Publication types

LinkOut - more resources