. 2015 Apr 2;520(7545):104-8.
doi: 10.1038/nature14052. Epub 2015 Jan 5.

Commensal-dendritic-cell interaction specifies a unique protective skin immune signature

Affiliations

Commensal-dendritic-cell interaction specifies a unique protective skin immune signature

Shruti Naik et al. Nature. .

Abstract

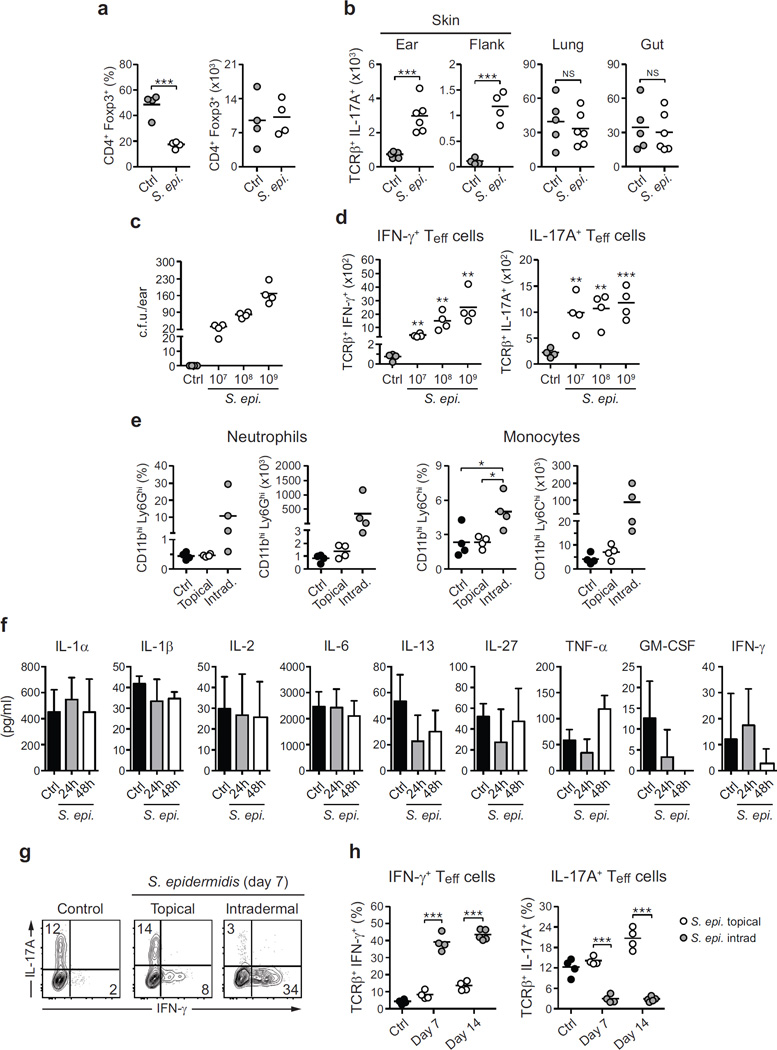
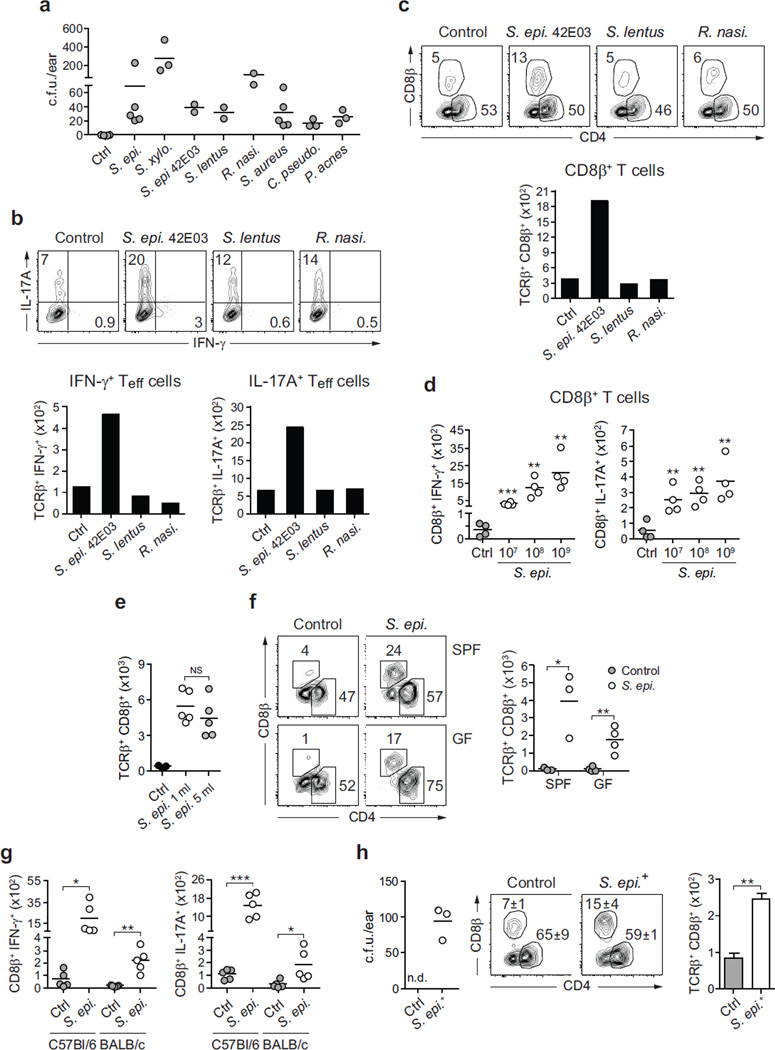
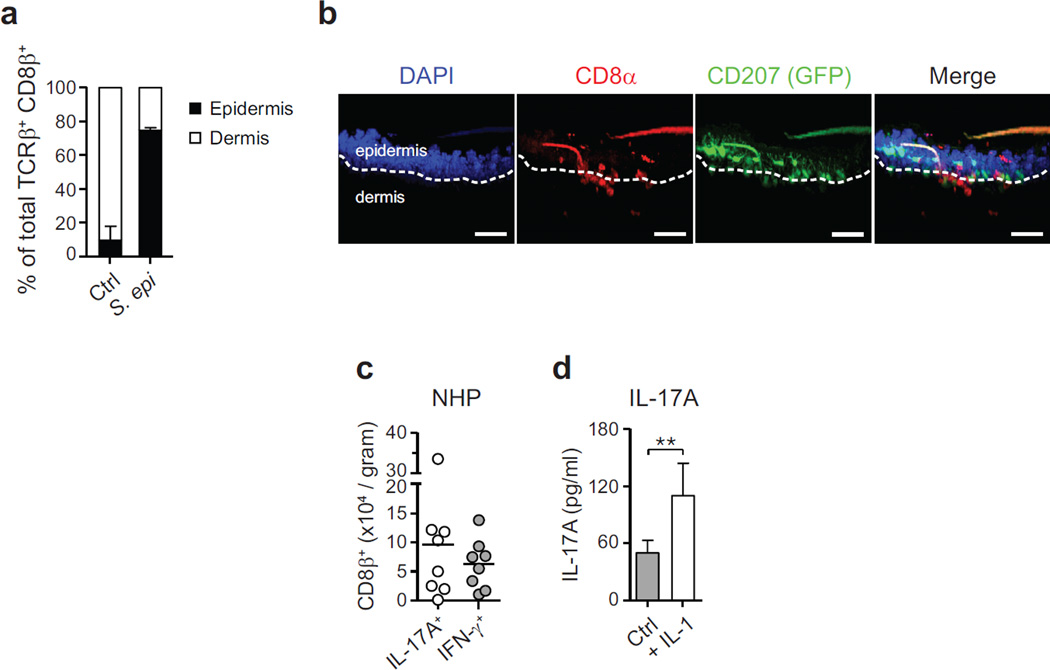
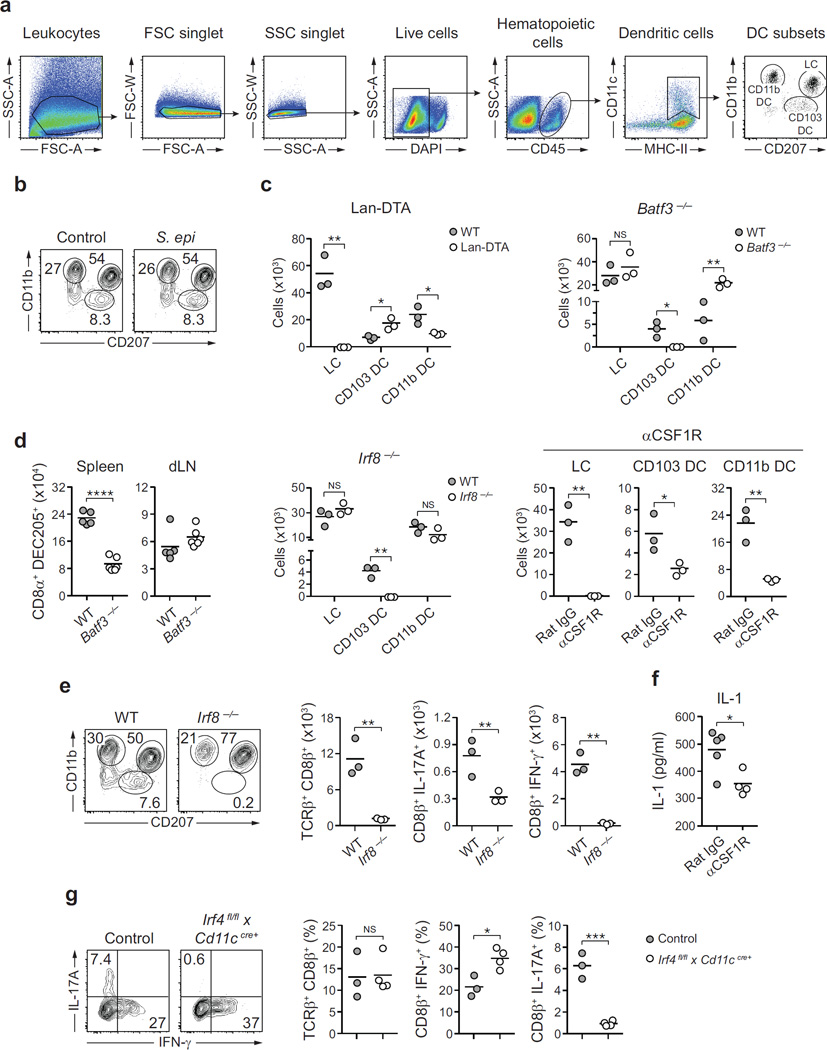
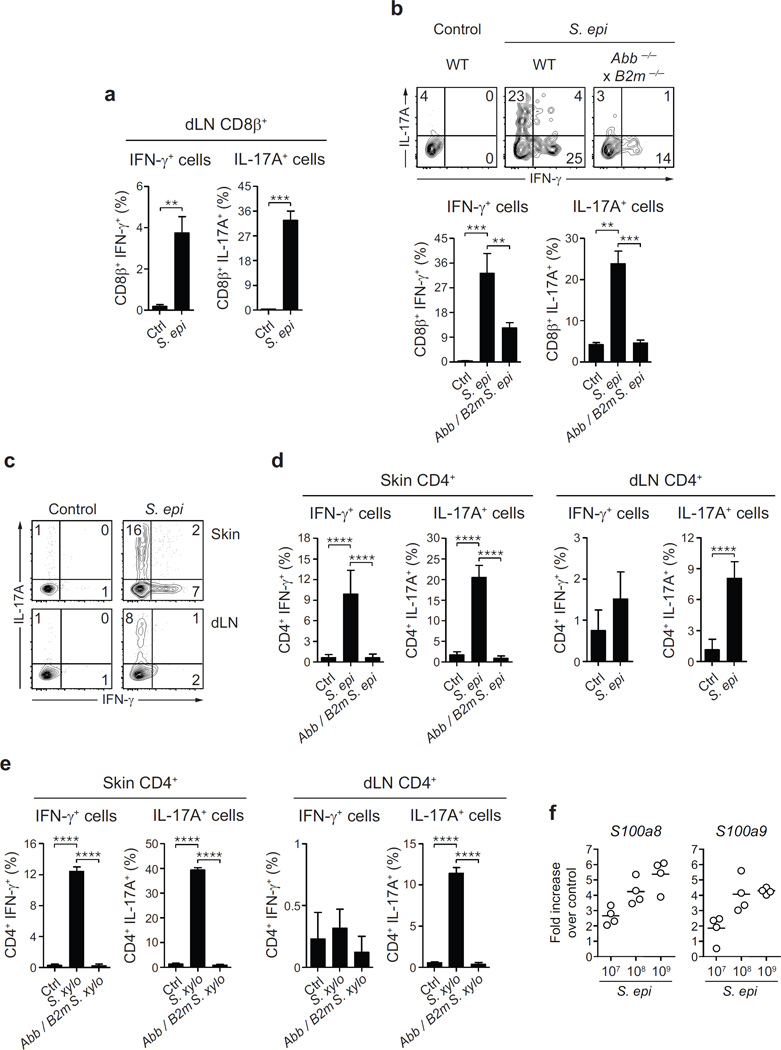
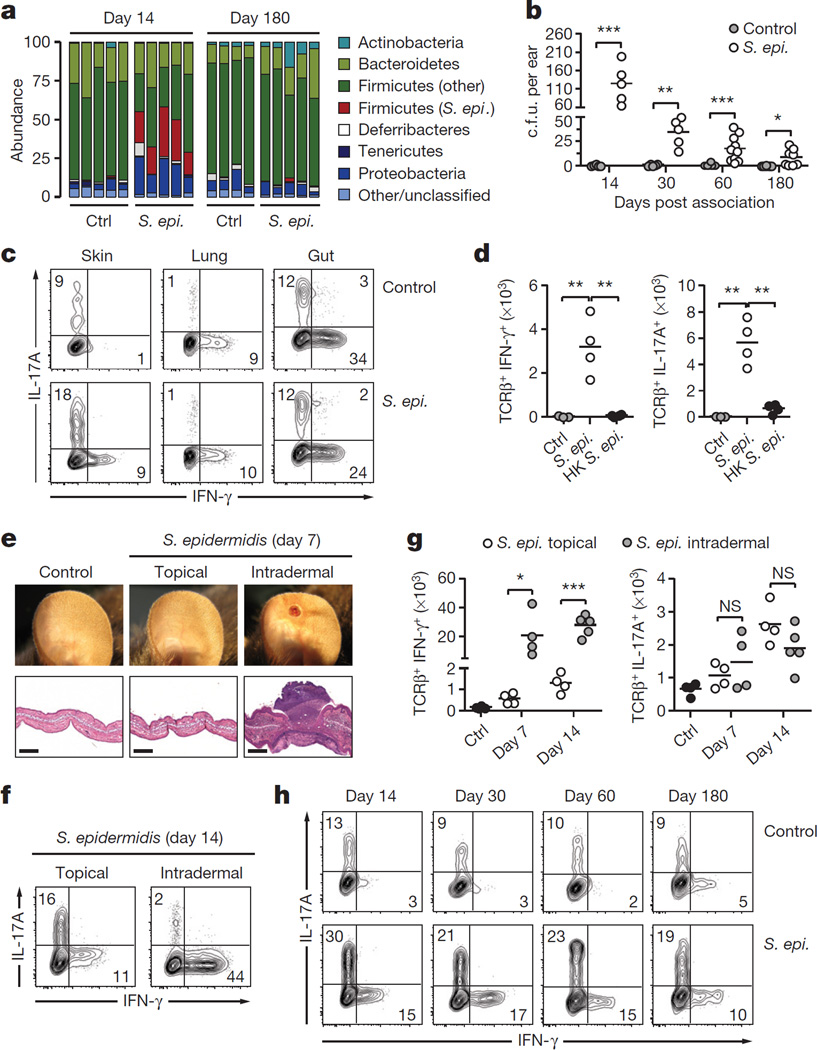
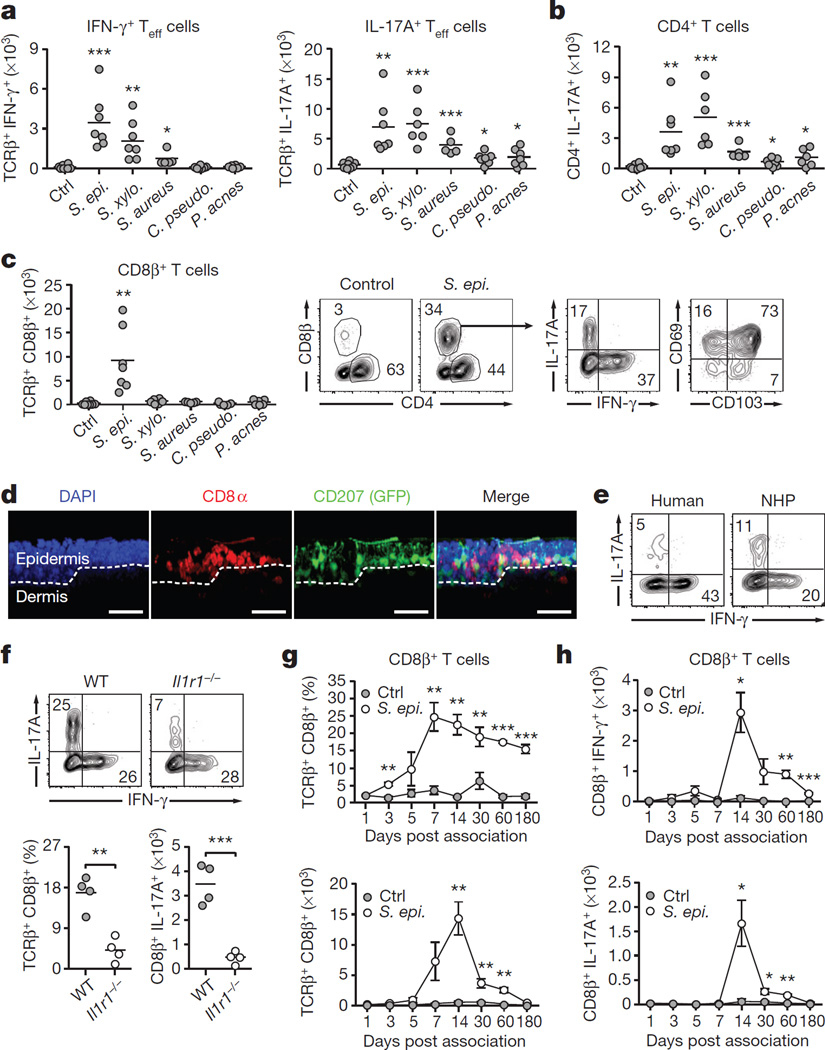
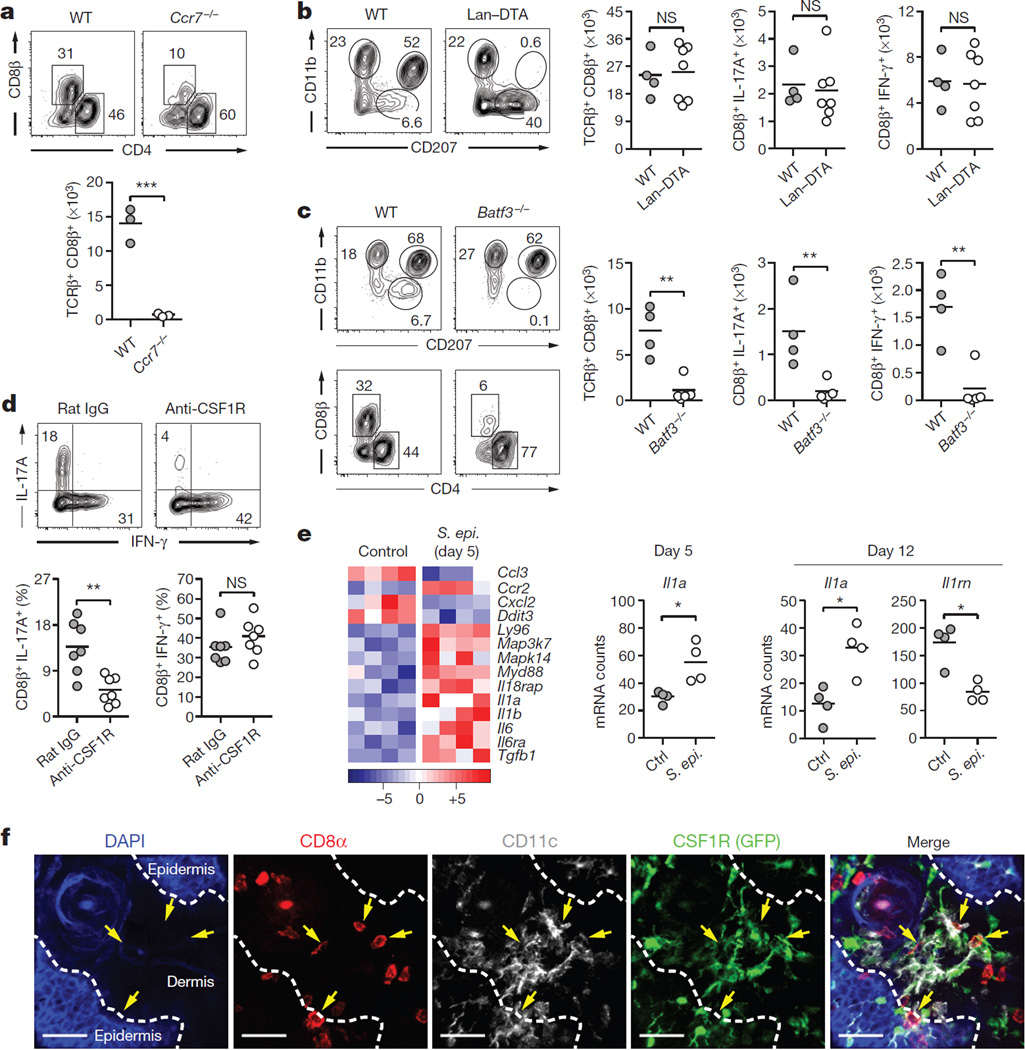
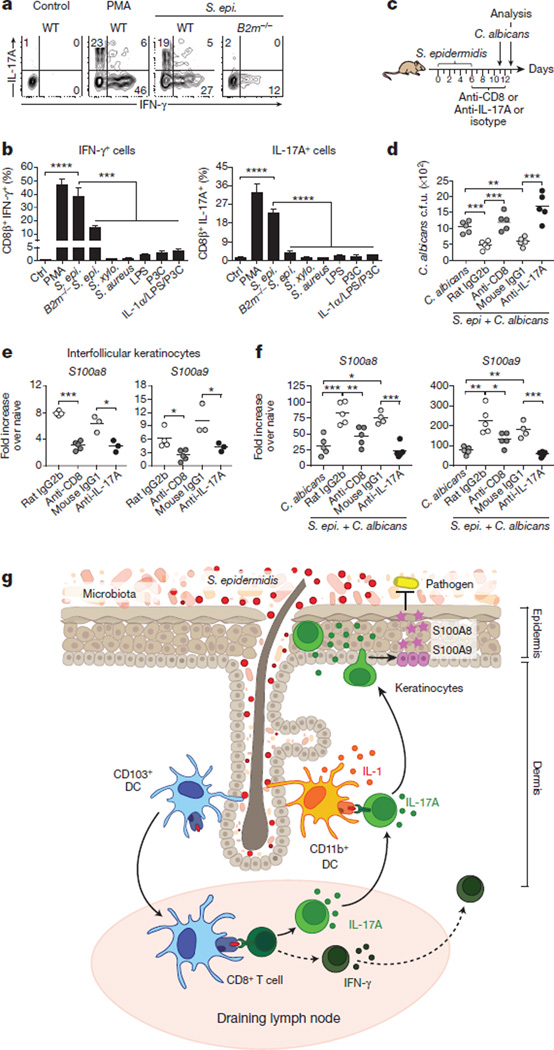
The skin represents the primary interface between the host and the environment. This organ is also home to trillions of microorganisms that play an important role in tissue homeostasis and local immunity. Skin microbial communities are highly diverse and can be remodelled over time or in response to environmental challenges. How, in the context of this complexity, individual commensal microorganisms may differentially modulate skin immunity and the consequences of these responses for tissue physiology remains unclear. Here we show that defined commensals dominantly affect skin immunity and identify the cellular mediators involved in this specification. In particular, colonization with Staphylococcus epidermidis induces IL-17A(+) CD8(+) T cells that home to the epidermis, enhance innate barrier immunity and limit pathogen invasion. Commensal-specific T-cell responses result from the coordinated action of skin-resident dendritic cell subsets and are not associated with inflammation, revealing that tissue-resident cells are poised to sense and respond to alterations in microbial communities. This interaction may represent an evolutionary means by which the skin immune system uses fluctuating commensal signals to calibrate barrier immunity and provide heterologous protection against invasive pathogens. These findings reveal that the skin immune landscape is a highly dynamic environment that can be rapidly and specifically remodelled by encounters with defined commensals, findings that have profound implications for our understanding of tissue-specific immunity and pathologies.


Figures

Extended Data Figure 1
Extended Data Figure 1. Assessment of Foxp3+ regulatory T cells and cytokine production by effector T cells after S. epidermidis topical application and/or intradermal inoculation
a, Frequencies and absolute numbers of skin regulatory (CD45+ TCRβ+ CD4+ Foxp3+) T cells in unassociated mice (Ctrl, n = 4) and mice associated with S. epidermidis (n = 4) at day 14 post first topical application. b, Absolute numbers of effector T cells producing IL-17A after PMA/ionomycin stimulation in the skin (ear pinnae and flank), the lung or the small intestine lamina propria (gut) at day 14 post topical association (Ctrl, n = 4–5; S. epi., n = 4–5). c, d, Enumeration of colony-forming units and absolute numbers of effector T cells producing IFN-γ or IL-17A (PMA/ionomycin) from the skin 2 weeks post application with different doses (107, 108 or 109 c.f.u. per ml) of S. epidermidis (n = 4 per group). e, Frequencies and absolute numbers of neutrophils and monocytes in the skin of mice 14 days after the first topical application or intradermal inoculation with S. epidermidis (n = 4 per group). f, Assessment of cytokine production (mean ± s.e.m., n = 3 per time point) by leukocytes from the ear skin tissue 24 and 48 h after topical association with S. epidermidis. Unassociated mice were used as controls. No significant amounts of IL-4, IL-5, IL-17A, IL-18, IL-21 or IL-22 could be detected at the time of analysis. g, IFN-γ and IL-17A production by skin effector T cells in mice 7 days after S. epidermidis topical application or intradermal inoculation. h, Frequencies of IFN-γ and IL-17A-producing effector T cells in the skin of mice 7 and 14 days after the first topical application or intradermal inoculation of S. epidermidis (n = 4–5 mice per group). All results shown are representative of 2–3 experiments with similar results. *P < 0.05; **P < 0.01; ***P < 0.001; NS, not statistically significant as calculated by Student’s t-test.
Extended Data Figure 2
Extended Data Figure 2. Assessment of CD8+ T-cell responses in the skin of specific pathogen-free and germ-free mice after topical application with skin commensals
a, Mice were left unassociated (Ctrl, n = 5) or topically associated with S. epidermidis human isolate (n = 5), S. xylosus (n = 3), S. epidermidis murine isolate (S.epi 42E03, n = 2), S. lentus (n = 2), R. nasimurium (n = 2), S. aureus (n = 5), C. pseudodiphtheriticum (n = 3) or P. acnes (n = 3). Quantification of colony-forming units from the ears after topical application is shown 2 weeks after first association. b, Frequencies and numbers of effector (CD45+ TCRβ+ CD4+ Foxp3) T cells producing IFN-γ or IL-17A after PMA/ionomycin stimulation in the skin of mice from a at day 14 post first topical application. Bar graphs represent the mean value from two mice. c, Frequencies of skin CD4+ and CD8β+ effector T cells in mice from a at day 14 post first topical application. d, Absolute numbers of IFN-γ- and IL-17A-producing CD8β+ effector T cells in the skin of unassociated (Ctrl) mice or mice associated with different doses (107, 108 or 109 c.f.u. per ml) of S. epidermidis (n = 4 per group). e, Absolute numbers of skin CD8β+ effector T cells in unassociated (Ctrl, n = 3) mice or mice associated with 1 ml (n = 5) or 5ml (n = 5) of a suspension (109 c.f.u. per ml) of S. epidermidis. f, Flow cytometric assessment of the frequencies of CD4+ and CD8β+ effector T cells and absolute numbers of CD8β+ effector T cells in SPF (n = 3 per group) and germ-free (GF, n = 4 per group) mice 2 weeks after S. epidermidis topical application. g, Absolute numbers of IFN-γ- and IL-17A-producing CD8β+ effector T cells in the skin of unassociated (Ctrl) or S. epidermidis- associated C57BL/6 and BALB/c mice at 14 days post first topical application (n = 5 per group). For d–g, all results shown are representative of 2–3 independent experiments with similar results. *P < 0.05; **P < 0.01; ***P < 0.001; NS, not statistically significant as calculated with Student’s t-test. h, Quantification of colony-forming units from the ears of adult mice born from S. epidermidis associated (S. epi+, n = 3) or unassociated (Ctrl, n = 3) breeder pairs. Flow plots and bar graphs (mean ± s.e.m.) illustrate the frequencies of CD4+ and CD8β+ effector T cells and absolute numbers of CD8β+ effector T cells, respectively. n.d., not detected; **P < 0.01 as calculated with Student’s t-test.
Extended Data Figure 3
Extended Data Figure 3. CD8+ T cells accumulate preferentially in the epidermidis after topical application of S. epidermidis
a, Proportion of effector (CD45+ TCRβ+ Foxp3) CD8β+ T cells in the epidermal and dermal compartments of the ear skin tissue 2 weeks after the first S. epidermidis topical application. b, Representative imaging volume projected along the x axis of ears from Langerin–GFP reporter mice at 14 days post first topical application with S. epidermidis. Scale bars, 30 µm. c, Numbers of CD3+ CD8β+ cells producing IFN-γ or IL-17A (after PMA/ionomycin stimulation) from normal nonhuman primate (NHP) skin (n = 8). d, Assessment of IL-17A production in the supernatant of CD8β+ T cells purified from the skin of mice topically associated with S. epidermidis and cultured overnight in presence of anti-CD3ε alone (Ctrl) or with IL-1α and IL-1β (+ IL-1). Bars represent the mean value ± s.e.m. (n = 3, **P < 0.01 as calculated with Student’s t-test). Results shown in a, c and d are representative of 2–3 experiments with similar results.
Extended Data Figure 4
Extended Data Figure 4. Depletion strategies for the different subsets of skin dendritic cells
a, Gating strategy for various dendritic cell subsets in the skin. Cells are first gated on live CD45+ CD11c+ MHCII+. Subsets of dendritic cells are then defined as follows: Langerhans cells (LC) are gated on CD11b+ CD207(Langerin)+ cells, CD103+ dendritic cells (CD103 DC) on CD11b CD207+ cells and CD11b+ dermal dendritic cells (CD11b DC) on CD11b+ CD207 cells. b, Comparative assessment by flow cytometry of Langerhans cell, CD103 DC and CD11b DC in the ear skin of unassociated mice (control) and mice first topically associated with S. epidermidis 2weeks earlier. c, Absolute numbers of Langerhans cell, CD103 DC and CD11b DC 2weeks after the first topical application of S. epidermidis in wild-type (WT, n = 3), Langerin–DTA (Lan–DTA, n = 3), Batf3−/− (n = 3) or Irf8−/− (n = 3) mice and in mice treated with anti-CSF1R (n = 3) or isotype control (rat IgG, n = 3) antibodies. d, Absolute numbers of CD11chi MHCII+ CD8+ DEC205+ dendritic cells in the spleen and the skin draining lymph node (dLN) of wild-type (n = 5) and Batf3−/− (n = 6) mice. e, Phenotypic analysis of CD45+ MHCII+ CD11c+ cells by flow cytometry and absolute numbers of effector (CD45+ TCRβ+ Foxp3) CD8β+ T cells and IL-17A- or IFN-γ-producing CD8β+ T cells in wild-type (n = 3) and Irf8−/− (n = 3) mice 2 weeks after the first topical application of S. epidermidis. f, Assessment of IL-1 production by leukocytes from the ear skin tissue of S. epidermidis-associated mice treated with anti-CSF1R (n = 4) or isotype control (rat IgG, n = 5) antibodies. g, Frequencies of total and IFN-γ- or IL-17A-producing CD8β+ effector T cells in S. epidermidis-associated Irf4fl/fl×CD11ccre+ (n = 3) and littermate control (n = 3) mice. All data shown in this figure are representative of 2–3 experiments with similar results. *P < 0.05; **P < 0.01; ***P < 0.001; NS, not statistically significant as calculated with Student’s t- test.
Extended Data Figure 5
Commensal-driven CD4+ and CD8+ T-cell responses in the skin tissue and the skin draining lymph nodes are specific for commensal antigens. a, Frequencies of IFN-γ- or IL-17A-producing CD8β+ T cells in overnight co-cultures of splenic dendritic cells (SpDC) and CD8β+ T cells purified from the skin draining lymph node (dLN) of mice first topically associated with S. epidermidis 2 weeks earlier. b, Frequencies of IFN-γ- and IL-17A-producing CD8β+ T cells in overnight co-cultures of SpDC and CD8β+ T cells purified from the skin of mice 14 days after the first S. epidermidis application. Dendritic cells were purified from either wild-type (WT) or Abb−/− B2m−/− mice. c, d, Frequencies of IFN-γ- and IL-17A producing CD4+ T cells in overnight co-cultures of SpDC and CD8β+ T cells purified from the skin ear tissue or the skin dLN of mice 14 days after the first S. epidermidis application. For a, b and d, Ctrl, naive SpDC; S. epi, SpDC + heat-killed S. epidermidis; Abb/B2m S. epi, Abb−/− B2m−/− SpDC + heat-killed S. epidermidis. e, Frequencies of IFN-γ- and IL-17A producing CD4+ T cells in overnight co-cultures of SpDC and CD8β+ T cells purified from the skin ear tissue or the skin dLN of mice 14 days after the first S. xylosus application. Ctrl, naive SpDC; S. xylo, SpDC + heat-killed S. xylosus; Abb/B2m S. xylo, Abb−/− B2m−/− SpDC + heat-killed S. xylosus. All data shown in a–d are representative of three independent experiments. Graph bars represent the mean ± standard deviation of triplicate cultures. **P < 0.01, ***P < 0.0001, ****P < 0.0001 as calculated with Student’s t-test. f, S100a8 and S100a9 gene expression in dorsal skin biopsies of mice associated with different doses (107, 108 or 109 c.f.u. per ml) of S. epidermidis 2weeks after the first topical application (n = 4 per group). Data are expressed as fold increase over gene expression in unassociated control mice.
Figure 1
Figure 1. Remodelling of skin immunity by commensal colonization
a, Relative abundance of bacterial phyla in mouse skin 14 and 180 days after S. epidermidis topical application. Each bar represents the percentage of sequences in operational taxonomic units (OTUs) assigned to each phylum for an individual mouse. Ctrl, control. b, Enumeration of colony-forming units (c.f.u.) from the ears after S. epidermidis application (n = 5–10 per group). c, IFN-γ and IL-17A production by skin, lung or gut effector (CD45+ TCRβ+ Foxp3) T cells in unassociated (control) and S. epidermidis (S. epi.)-associated mice at day 14. d, Absolute numbers of skin IFN-γ+ or IL-17A+ effector T cells in unassociated mice (control, n = 3) and mice topically associated with live (S. epi., n = 4) or heat-killed (HK S. epi., n = 4) S. epidermidis at day 14. e, Representative images and histopathological comparison of the ear pinnae of unassociated (control), topically associated (topical) or intradermally inoculated (intradermal) mice at day 7. Scale bars, 250 µm. f, g, Frequencies and absolute numbers of skin IFN-γ+ or IL-17A+ effector T cells after topical application (n = 4) or intradermal inoculation (n = 4–5) of S. epidermidis. h, IFN-γ and IL-17A production by skin effector T cells in unassociated and S. epidermidis-associated mice at different time points. Results are representative of 2–3 independent experiments. *P < 0.05, **P < 0.01, ***P < 0.001 as calculated by Student’s t-test.
Figure 2
Figure 2. Distinct commensal species impose specific immune signatures in the skin
a, Mice were left unassociated (Ctrl, n = 8) or topically associated with S. epidermidis (n = 7), S. xylosus (n = 7), S. aureus (n = 5), C. pseudodiphtheriticum (n = 7) or P. acnes (n = 6). Absolute numbers of skin IFN-γ+ or IL-17A+ effector T cells are shown 2 weeks after first association. b, Absolute numbers of skin IL-17A+ CD4+ effector T cells from mice in a. c, Absolute numbers of skin CD8β+ effector T cells from mice in a. Flow plots show the frequencies of CD4+ and CD8β+ effector T cells in unassociated and S. epidermidis-associated mice, the IFN-γ and IL-17A production, and the expression of CD69 and CD103 by CD8β+ T cells in associated mice. d, Representative imaging volume projected along the x axis of ears from Langerin–GFP (green fluorescent protein) reporter mice 14 days post S. epidermidis application. Scale bars, 30 µm; DAPI, 4′,6-diamidino-2-phenylindole. e, CD3+ CD8+ IFN-γ+ and CD3+ CD8+ IL-17A+ T cells in normal human (n = 1) and non-human primate (NHP) skin (n = 8). f, Frequencies and absolute numbers of total CD8β+ or IL-17A+ CD8β+ effector T cells in the skin of wild-type (WT, n = 4) and Il1r1−/− (n = 4) mice after S. epidermidis application. g, h, Frequencies and absolute numbers (mean ± s.e.m.) of total CD8β+, IFN-γ+ CD8β+ and IL-17A+ CD8β+ effector T cells in the skin over time following S. epidermidis application (n = 3–5 per time point). Results in a–c are a compilation of 2–3 experiments. Results in d–h are representative of two independent experiments. *P < 0.05, **P < 0.01, ***P < 0.001 as calculated by Student’s t-test.
Figure 3
Figure 3. Distinct dendritic cell subsets cooperate to mediate host– commensal interaction in the skin
a, Frequencies and absolute numbers of skin CD8β+ effector T cells in wild-type (WT, n = 3) and Ccr7−/− (n = 3) mice 2 weeks post first S. epidermidis topical application. b, Phenotypic analysis of skin MHCII+ CD11c+ cells and absolute numbers of skin total CD8β+, IFN-γ+ CD8β+ and IL-17A+ CD8β+ effector T cells in wild-type (n = 4) and Langerin–diphtheria toxin subunit A (Lan–DTA, n = 7) mice after S. epidermidis application. NS, not significant. c, Phenotypic analysis of MHCII+ CD11c+ cells and effector T cells in the skin of wild-type (n = 4) and Batf3−/− (n = 5) mice after S. epidermidis application. Graphs illustrate the absolute numbers of skin total CD8β+, IFN-γ+ CD8β+ and IL-17A+ CD8β+ effector T cells. Results shown in a–c are representative of 2–3 experiments. **P < 0.01, ***P < 0.001 as calculated by Student’s t-test. d, Frequencies of IFN-γ+ CD8β+ and IL-17A+ CD8β+ effector T cells in S. epidermidis-associated mice treated with anti-CSF1R (n = 7) or rat IgG isotype control (n = 7). Graphs are a compilation of the results of two independent experiments. **P < 0.01 by Student’s t-test. e, Heat map of genes statistically differentially expressed in skin CD11b+ CD103 dendritic cells from topically associated versus unassociated mice. Graphs summarize Il1a and Il1rn mRNA counts at day 5 and/or day 12 in CD11b+ CD103 dendritic cells. Each column of the heat map and each dot of the graph represent gene expression from a biological replicate comprised of skin cells pooled and purified from 5 mice (n = 4 biological replicates, *P < 0.05). f, Representative imaging volume projected along the z axis of ears from CSF1R GFP reporter mice 14 days post application, showing contact (arrows) between CD8α+ and CD11c+ CSF1R+ cells. Scale bars, 40 µm.
Figure 4
Figure 4. Commensal-driven CD8+ T cell response is specific for S. epidermidis antigen
a, CD8β+ effector T cells from the skin of S. epidermidis associated mice were co-cultured with wild-type (WT) or B2m−/− splenic dendritic cells (SpDC) untreated (Ctrl) or pre-incubated with heat-killed S. epidermidis, S. xylosus or S. aureus; LPS, Pam3Cys (P3C) or IL-1α. Flow plots illustrate the frequencies of IFN-γ+ CD8β+ and IL-17A+ CD8β+ T cells in overnight co-cultures. PMA, naive SpDC + PMA/ionomycin. b, Frequencies of IFN-γ+ CD8β+ and IL-17A+ CD8β+ T cells in overnight co-cultures as described in a (mean ± standard deviation of triplicate cultures). Data are representative of 2–3 independent experiments. ***P < 0.001, ****P < 0.0001 as calculated by Student’s t-test. c, Unassociated or S. epidermidis-topically associated mice were infected with C. albicans and treated with anti-CD8, anti-IL-17A or corresponding isotype control antibodies. d, Enumeration of C. albicans colony-forming units from dorsal skin biopsies from mice in c 2 days post C. albicans infection. e, S100a8 and S100a9 gene expression (fold increase over naive unassociated) by interfollicular keratinocytes purified from the ears of mice 2 weeks after S. epidermidis application. f, S100a8 and S100a9 gene expression (fold increase over naive unassociated and uninfected) in dorsal skin biopsies from mice in c 2 days post C. albicans infection. Results in d–f are representative of two independent experiments. *P < 0.05, **P < 0.01, ***P < 0.001 as calculated by Student’s t-test. g, Model of the response of the skin immune system to colonization with a new commensal. Skin-resident CD103+ dendritic cells (DC) may acquire commensals or commensal-derived antigens by reaching into skin appendages or via capture of soluble factors. CD8+ T cells primed by CD103+ dendritic cells in the lymph node, migrate to the skin and are locally tuned by IL-1 produced by CD11b+ dendritic cells. Commensal-specific CD8+ T cells can enhance antimicrobial defence of keratinocytes in an IL-17 dependent manner. Dotted lines indicate points that are not addressed in this work.

Comment in

References

    1. Grice EA, Segre JA. The skin microbiome. Nature Rev. Microbiol. 2011;9:244–253. - PMC - PubMed
    1. Naik S, et al. Compartmentalized control of skin immunity by resident commensals. Science. 2012;337:1115–1119. - PMC - PubMed
    1. Chehoud C, et al. Complement modulates the cutaneous microbiome and inflammatory milieu. Proc. Natl Acad. Sci. USA. 2013;110:15061–15066. - PMC - PubMed
    1. Sanford JA, Gallo RL. Functions of the skin microbiota in health and disease. Semin. Immunol. 2013;25:370–377. - PMC - PubMed
    1. Grice EA, et al. Topographical and temporal diversity of the human skin microbiome. Science. 2009;324:1190–1192. - PMC - PubMed

Publication types

MeSH terms

Associated data