. 2014 Dec 24;15(1):1177.
doi: 10.1186/1471-2164-15-1177.

CAGE-defined promoter regions of the genes implicated in Rett Syndrome

Affiliations

CAGE-defined promoter regions of the genes implicated in Rett Syndrome

Morana Vitezic et al. BMC Genomics. .

Abstract

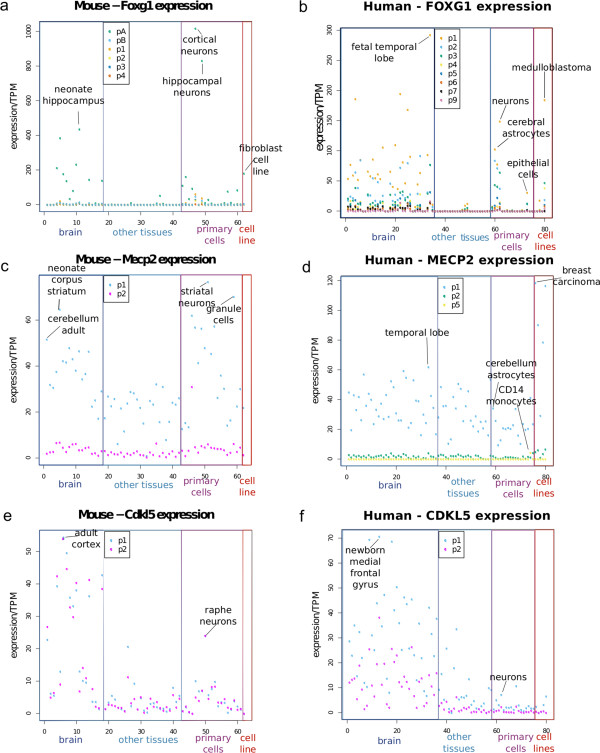
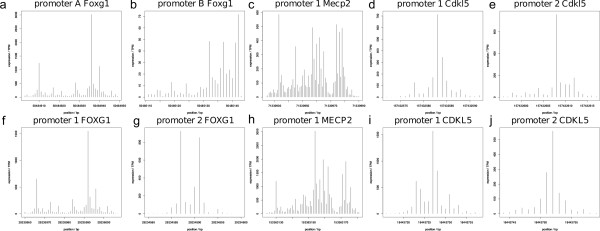
Background: Mutations in three functionally diverse genes cause Rett Syndrome. Although the functions of Forkhead box G1 (FOXG1), Methyl CpG binding protein 2 (MECP2) and Cyclin-dependent kinase-like 5 (CDKL5) have been studied individually, not much is known about their relation to each other with respect to expression levels and regulatory regions. Here we analyzed data from hundreds of mouse and human samples included in the FANTOM5 project, to identify transcript initiation sites, expression levels, expression correlations and regulatory regions of the three genes.

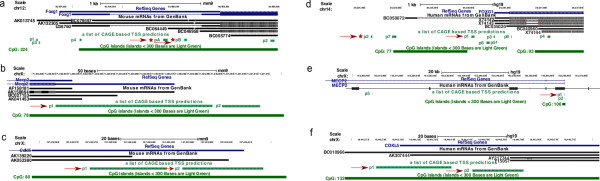
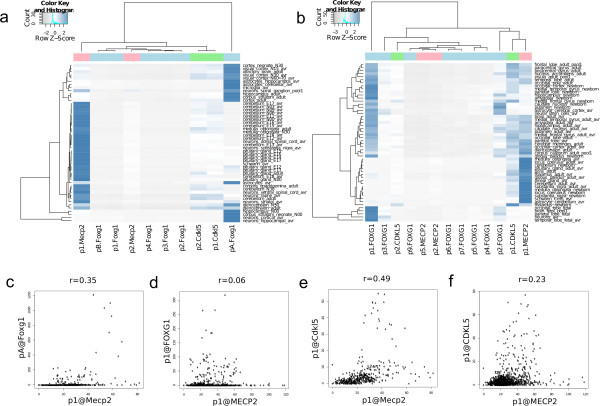
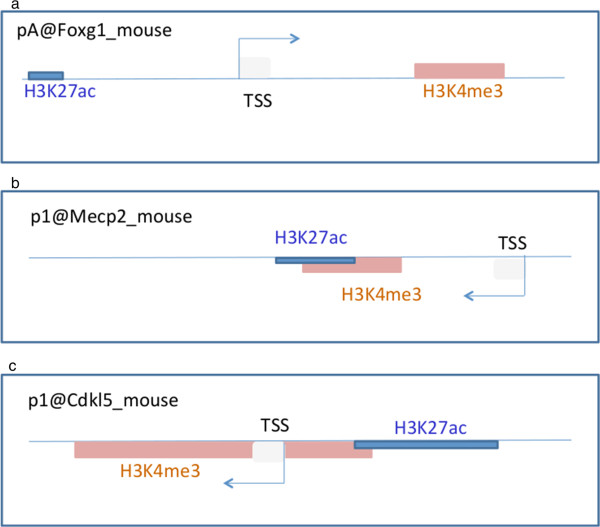
Results: Our investigations reveal the predominantly used transcription start sites (TSSs) for each gene including novel transcription start sites for FOXG1. We show that FOXG1 expression is poorly correlated with the expression of MECP2 and CDKL5. We identify promoter shapes for each TSS, the predicted location of enhancers for each gene and the common transcription factors likely to regulate the three genes. Our data imply Polycomb Repressive Complex 2 (PRC2) mediated silencing of Foxg1 in cerebellum.

Conclusions: Our analyses provide a comprehensive picture of the regulatory regions of the three genes involved in Rett Syndrome.


Figures

Figure 1
Figure 1
Expression levels of the identified TSS for the three genes. Dot plots showing the expression level of each promoter in TPM values in all brain regions, and selected other samples (based on expression level). The novel promoter pA@Foxg1 is the most highly expressed Foxg1 TSS in mouse primary cells and brain tissue (a), with the highest expression in cortical neurons (1018 TPM) and neonate hippocampus (435 TPM). Among mouse cells, we find high levels of p1@ Foxg1 expressed in hippocampal neurons and fibroblast cell line. In human samples (panel b) the highest expression of FOXG1 is seen from p1@FOXG1 in fetal temporal lobe (292 TPM), among primary cells in neurons (149 TPM) and among cell lines in medulloblastoma cell line (184 TPM). For mouse Mecp2, the highest expression of p1@Mecp2 is in striatal neurons (77 TPM) and cerebellar granule cells (70 TPM) and among mouse tissues (panel c) the maximum expression is seen in neonate corpus striatum (65 TPM) and adult cerebellum (52 TPM). For human, the highest expression of p1@MECP2 is found in cancer cell lines including breast carcinoma cell line (119 TPM) (panel d). In human brain the highest expression of p1@MECP2 is found in the temporal lobe (63 TPM). The two promoters of Cdkl5 in mouse are co-expressed with highest expression in adult cortex in the brain and raphe neurons among primary cells (panel e). In humans (panel f) the two promoters are expressed differentially with transcripts arising from p1 over-represented. p1@CDKL5 expression is highest in the newborn medial frontal gyrus and in neurons. In human cancer cell lines, CDKL5 is generally expressed at low levels (less than 10 TPM) from either of the promoters (p1 > p2), with a few exceptions (Additional file 1: Table S1, Additional file 3: Figure S1f).
Figure 2
Figure 2
Locations of the TSSs identified for the three genes. Genome browser images showing all the TSSs identified in this study for FOXG1 (panels a and d), MECP2 (panels b and e) and CDKL5 (panels c and f) in mouse (panels a,b and c) and humans (panels d, e and f). In each panel the top two tracks show RefSeq genes and mRNAs from Genbank. The third track shows FANTOM5 TSS and the bottom track shows CpG islands. Red arrows mark the key TSSs for each gene. We found 6 TSSs for Foxg1 in mouse (panel a) and 8 TSSs in humans (panel d). Novel TSSs are identified by asterisks. We also found a CD14 specific intronic TSS p5 for MECP2 in human cells.
Figure 3
Figure 3
Expression correlations between the three genes. Heat maps showing the TPM expression of all promoters in sub-regions of brain and brain related primary cells in mouse (a) and humans (b). Expression of Mecp2 p1 appears to be in contrast with the expression of the main promoter of Foxg1 in mouse (pA) and in humans (p1). The trees above the heatmaps show clustering according to expression. Plots in panels c to f show correlation between the three genes in mouse (panels c and e) and human (panels d and f) as labeled. The expected negative correlation based on the heatmap between MECP2 and FOXG1 could not be confirmed in either species across all samples (panels c and d). We found positive correlation (23-49%) between Cdkl5 and Mecp2 in both species (panels e and f).
Figure 4
Figure 4
Mouse gene models derived from FANTOM5 TSS and ENCODE ChIP data. Gene models for Foxg1 (panel a), Mecp2 (panel b) and Cdkl5 (panel c) were drawn for the main TSS for each gene and the ENCODE histone ChIP marks for 8 week mouse cortex. For Foxg1, the enhancer mark was 1 kb upstream and the promoter mark was 1.1 kb downstream of the TSS. For Mecp2, the TSS was upstream of the overlapping promoter and enhancer mark. For Cdkl5, the TSS was within the promoter and the enhancer was upstream of the TSS.
Figure 5
Figure 5
Shapes of key promoters of the three genes. Promoter shapes were drawn for the key promoters of the three genes (panels a to j, as labeled) based on the location of the first nucleotide in all tissues in mouse (panels a to e) and humans (panels f to j). Shape conservation is seen across the two species in all promoters except pB of Foxg1 in mouse and p2 of FOXG1 in humans. Despite the closeness in location and high correlation between p1 and p2 of CDKL5, we find variation in their shapes suggesting differential regulation in both species.

References

    1. Amir RE, Van den Veyver IB, Wan M, Tran CQ, Francke U, Zoghbi HY. Rett syndrome is caused by mutations in X-linked MECP2, encoding methyl-CpG-binding protein 2. Nat Genet. 1999;23(2):185–188. doi: 10.1038/13810. - DOI - PubMed
    1. Ariani F, Hayek G, Rondinella D, Artuso R, Mencarelli MA, Spanhol-Rosseto A, Pollazzon M, Buoni S, Spiga O, Ricciardi S, Meloni I, Longo I, Mari F, Broccoli V, Zappella M, Renieri A. FOXG1 is responsible for the congenital variant of Rett syndrome. Am J Hum Genet. 2008;83(1):89–93. doi: 10.1016/j.ajhg.2008.05.015. - DOI - PMC - PubMed
    1. Weaving LS, Christodoulou J, Williamson SL, Friend KL, McKenzie OL, Archer H, Evans J, Clarke A, Pelka GJ, Tam PP, Watson C, Lahooti H, Ellaway CJ, Bennetts B, Leonard H, Gecz J. Mutations of CDKL5 cause a severe neurodevelopmental disorder with infantile spasms and mental retardation. Am J Hum Genet. 2004;75(6):1079–1093. doi: 10.1086/426462. - DOI - PMC - PubMed
    1. Neul JL, Kaufmann WE, Glaze DG, Christodoulou J, Clarke AJ, Bahi-Buisson N, Leonard H, Bailey ME, Schanen NC, Zappella M, Renieri A, Huppke P, Percy AK, RettSearch Consortium Rett syndrome: revised diagnostic criteria and nomenclature. Ann Neurol. 2010;68(6):944–950. doi: 10.1002/ana.22124. - DOI - PMC - PubMed
    1. Archer HL, Evans J, Edwards S, Colley J, Newbury-Ecob R, O'Callaghan F, Huyton M, O'Regan M, Tolmie J, Sampson J, Clarke A, Osborne J. CDKL5 mutations cause infantile spasms, early onset seizures, and severe mental retardation in female patients. J Med Genet. 2006;43(9):729–734. doi: 10.1136/jmg.2006.041467. - DOI - PMC - PubMed

Publication types

MeSH terms