. 2014 Dec 24:8:133.
doi: 10.1186/s12918-014-0133-z.

Hierarchy of non-glucose sugars in Escherichia coli

Hierarchy of non-glucose sugars in Escherichia coli

Guy Aidelberg et al. BMC Syst Biol. .

Abstract

Background: Understanding how cells make decisions, and why they make the decisions they make, is of fundamental interest in systems biology. To address this, we study the decisions made by E. coli on which genes to express when presented with two different sugars. It is well-known that glucose, E. coli's preferred carbon source, represses the uptake of other sugars by means of global and gene-specific mechanisms. However, less is known about the utilization of glucose-free sugar mixtures which are found in the natural environment of E. coli and in biotechnology.

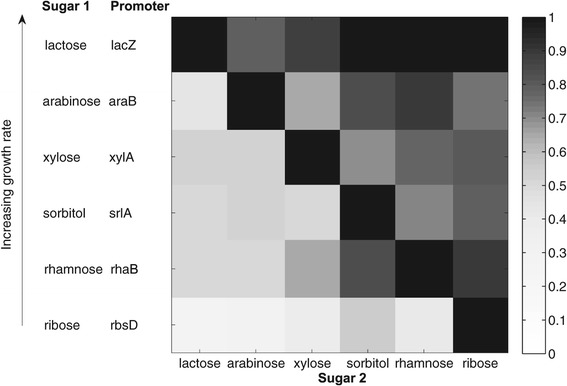
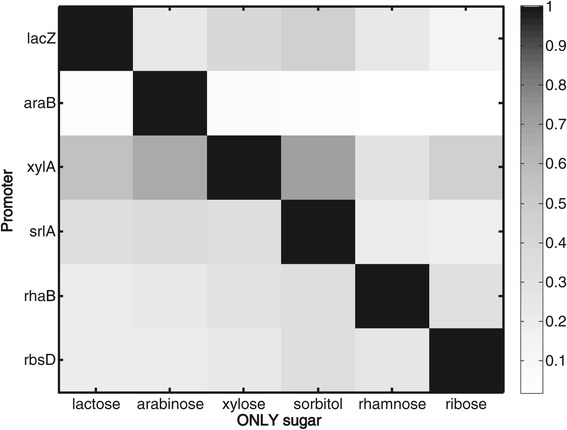
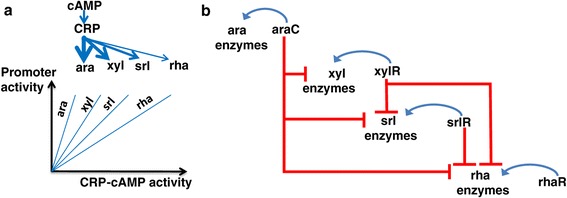
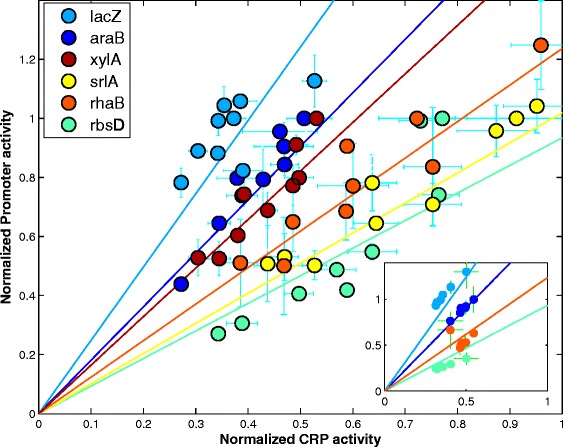
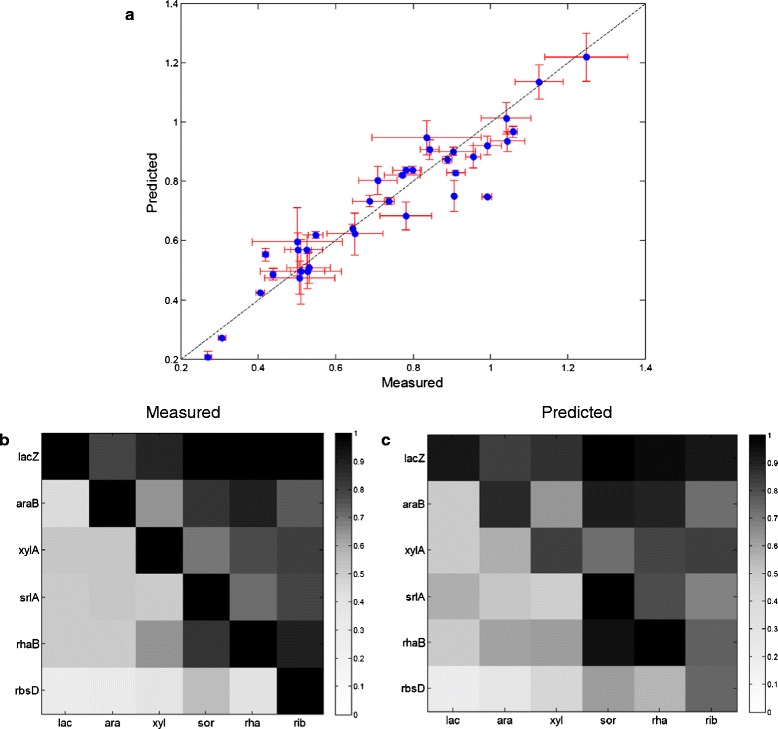
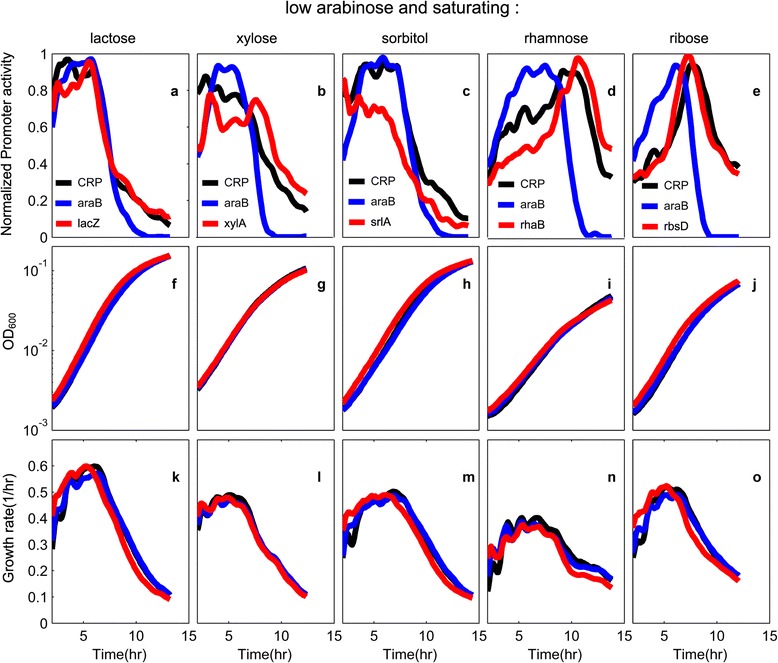
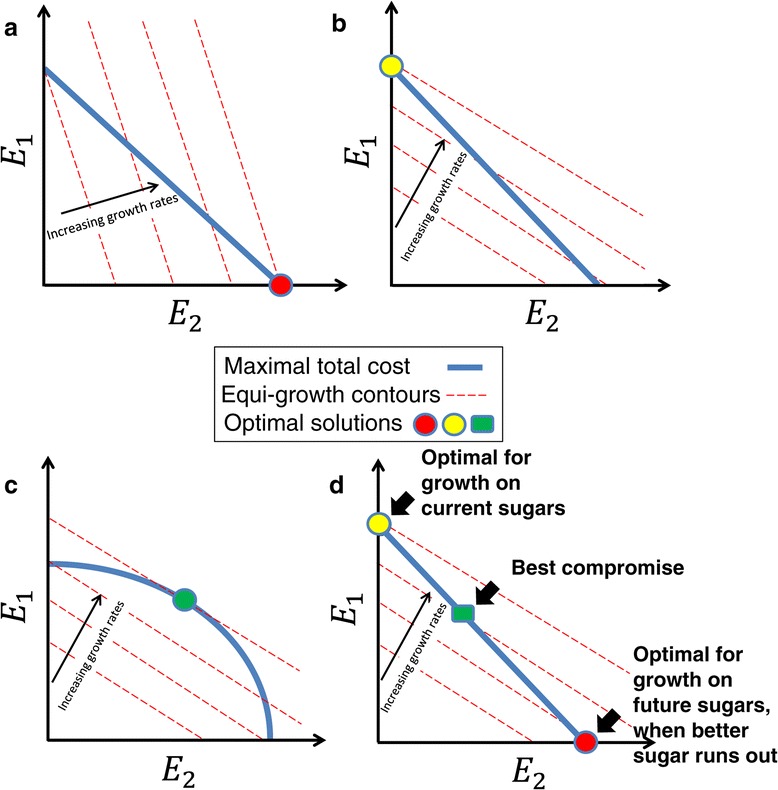
Results: Here, we combine experiment and theory to map the choices of E. coli among 6 different non-glucose carbon sources. We used robotic assays and fluorescence reporter strains to make precise measurements of promoter activity and growth rate in all pairs of these sugars. We find that the sugars can be ranked in a hierarchy: in a mixture of a higher and a lower sugar, the lower sugar system shows reduced promoter activity. The hierarchy corresponds to the growth rate supported by each sugar- the faster the growth rate, the higher the sugar on the hierarchy. The hierarchy is 'soft' in the sense that the lower sugar promoters are not completely repressed. Measurement of the activity of the master regulator CRP-cAMP shows that the hierarchy can be quantitatively explained based on differential activation of the promoters by CRP-cAMP. Comparing sugar system activation as a function of time in sugar pair mixtures at sub-saturating concentrations, we find cases of sequential activation, and also cases of simultaneous expression of both systems. Such simultaneous expression is not predicted by simple models of growth rate optimization, which predict only sequential activation. We extend these models by suggesting multi-objective optimization for both growing rapidly now and preparing the cell for future growth on the poorer sugar.

Conclusion: We find a defined hierarchy of sugar utilization, which can be quantitatively explained by differential activation by the master regulator cAMP-CRP. The present approach can be used to understand cell decisions when presented with mixtures of conditions.


Figures

Figure 1
Figure 1
A hierarchy of sugar gene expression matches the hierarchy in growth rate. Promoter activity for six different sugar utilization operons at mid exponential growth, in the presence of the cognate sugar alone or paired with each of the 5 other sugars. All sugars are at saturating concentrations (0.2%). Rows represent the promoter activity from the indicated reporter grown in the presence of its cognate sugar. Rows are ordered according to growth rate, with a sugar supporting higher growth as sole carbon source rate located in an upper row. Columns represent the second sugar in the mixture. The diagonal represents the presence of only the cognate sugar (0.2%); promoter activity values in each row were normalized to this value.
Figure 2
Figure 2
Sugar system promoters show very little cross regulation. Promoter activity for six different sugar utilization promoters in the presence of only one sugar, at saturating concentration (0.2%) at mid-exponential phase. Rows represent the reporter genes and columns represent the sugar in the medium. Promoter activity of each reporter gene was normalized to the activity in its cognate sugar.
Figure 3
Figure 3
Two possible regulatory mechanisms that can implement a hierarchal decision in sugar utilization. a) Hierarchy can be obtained if CRP shows differential regulation for the different sugar systems so that the induction curves of each system as a function of CRP-cAMP activity are separated. b) Hierarchy can also be obtained by cross regulation so that systems lower in the hierarchy are directly repressed, for example by the sugar-specific transcription factors of the better sugar systems.
Figure 4
Figure 4
Sugar system promoters show a linear increase with CRP-reporter activity but with different slopes that match the hierarchy. Promoter activity at mid exponential phase of each sugar system promoter in the presence of its cognate sugar and one of the five other sugars, normalized to when only its cognate sugar is present, as a function of the promoter activity of a CRP reporter normalized to its highest value. Each color represents a different sugar system promoter (lacZ light blue, araB blue, xylA brown, rhaB orange, srlA yellow, rbsD green). Inset: promoter activity at mid-exponential phase in a two sugar mixture in the presence of external cAMP at 0,0.15,0.3,0.6,1.25,2.5,5 mM. The promoters are lacZ and rbsD measured with external cAMP in lactose + ribose; araB and rhaB measured with external cAMP in arabinose + rhamnose.
Figure 5
Figure 5
Differential activation by cAMP-CRP can quantitatively explain the sugar utilization hierarchy. a) Plotted is the predicted normalized promoter activity versus the measured one. The two agree well with a correlation coefficient R2 = 0.95, p < 10-10. The error bars are standard errors of 4 biological repeats (x-coordinate error bar) and 95% confidence interval of fits (y-coordinate error bar) b) measured promoter activity (same as figure 1) c) predicted promoter activity from linear fits to CRP input functions of each promoter (data of Fig 4, predicted points removed from data used for fit).
Figure 6
Figure 6
Different sugar promoters can be either simultaneously or sequentially expressed in a sugar mixture. a-e) Promoter activity of CRP reporter (black), araB (blue), and a second sugar system promoter (red) in a mixture of sub-saturating arabinose (0.005%) and saturating second sugar (0.2%). The second sugars and promoters are a) lacZ and lactose, b) xylA and xylose, c) srlA and sorbitol, d) rhaB and rhamnose, e) rbsD and ribose. Note that a, b and c show simultaneous expression of the two promoters, whereas d and e show sequential expression. Also shown are optical density OD600 (f-j), and growth rate defined as dlog(OD)/dt panels (k-o) for the corresponding growth conditions. Drop in growth rate at late times is entry to stationary phase. Colors represent the strains as in fig a-e. Promoter activity data is normalized to its maximal value, mean day-day relative errors of growth rate and promoter activity were 8% and 9% respectively.
Figure 7
Figure 7
Simple linear programming optimality models predict that utilizing a single sugar is optimal; more complex models can allow co-utilization of both sugars. a) Simplified linear programming model: The growth rate increases with the expression of the two sugar systems, E1 and E2 – dashed contours. Given a cost constraint of total proteins (blue line), expressing only one of the two sugar systems maximizes the growth rate (red dot). As the concentration of that sugar decreases, growth rate contours shift their slope, until a point in time is reached when b) the optimal solution jumps to expressing the other sugar system exclusively (yellow dot). c) If the constraint (blue line) is convex, the constraint curve bulges outwards and co-expression of the two sugar systems can be optimal (green dot). This predicts that growth rate in co-expression exceeds the maximal growth rate expressing each system alone. d) Co-expression can also be optimal if tasks other than immediate rapid growth affect fitness, for example future growth on the poorer sugar. The green box symbolizes a potential best compromise solution.

References

    1. Bollenbach T, Quan S, Chait R, Kishony R. Nonoptimal microbial response to antibiotics underlies suppressive drug interactions. Cell. 2009;139:707–718. doi: 10.1016/j.cell.2009.10.025. - DOI - PMC - PubMed
    1. Poelwijk FJ, Heyning PD, de Vos MGJ, Kiviet DJ, Tans SJ. Optimality and evolution of transcriptionally regulated gene expression. BMC Syst Biol. 2011;5:128. doi: 10.1186/1752-0509-5-128. - DOI - PMC - PubMed
    1. Dekel E, Alon U. Optimality and evolutionary tuning of the expression level of a protein. Nature. 2005;436:588–592. doi: 10.1038/nature03842. - DOI - PubMed
    1. Monod J. Recherches Sur La Croissance Des Cultures Bacttriennes. Paris: Hermann and Cie; 1942.
    1. Gorke B, Stulke J. Carbon catabolite repression in bacteria: many ways to make the most out of nutrients. Nat Rev Microbiol. 2008;6:613–624. doi: 10.1038/nrmicro1932. - DOI - PubMed

Publication types

MeSH terms