. 2014 Dec 23;15(1):1174.
doi: 10.1186/1471-2164-15-1174.

Quantification of epigenetic biomarkers: an evaluation of established and emerging methods for DNA methylation analysis

Affiliations

Quantification of epigenetic biomarkers: an evaluation of established and emerging methods for DNA methylation analysis

Nicholas Redshaw et al. BMC Genomics. .

Abstract

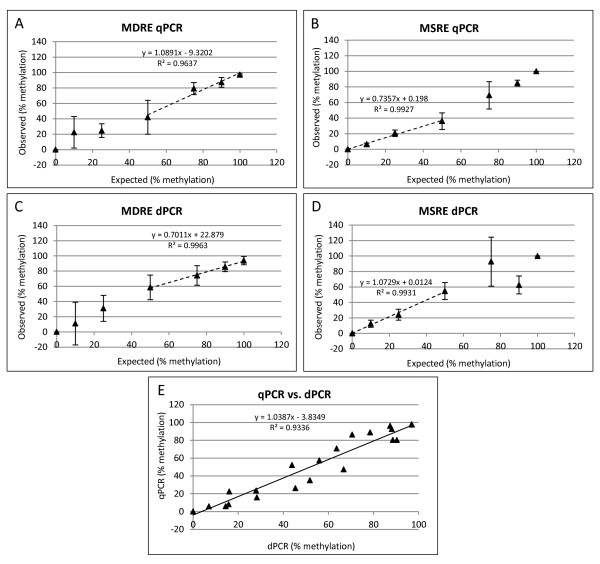
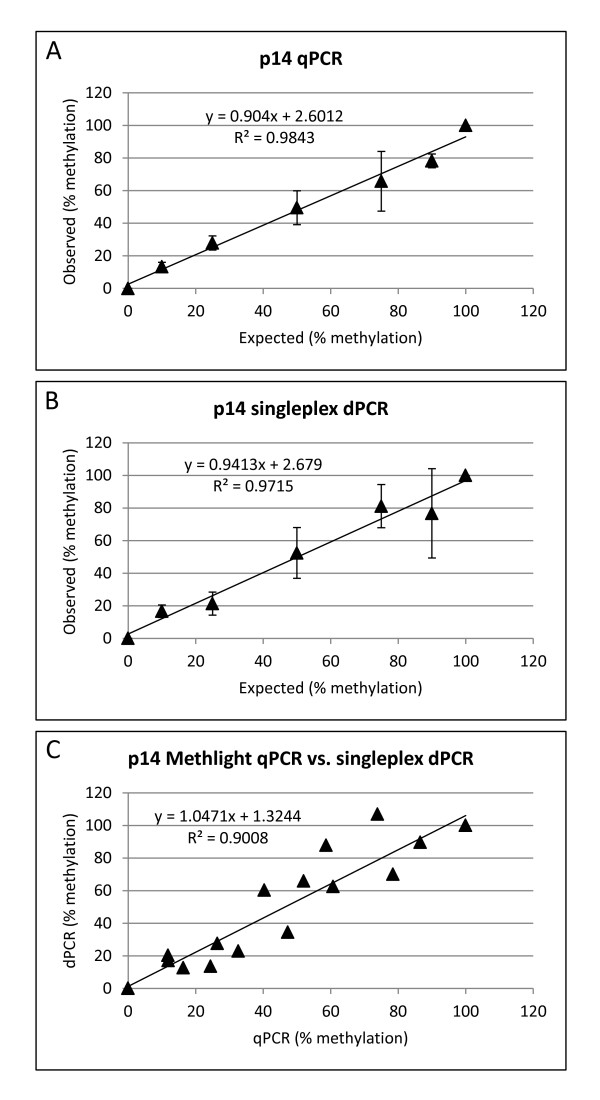
Background: DNA methylation is an important epigenetic mechanism in several human diseases, most notably cancer. The quantitative analysis of DNA methylation patterns has the potential to serve as diagnostic and prognostic biomarkers, however, there is currently a lack of consensus regarding the optimal methodologies to quantify methylation status. To address this issue we compared five analytical methods: (i) MethyLight qPCR, (ii) MethyLight digital PCR (dPCR), methylation-sensitive and -dependent restriction enzyme (MSRE/MDRE) digestion followed by (iii) qPCR or (iv) dPCR, and (v) bisulfite amplicon next generation sequencing (NGS). The techniques were evaluated for linearity, accuracy and precision.

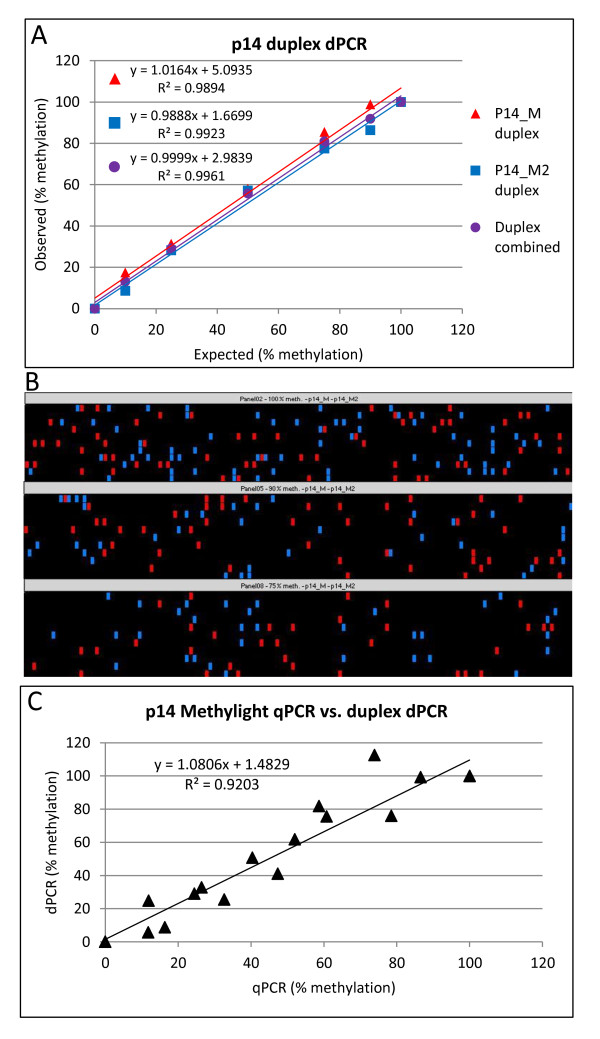
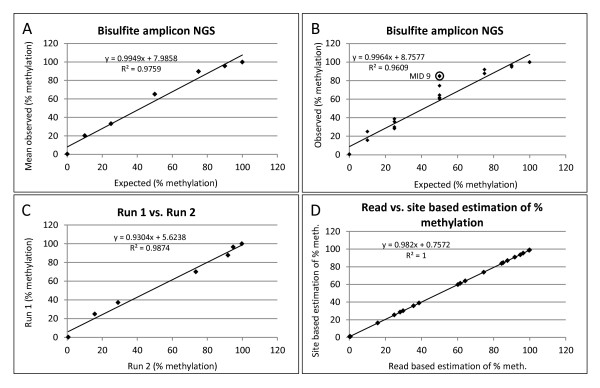
Results: MethyLight qPCR displayed the best linearity across the range of tested samples. Observed methylation measured by MethyLight- and MSRE/MDRE-qPCR and -dPCR were not significantly different to expected values whilst bisulfite amplicon NGS analysis over-estimated methylation content. Bisulfite amplicon NGS showed good precision, whilst the lower precision of qPCR and dPCR analysis precluded discrimination of differences of < 25% in methylation status. A novel dPCR MethyLight assay is also described as a potential method for absolute quantification that simultaneously measures both sense and antisense DNA strands following bisulfite treatment.

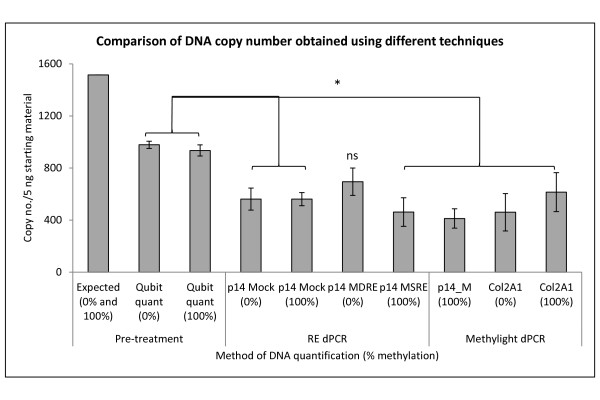
Conclusions: Our findings comprise a comprehensive benchmark for the quantitative accuracy of key methods for methylation analysis and demonstrate their applicability to the quantification of circulating tumour DNA biomarkers by using sample concentrations that are representative of typical clinical isolates.


Figures

Figure 1
Figure 1
Restriction enzyme qPCR and dPCR. Correlation between expected and observed percent methylation for Methylation Dependent Restriction Enzyme (MDRE) (A,C) and Methylation Sensitive Restriction Enzyme (MSRE) (B,D) qPCR (A,B) and dPCR (C,D) analysis. Correlation performed with samples which comprise the optimal working range of the respective enzyme classes: 0-50% for MSRE (B,D) and 50-100% for MDRE (A,C) (dotted lines). Data points that were outside the viable range of the assay (< 0% or > 100% methylation) were removed from the analysis. All experimental conditions were n = 3 with the exception of the following which were n = 2: 10% and 25% MDRE qPCR and 90% MSRE qPCR (expected % methylation). Error bars show ± Standard Deviation of three independent replicate measurements. (E) Correlation between RE qPCR vs. dPCR measurements using the data points in which the restriction enzymes are within their optimal working range. A single outlying data point was removed from the correlation analysis. All correlations were significant at p < 0.0001 except for expected vs. MDRE dPCR which was p = 0.0011.
Figure 2
Figure 2
MethyLight qPCR and singleplex dPCR. Correlation between expected and observed % methylation for MethyLight qPCR (A) and singleplex dPCR (B) using the p14_M assay. Error bars show ± Standard Deviation of three independent replicate measurements. (C) Correlation between MethyLight qPCR vs. singleplex dPCR. All correlations were significant at p < 0.0001.
Figure 3
Figure 3
MethyLight duplex dPCR. (A) Duplex p14 dPCR assay showing data for p14_M and p14_M2 assays separately and with estimated targets for both assays combined. (B) dPCR heatmap showing distribution of p14_M (red) and p14_M2 (blue) positive chambers in a duplex reaction showing three example panels of a dPCR plate. (C) Correlation between MethyLight qPCR vs. duplex dPCR (estimated targets for both assays combined). All correlations were significant at p < 0.0001.
Figure 4
Figure 4
Comparison of DNA copy numbers obtained using different techniques. DNA copy numbers of methylated/unmethylated DNA standards based on specifications of manufacturer (Expected), measured by flourometer and of p14 by Restriction Enzyme (RE) dPCR and p14 and COL2A1 with MethyLight dPCR in the 0% and 100% methylated samples. Copy numbers shown were obtained from 5 ng starting material (based on expected DNA quantity), pre-bisulfite conversion and RE digestion. RE dPCR data shows p14 copy number from the mock, MSRE and MDRE treatments. MethyLight dPCR data shows copy number obtained using the p14_M assay in singleplex and the methylation independent control COL2A1. Statistical comparisons are for Student’s t-test (* = p < 0.05; ns = not significant). Error bars show ± Standard Deviation of measurement.
Figure 5
Figure 5
Bisulfite Amplicon NGS. Analysis showing read-based estimates of percent methylation (A-C). (A,B) Correlation between expected and observed percent methylation showing (A) average percent methylation for all samples across both amplicon NGS experiments or (B) all data points plotted individually excluding Multiplex Identifier (MID)9 samples from the analysis in A and B. (C) Correlation between two bisulfite amplicon NGS experiments (including MID9). (D) Correlation between read- and site-based estimates of percent methylation. All correlations were significant at p < 0.0001.

References

    1. Robertson KD. DNA methylation and human disease. Nat Rev Genet. 2005;6(8):597–610. doi: 10.1038/nrg1655. - DOI - PubMed
    1. Jones PA, Baylin SB. The fundamental role of epigenetic events in cancer. Nat Rev Genet. 2002;3(6):415–428. - PubMed
    1. Irizarry RA, Ladd-Acosta C, Wen B, Wu Z, Montano C, Onyango P, Cui H, Gabo K, Rongione M, Webster M, Ji H, Potash JB, Sabunciyan S, Feinberg AP. The human colon cancer methylome shows similar hypo- and hypermethylation at conserved tissue-specific CpG island shores. Nat Genet. 2009;41(2):178–186. doi: 10.1038/ng.298. - DOI - PMC - PubMed
    1. Rakyan VK, Down TA, Balding DJ, Beck S. Epigenome-wide association studies for common human diseases. Nat Rev Genet. 2011;12(8):529–541. doi: 10.1038/nrg3000. - DOI - PMC - PubMed
    1. Issa JP. CpG island methylator phenotype in cancer. Nat Rev Cancer. 2004;4(12):988–993. doi: 10.1038/nrc1507. - DOI - PubMed

Publication types