

Spatial clustering of physical activity and obesity in relation to built environment factors among older women in three U.S. states
- PMID: 25539978
- PMCID: PMC4364109
- DOI: 10.1186/1471-2458-14-1322
Spatial clustering of physical activity and obesity in relation to built environment factors among older women in three U.S. states
Abstract
Background: Identifying spatial clusters of chronic diseases has been conducted over the past several decades. More recently these approaches have been applied to physical activity and obesity. However, few studies have investigated built environment characteristics in relation to these spatial clusters. This study's aims were to detect spatial clusters of physical activity and obesity, examine whether the geographic distribution of covariates affects clusters, and compare built environment characteristics inside and outside clusters.
Methods: In 2004, Nurses' Health Study participants from California, Massachusetts, and Pennsylvania completed survey items on physical activity (N = 22,599) and weight-status (N = 19,448). The spatial scan statistic was utilized to detect spatial clustering of higher and lower likelihood of obesity and meeting physical activity recommendations via walking. Clustering analyses and tests that adjusted for socio-demographic and health-related variables were conducted. Neighborhood built environment characteristics for participants inside and outside spatial clusters were compared.
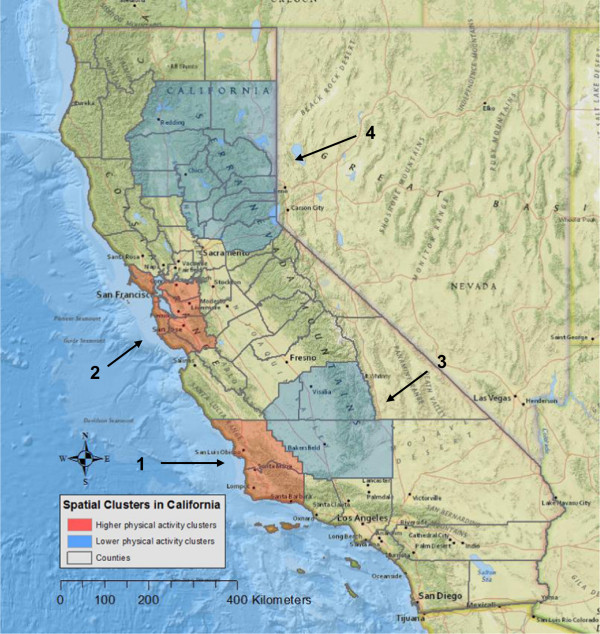
Results: Seven clusters of physical activity were identified in California and Massachusetts. Two clusters of obesity were identified in Pennsylvania. Overall, adjusting for socio-demographic and health-related covariates had little effect on the size or location of clusters in the three states with a few exceptions. For instance, adjusting for husband's education fully accounted for physical activity clusters in California. In California and Massachusetts, population density, intersection density, and diversity and density of facilities in two higher physical activity clusters were significantly greater than in neighborhoods outside of clusters. In contrast, in two other higher physical activity clusters in California and Massachusetts, population density, diversity of facilities, and density of facilities were significantly lower than in areas outside of clusters. In Pennsylvania, population density, intersection density, diversity of facilities, and certain types of facility density inside obesity clusters were significantly lower compared to areas outside the clusters.
Conclusions: Spatial clustering techniques can identify high and low risk areas for physical activity and obesity. Although covariates significantly differed inside and outside the clusters, patterns of differences were mostly inconsistent. The findings from these spatial analyses could eventually facilitate the design and implementation of more resource-efficient, geographically targeted interventions for both physical activity and obesity.
Figures


References
-
- Physical Activity Guidelines Advisory Committee . Physical Activity Guidelines Advisory Committee Report. Washington, DC: U.S. Department of Health and Human Services; 2008. - PubMed
-
- WHO Global Infobase. https://apps.who.int/infobase/Index.aspx
-
- Paterson DH, Jones GR, Rice CL. Ageing and physical activity: evidence to develop exercise recommendations for older adults. Can J Public Health. 2007;98(Suppl 2):S69–108. - PubMed
Pre-publication history
-
- The pre-publication history for this paper can be accessed here: http://www.biomedcentral.com/1471-2458/14/1322/prepub
Publication types
MeSH terms
Grants and funding
LinkOut - more resources
Full Text Sources
Other Literature Sources
Medical
Miscellaneous
