. 2015 Mar;89(5):2777-91.
doi: 10.1128/JVI.03117-14. Epub 2014 Dec 24.

Circovirus transport proceeds via direct interaction of the cytoplasmic dynein IC1 subunit with the viral capsid protein

Affiliations

Circovirus transport proceeds via direct interaction of the cytoplasmic dynein IC1 subunit with the viral capsid protein

Jingjing Cao et al. J Virol. 2015 Mar.

Abstract

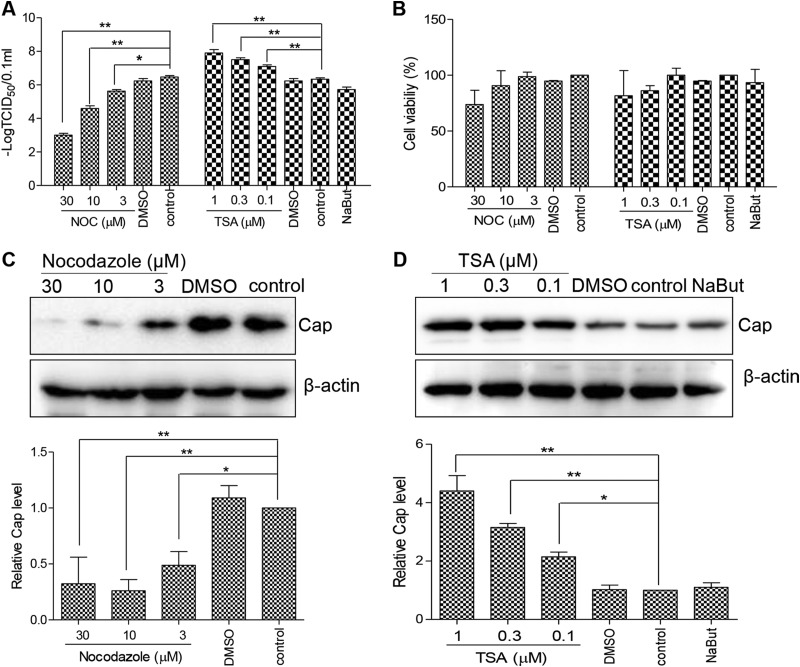
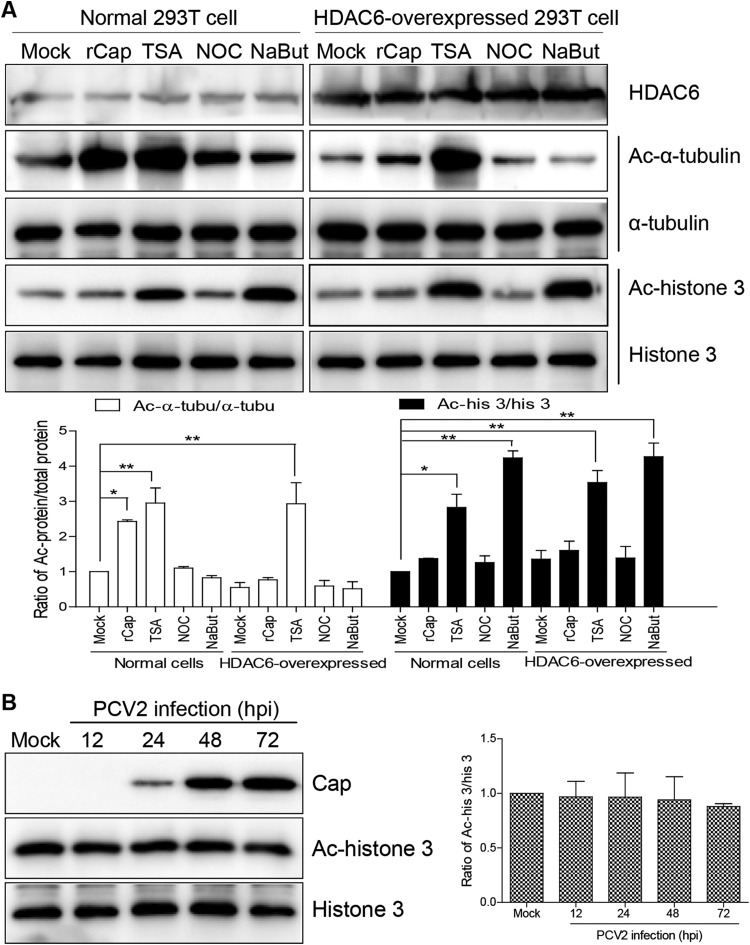
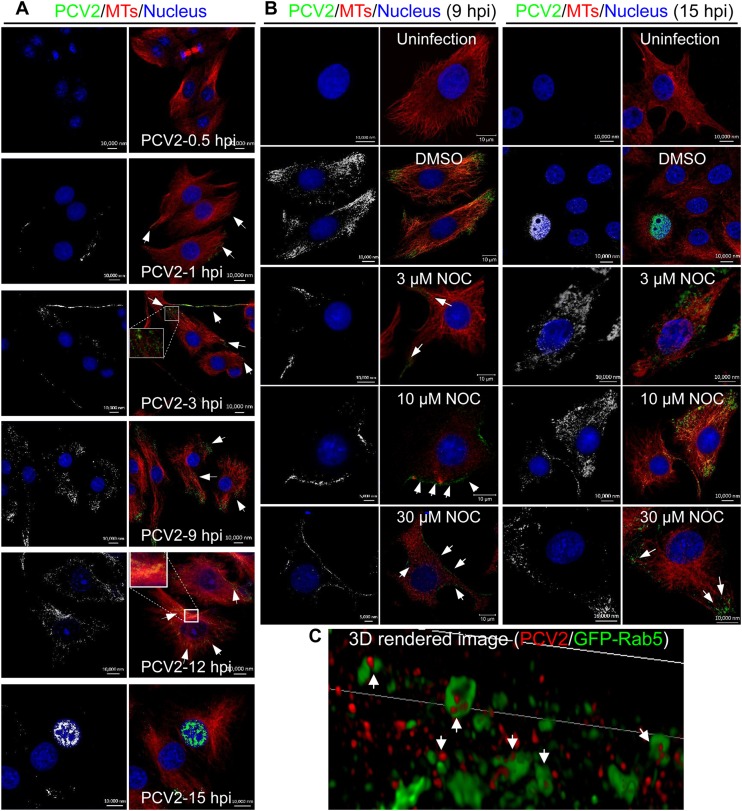
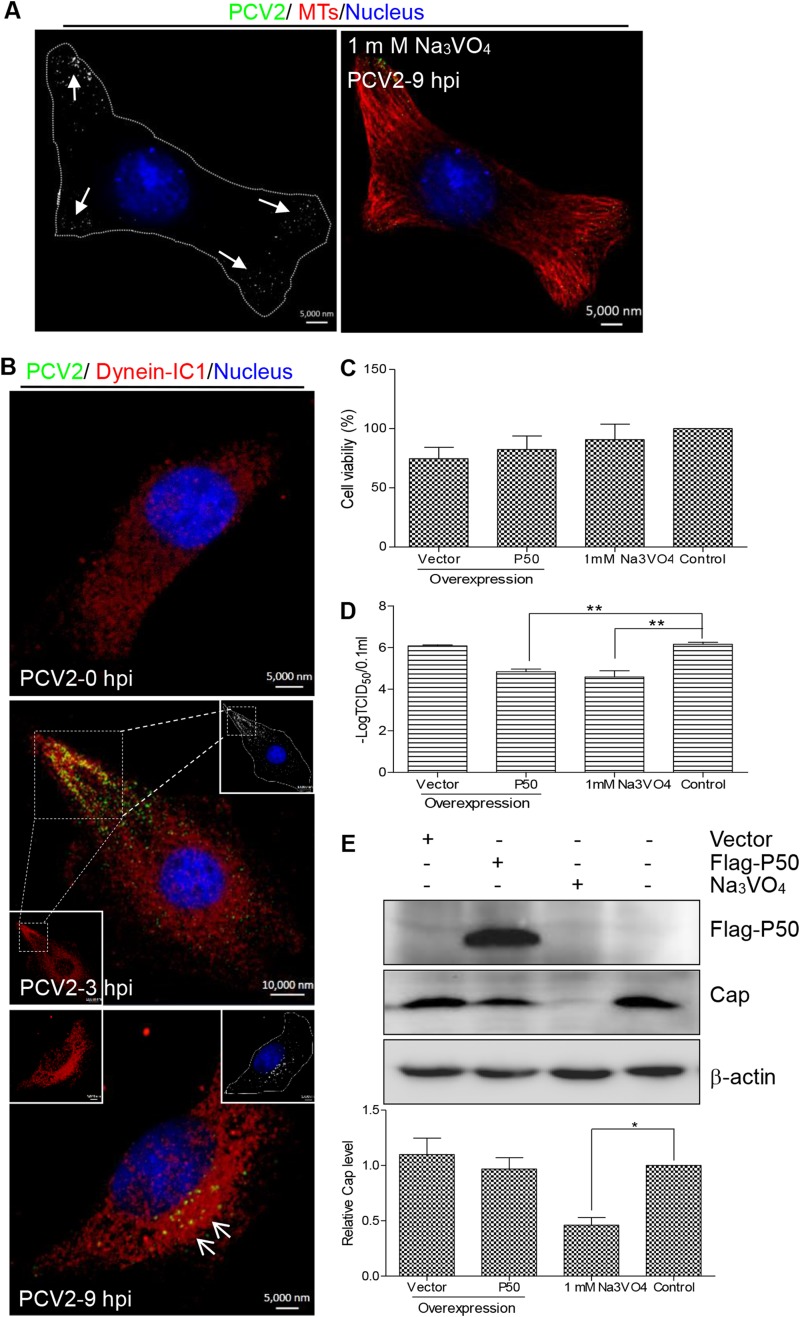
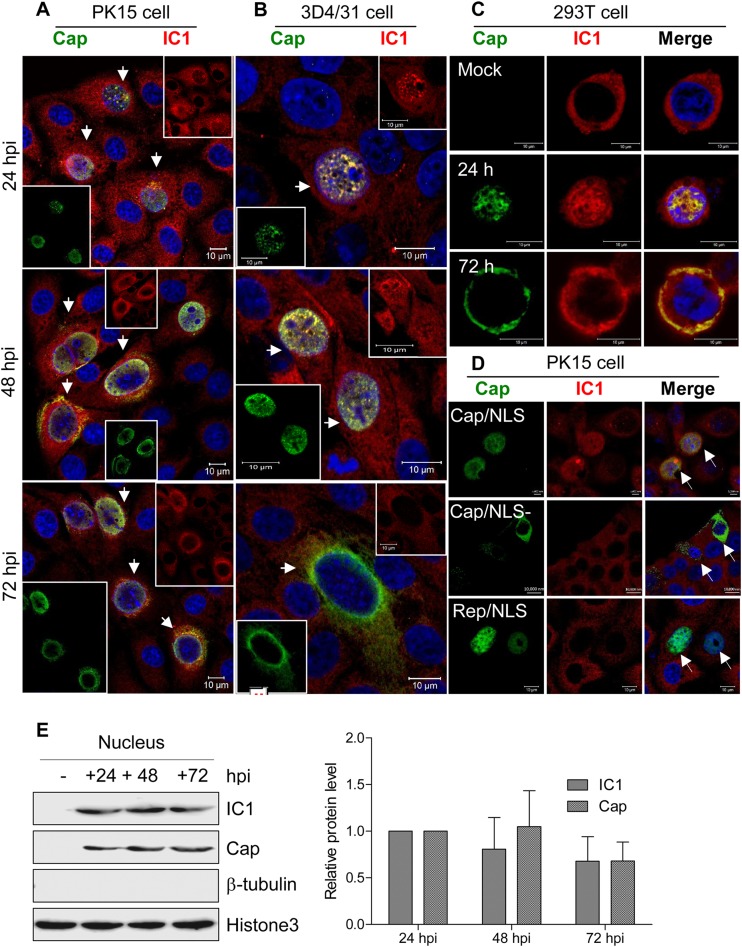
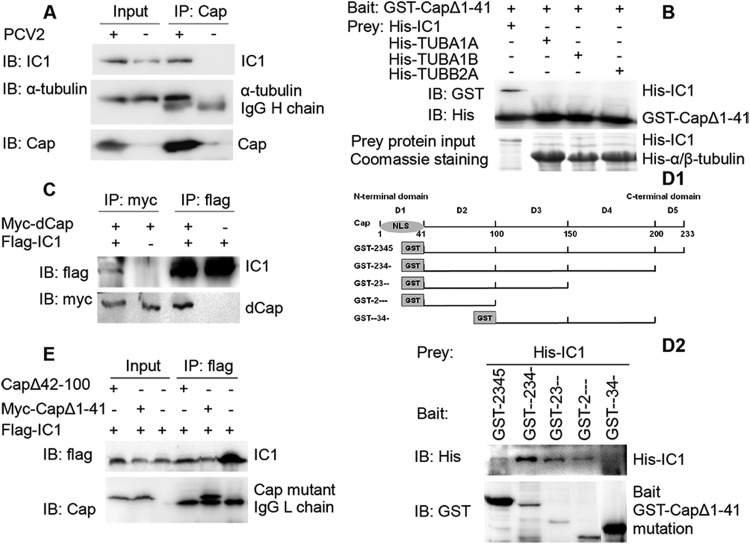
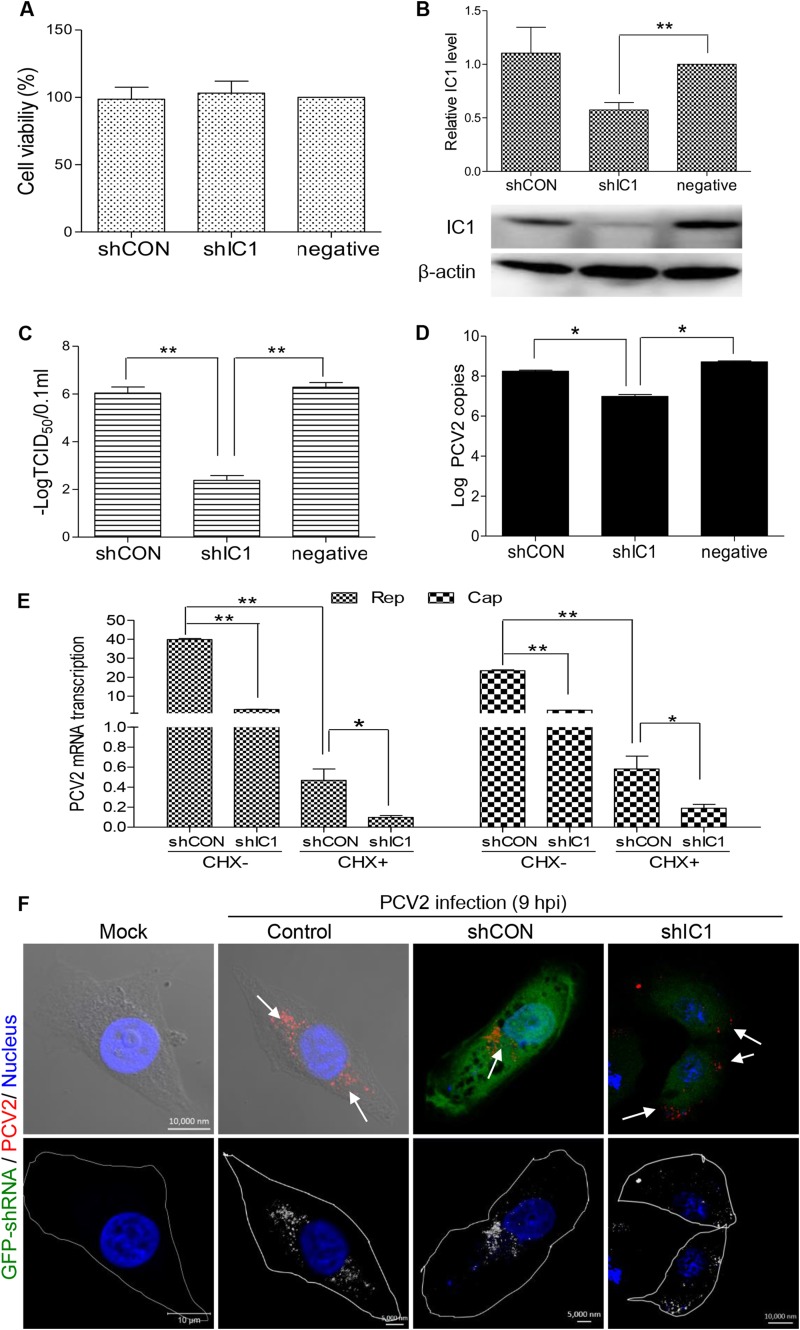
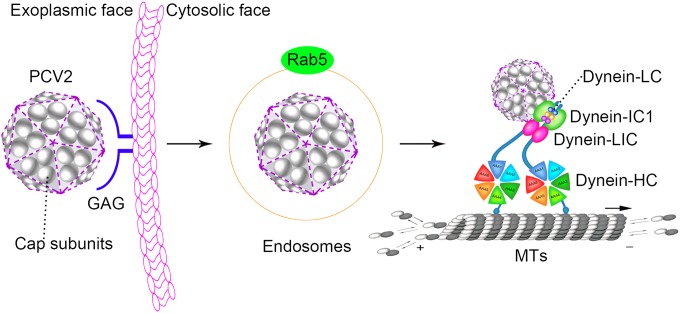
Microtubule transport of circovirus from the periphery of the cell to the nucleus is essential for viral replication in early infection. How the microtubule is recruited to the viral cargo remains unclear. In this study, we observed that circovirus trafficking is dependent on microtubule polymerization and that incoming circovirus particles colocalize with cytoplasmic dynein and endosomes. However, circovirus binding to dynein was independent of the presence of microtubular α-tubulin and translocation of cytoplasmic dynein into the nucleus. The circovirus capsid (Cap) subunit enhanced microtubular acetylation and directly interacted with intermediate chain 1 (IC1) of dynein. N-terminal residues 42 to 100 of the Cap viral protein were required for efficient binding to the dynein IC1 subunit and for retrograde transport. Knockdown of IC1 decreased virus transport and replication. These results demonstrate that Cap is a direct ligand of the cytoplasmic dynein IC1 subunit and an inducer of microtubule α-tubulin acetylation. Furthermore, Cap recruits the host dynein/microtubule machinery to facilitate transport toward the nucleus by an endosomal mechanism distinct from that used for physiological dynein cargo.

Importance: Incoming viral particles hijack the intracellular trafficking machinery of the host in order to migrate from the cell surface to the replication sites. Better knowledge of the interaction between viruses and virus proteins and the intracellular trafficking machinery may provide new targets for antiviral therapies. Currently, little is known about the molecular mechanisms of circovirus transport. Here, we report that circovirus particles enter early endosomes and utilize the microtubule-associated molecular motor dynein to travel along microtubules. The circovirus capsid subunit enhances microtubular acetylation, and N-terminal residues 42 to 100 directly interact with the dynein IC1 subunit during retrograde transport. These findings highlight a mechanism whereby circoviruses recruit dynein for transport to the nucleus via the dynein/microtubule machinery.


Figures

FIG 1
FIG 1
Depolymerization and deacetylation of microtubules inhibits PCV2 infection. (A) PK15 cells were treated with different concentrations of nocodazole (NOC) or trichostatin A (TSA) or DMSO (control) for 3 h or with 3 mM sodium butyrate (NaBut) for 6 h and were then infected with PCV2 at an MOI of 1 for 48 h. Virus titers were determined and are represented by TCID50 values. (B) PK15 cells were treated for 3 or 6 h, and cell viability was analyzed by a CCK-8 assay. (C and D) Lysates of the cells described for panel A were probed with anti-Cap and anti-β-actin antibodies in immunoblotting experiments.
FIG 2
FIG 2
Acetylation modifications of α-tubulin and histone 3. (A) 293T cells and HDAC6-overexpressing 293T cells were treated with purified rCap for 6 h, TSA for 3 h, NOC for 3 h, or NaBut for 6 h, and immunoblots of cell lysates was probed with mouse anti-acetylated α-tubulin MAb and rabbit anti-acetylated histone 3 antibody to analyze the level of acetylated α-tubulin and histone 3. Data are represented as means ± standard deviations (SD) (n = 3; one asterisk [*] represents P < 0.05, and two asterisks [**] represent P < 0.01) Ac, acetylated. (B) PK15 cells were infected with PCV2 for 12, 24, 48, and 72 h. Cell lysates were probed with anti-Cap, anti-acetylated histone 3, and anti-histone 3 antibodies in immunoblotting experiments.
FIG 3
FIG 3
Superresolution microscopy of PCV2 in early endosomes. (A) PK15 cells were infected with PCV2 at an MOI of 25 and cultured for 0.5, 1, 3, 9, 12, and 15 h. Confocal microscopy was performed to examine viral particles (green) with mouse anti-Cap IgG, microtubules (MTs; red) with rabbit anti-α-tubulin antibodies, and the nucleus with DAPI (blue). The white arrows show magnification of the virus enrichment area in the infected cells. (B) PK15 cells were treated with different concentrations of NOC or DMSO for 3 h and then infected with PCV2 at an MOI of 25 for 9 h or 15 h. Mock-infected PK15 cells served as controls. Confocal microscopy was performed to examine the subcellular localization of the viral particles using rabbit anti-α-tubulin and mouse anti-Cap IgG overnight at 4°C followed by staining with anti-rabbit Alexa 546 and anti-mouse FITC secondary antibodies. White arrows represent the subcellular localization of viral particles (green). (C) PK15 cells were transfected with GFP-Rab5 plasmid for 24 h and infected with PCV2 at an MOI of 25. Virus was added to the cells in an initial cold binding step to synchronize the infection process. At 6 hpi, cells were incubated with mouse anti-Cap IgG overnight at 4°C, followed by staining with anti-mouse Alexa Fluor 546. Rendered three-dimensional (3D) images of PCV2 particles (red) within endosomes (green) are shown.
FIG 4
FIG 4
Incoming PCV2 capsids recruited cytoplasmic dynein. (A) PK15 cells were pretreated with 1 mM Na3VO4 for 3 h and then infected with PCV2 at an MOI of 25 for 9 h. Subcellular localization of viral particles (green) was examined by confocal microscopy with mouse anti-Cap IgG, microtubules (red) with rabbit anti-α-tubulin antibodies, and the nucleus with DAPI (blue). (B) PK15 cells were infected with PCV2 at an MOI of 25 for 3 h or 9 h and then stained for confocal microscopy using rabbit anti-IC1 antibody (red) and mouse anti-Cap IgG (green). Mock-infected cells served as controls. The white box shows magnification and colocalization of the virus enrichment area in infected cells after 3 h. (C) PK15 cells were transfected with vector pCMV-Nflag-P50 for 24 h or pretreated with Na3VO4 for 3 h, and cell viability was analyzed by a CCK-8 assay. (D and E) PK15 cells were transfected with vector pCMV-Nflag-P50 or pretreated with Na3VO4. At 24 h posttransfection or at 3 h posttreatment with Na3VO4, cells were infected with PCV2 at an MOI of 1 and cultured for 48 h. Viral titers were detected by TCID50 (D), and Cap expression in the cell lysates was analyzed by immunoblotting using mouse anti-Cap IgG (E). Data represented are means ± SD (n = 3; two asterisks [**] represent P < 0.01).
FIG 5
FIG 5
Dynamic colocalization of Cap with dynein IC1 subunit. (A to C) Cells immunostained with pig anti-Cap IgG and mouse anti-IC1 antibody were stained with anti-pig FITC and anti-mouse Alexa 546, respectively. Colocalization of Cap with IC1 was determined at the indicated time points, including in PCV2-infected PK15 cells (A), PCV2-infected 3D4/31 cells (B), and 293T cells expressing exogenous Cap (C). (D) PK15 cells were transfected with the indicated plasmid expressing Cap (Cap/NLS [with NLS]), dCap (Cap/NLS− [without NLS]), or Rep (Rep/NLS [with NLS]). At 24 h posttransfection, cells were examined for the subcellular location of exogenous Cap, dCap, and Rep and of endogenous IC1 with pig anti-Cap IgG, pig anti-Rep pAb, and mouse anti-IC1 antibody, followed by staining with anti-pig FITC and anti-mouse Alexa 546. (E) The samples described for panel A were subjected to separation of subcellular components. The indicated proteins in the nuclear fraction were then tested by immunoblotting to validate intranuclear colocalization of Cap with IC1 in PCV2-infected PK15 cells.
FIG 6
FIG 6
Interaction of PCV2 Cap with dynein intermediate-chain IC1. (A) The lysates of PCV2 and mock-infected PK15 cells were immunoprecipitated with mouse anti-Cap IgG. Immunoblotting was then performed to determine the presence of IC1 and α-tubulin in the Cap immunoprecipitate. (B) Recombinant GST-dCap protein was immobilized on glutathione-Sepharose beads and incubated with recombinant His-IC1, His-TUBA1A, His-TUBA1B, or His-TUBB2A. His-tagged proteins in GST-pulldown assays were examined by immunoblotting with anti-His antibody. The levels of His-tagged proteins were determined by Coomassie blue staining. (C) 293T cells were cotransfected with a myc-tagged dCap expression plasmid together with a flag-IC1 expression plasmid. Only cells expressing myc-dCap or flag-IC1 were included as controls. Cell lysates were immunoprecipitated with an anti-flag antibody or an anti-myc antibody. The resulting precipitates were examined by immunoblotting using an anti-flag or an anti-myc antibody to examine the interaction between myc-dCap and flag-IC1. (D1 and D2) Identification of the IC1 interaction domain on Cap. (D1) Schematic representation of various truncated forms of the PCV2 Cap that were tagged with GST and used to identify the IC1 interaction domain. Constructs are named for each intact domain number, with a hyphen(s) indicating the removed domain(s). (D2) Bacterially expressed His-IC1 was incubated with various truncated forms of Cap tagged with GST and immobilized on glutathione-Sepharose beads. Immunoblotting was then performed to characterize the IC1 interaction domain on Cap. (E) Cells were cotransfected with plasmids expressing dCap (CapΔ1-41) or CapΔ42-100, together with a flag-IC1 expression plasmid. Immunoprecipitation and immunoblotting were then performed to examine the interactions between various forms of Cap and flag-IC1.
FIG 7
FIG 7
Effective infection of PCV2 is IC1 dependent. (A) The viability of PK15 cells stably expressing shIC1 was analyzed with a CCK-8 assay. (B) PK15 cells were transduced with lentivirus containing shRNA. The cell lysates of control shRNA (shCON) and IC1 shRNA-transduced PK15 cells (shIC1) were analyzed by immunoblotting to examine protein levels of IC1 and β-actin upon lentivirus transduction. (C) PK15 cells (negative) and shIC1- or shCON-transduced PK15 cells were each infected with PCV2 at an MOI of 1 for 72 h. Viral titers were then determined to analyze the effects of IC1 knockdown on PCV2 infectivity. (D) Experiments were performed as described for panel B, and virus DNA levels were quantified by real-time PCR to analyze the effect of IC1 knockdown on virus gene replication. (E) PK15 cells transduced (or not) with lentivirus were infected with PCV2 at an MOI of 1 for 8 h and treated with CHX for another 8 h. Cap and Rep mRNA transcripts of the PCV2 genome were determined by real-time comparative quantitative PCR and analyzed using 2−ΔΔCT means. (F) PK15 cells transduced (or not) with lentivirus were infected with PCV2 at an MOI of 25 for 9 h. Cells were incubated with mouse anti-Cap IgG overnight at 4°C and then stained with anti-mouse Alexa Fluor 546. Green fluorescence represents cells transduced with lentivirus and expressing GFP-shRNA. Subcellular localization of viral particles was examined by immunofluorescence confocal microscopy to analyze the effect of IC1 knockdown on viral transport. To make viral particles easier to view, they were inverted into gray-scale images. Values represent means ± SD of the results of three independent experiments performed in triplicate. One asterisk (*) represents P < 0.05; two asterisks (**) represent P < 0.01.
FIG 8
FIG 8
Schematic model depicting the entry and nuclear targeting of PCV2. PCV2 particles were localized with endosomes during the early stages of infection. Following release of the capsid from the early endosome, the capsid protein (gray) directly binds to the IC1 subunit of the dynein complex in order to travel along microtubules.

Similar articles

Cited by

References

    1. Biagini P, Bendinelli M, Hino S, Kakkola L, Mankertz A, Niel C, Okamoto H, Raidal S, Teo CG, Todd D. 2012. Circoviridae, p 343–349 InKing AMQ, Lefkowitz E, Adams MJ, Carstens EB (ed), Virus taxonomy: ninth report of the International Committee on Taxonomy of Viruses. Academic Press, London, United Kingdom.
    1. Tischer I, Gelderblom H, Vettermann W, Koch MA. 1982. A very small porcine virus with circular single-stranded DNA. Nature 295:64–66. doi:10.1038/295064a0. - DOI - PubMed
    1. Allan GM, McNeilly F, Kennedy S, Daft B, Clarke EG, Ellis JA, Haines DM, Meehan BM, Adair BM. 1998. Isolation of porcine circovirus-like viruses from pigs with a wasting disease in the U S A and Europe. J Vet Diagn Invest 10:3–10. doi:10.1177/104063879801000102. - DOI - PubMed
    1. Allan GM, Ellis JA. 2000. Porcine circoviruses: a review. J Vet Diagn Invest 12:3–14. doi:10.1177/104063870001200102. - DOI - PubMed
    1. Segalés J, Allan GM, Domingo M. 2005. Porcine circovirus diseases. Anim Health Res Rev 6:119–142. doi:10.1079/AHR2005106. - DOI - PubMed

Publication types

LinkOut - more resources