. 2015 Feb 15;26(4):622-35.
doi: 10.1091/mbc.E14-02-0740. Epub 2014 Dec 24.

Arrestins regulate cell spreading and motility via focal adhesion dynamics

Affiliations

Arrestins regulate cell spreading and motility via focal adhesion dynamics

Whitney M Cleghorn et al. Mol Biol Cell. .

Abstract

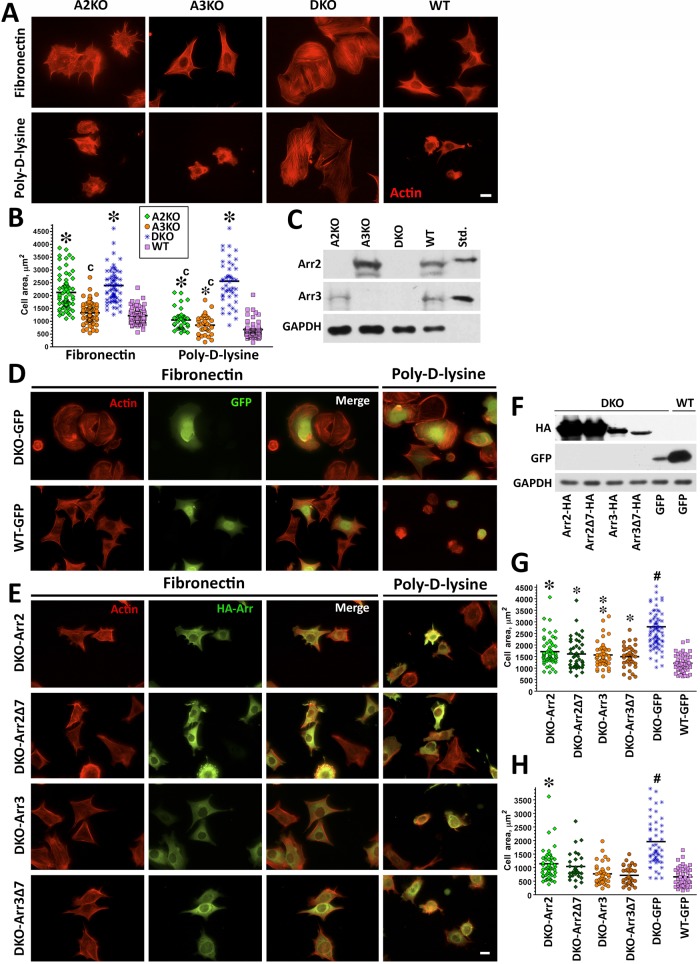
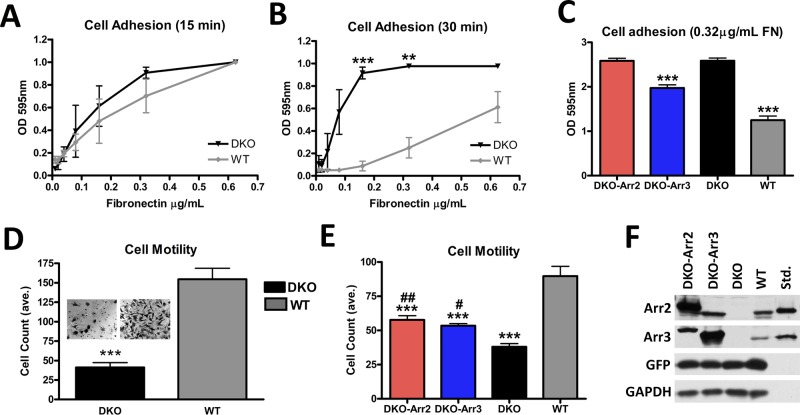
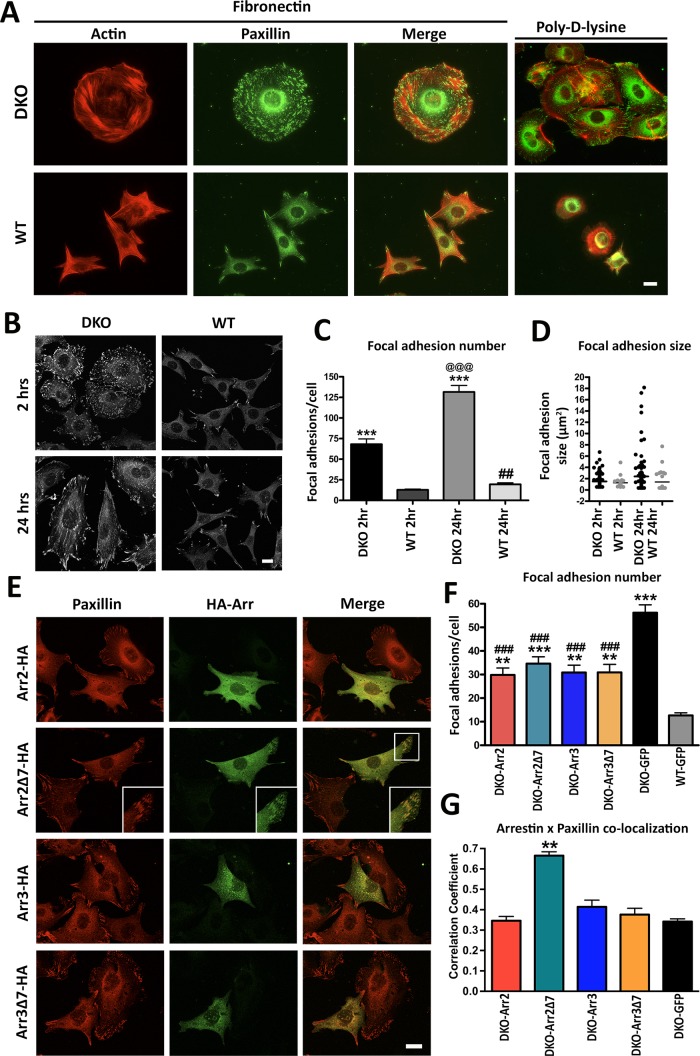
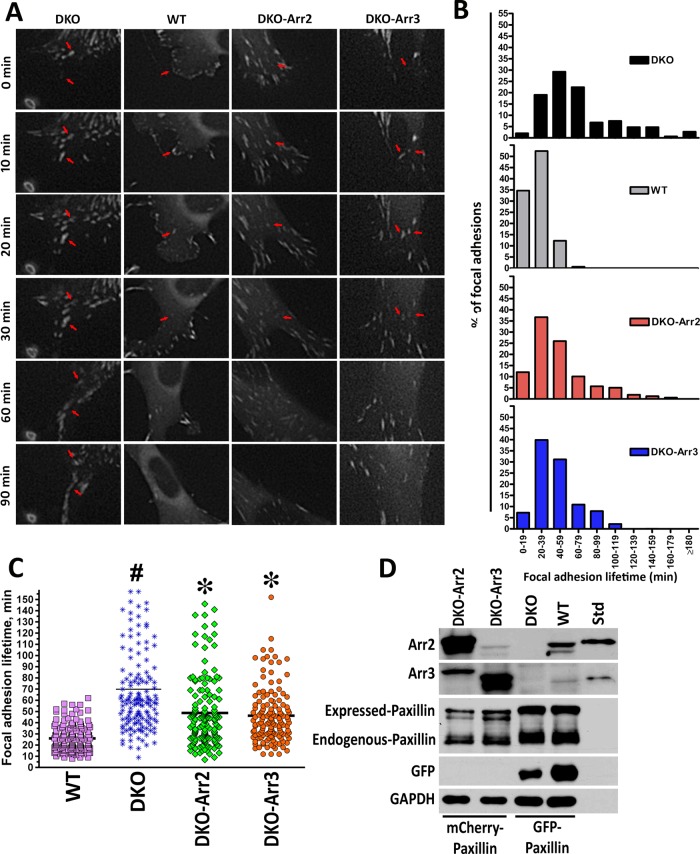
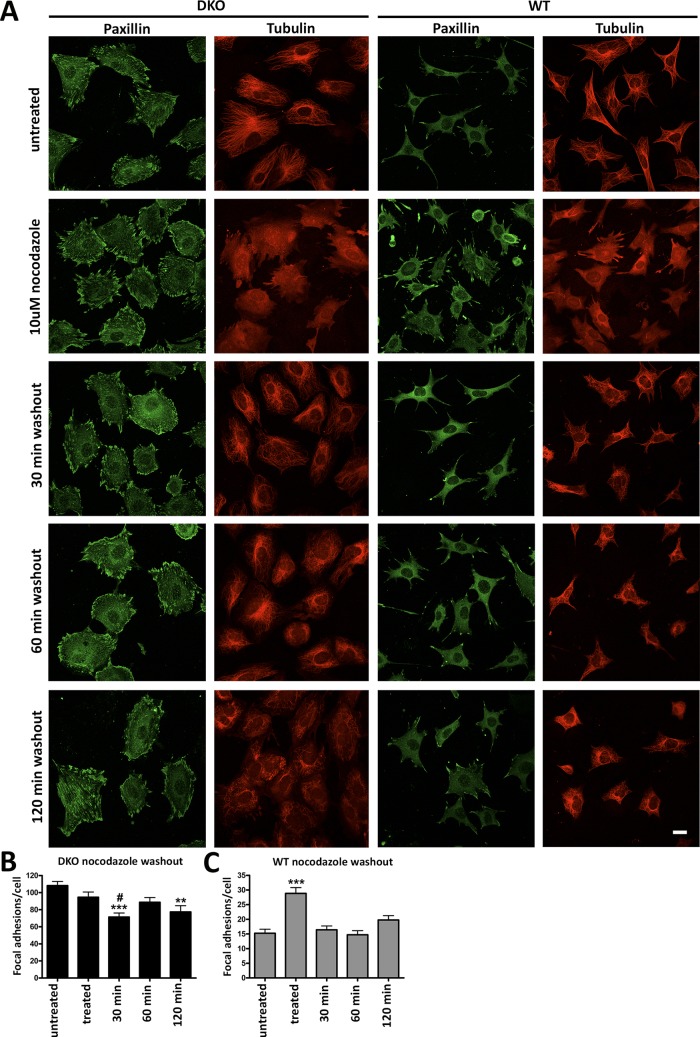
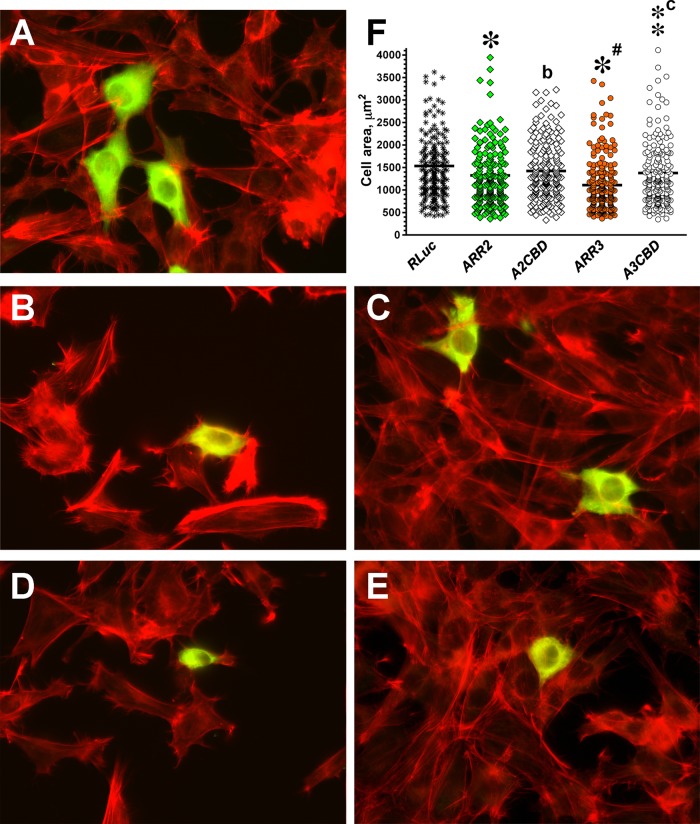
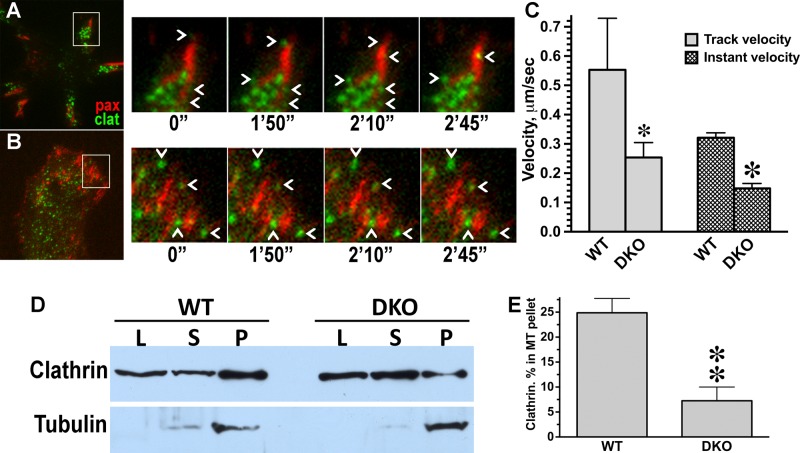
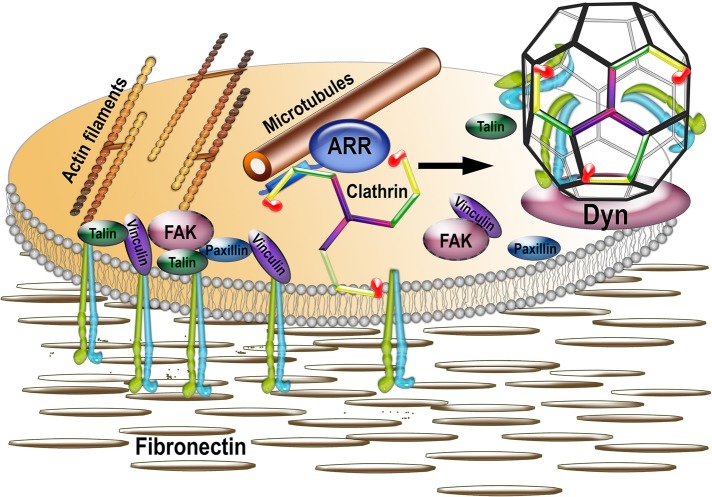
Focal adhesions (FAs) play a key role in cell attachment, and their timely disassembly is required for cell motility. Both microtubule-dependent targeting and recruitment of clathrin are critical for FA disassembly. Here we identify nonvisual arrestins as molecular links between microtubules and clathrin. Cells lacking both nonvisual arrestins showed excessive spreading on fibronectin and poly-d-lysine, increased adhesion, and reduced motility. The absence of arrestins greatly increases the size and lifespan of FAs, indicating that arrestins are necessary for rapid FA turnover. In nocodazole washout assays, FAs in arrestin-deficient cells were unresponsive to disassociation or regrowth of microtubules, suggesting that arrestins are necessary for microtubule targeting-dependent FA disassembly. Clathrin exhibited decreased dynamics near FA in arrestin-deficient cells. In contrast to wild-type arrestins, mutants deficient in clathrin binding did not rescue the phenotype. Collectively the data indicate that arrestins are key regulators of FA disassembly linking microtubules and clathrin.


Figures

FIGURE 1:
FIGURE 1:
Knockout of both nonvisual arrestins dramatically alters cytoskeleton. (A) Cells lacking arrestin-2 (A2KO), arrestin-3 (A3KO), or both (DKO) and WT cells were stained with rhodamine–phalloidin after spreading for 2 h on FN or PDL. Scale bar, 10 μm. (B) The size of 50 cells in each of the three experiments was quantified at each time point on FN or PDL. The cell size data were analyzed by Kruskal–Wallis analysis of variance, followed by posthoc pairwise comparison by Mann–Whitney test with Bonferroni correction for multiple comparisons. *p < 0.001 compared with WT, cp < 0.001 compared with DKO. (C) Expression of arrestins in DKO and WT cells was detected by Western blot. Purified bovine arrestin-2 and arrestin-3 (0.2 ng/lane) were run for comparison. (D, E) DKO cells were retrovirally infected with Ha-tagged arrestin-2 (Arr2), arrestin-2-Δ7 (Arr2Δ7), arrestin-3 (Arr3), arrestin-3-Δ7 (Arr3Δ7), or GFP as a control (DKO and WT). Cells were plated on FN and PDL. Arrestin-expressing cells were stained for actin and HA (E), and control cells were stained for actin and GFP (D). Scale bar, 10 μm. (F) Western blots showing the expression of HA-arrestins and GFP. GAPDH is used as a loading control. (G) Cell size was measured on FN and analyzed as described for B. #p < 0.001 DKO from all other conditions, *p < 0.001, **p < 0.01, *p < 0.05 to WT. Data are from 37–82 cells/condition from three or four experiments. (H) Cell size was measured on PDL from 29–54 cells in three experiments and analyzed as in B. #p < 0.001 for DKO from all other conditions, *p < 0.001 from WT.
FIGURE 2:
FIGURE 2:
Arrestins regulate cell migration and adhesion. (A, B) Adhesion was measured by plating cells on serial dilutions of FN (0.01–1.25 μg/ml) for 15 (A) or 30 (B) min. The data were analyzed by one-way analysis of variance (ANOVA) with arrestin type as the main factor, which was highly significant at 30 min. DKO cells showed a dramatic increase in their ability to adhere compared with WT cells, ***p < 0.001, **p < 0.01. Means ± SD from three experiments. (C) Adhesion of DKO cells expressing arrestin-2 + GFP, arrestin-3 + GFP, or GFP alone (controls). Cells were plated on 0.32 μg/ml FN. Means ± SD from 24 data points in three experiments. ***p < 0.001 compared with DKO. (D) Cells were plated in Transwell chambers coated with 0.32 μg/ml FN and allowed to migrate for 4 h. Cells were counted in six fields/chamber in each of four independent experiments. The data were analyzed by one-way ANOVA with cell type as the main factor, ***p <0.001. Insets, representative membranes postmigration. (E) Migration of DKO cells expressing arrestin-2 and GFP or arrestin-3 and GFP, or cells expressing GFP only (DKO and WT). Means ± SD from 5 fields/chamber from three independent experiments performed in duplicate analyzed by one-way ANOVA with cell type as the main factor. ***p < 0.001 compared with WT. DKO-Arr2, ##p < 0.01, and DKO-Arr3, #p < 0.05, compared with DKO. (F) Arrestin expression in DKO cells was determined using arrestin-2– or arrestin-3–specific antibodies, with corresponding purified bovine arrestins (0.1 ng/lane) run as standards.
FIGURE 3:
FIGURE 3:
Arrestin knockout increases number and size of focal adhesions. (A) Focal adhesions were detected in DKO and WT cells after 2 h on FN or PDL with anti-paxillin antibody. (B) Cells were plated on FN for 2 or 24 h, and focal adhesions were visualized by paxillin staining. (C) The focal adhesions in DKO and WT cells plated on FN for 2 or 24 h were quantified and analyzed by two-way ANOVA with genotype and time as main factors. ***p < 0.001 compared with WT, @@@p < 0.001 DKO 24 h compared with DKO 2 h, and ##p < 0.01 WT 24 h compared with WT 2h according to Bonferroni/Dunn posthoc test with correction for multiple comparisons. Means ± SD from three experiments (45–67 cells in each). (D) Distribution of focal adhesion size shown by scatter-plot. Focal adhesion size distributions were analyzed by nonparametric Kolmogorov–Smirnov test. Revealed differences: DKO 2 h, p = 0.0023; DKO 24 h, p < 0.0001; WT 24 h, p < 0.0001, as compared with WT 2 h. Data for 600–5000 focal adhesions. (E) Confocal images of DKO and WT cells expressing HA-tagged arrestins and stained for paxillin. Inset, arrestin-2-Δ7 colocalization with paxillin. (F) Focal adhesion number was calculated in arrestin-expressing DKO cells (25–50 cells/condition). Data were analyzed by one-way ANOVA with arrestin type as the main factor. **p < 0.01 DKO-arrestin-2, DKO-arrestin-3, DKO-arrestin-3Δ7 compared with WT; ***p < 0.001 DKO-arrestin-2-Δ7 compared with WT; ###p < 0.001 compared with DKO-GFP according to Bonferroni/Dunn posthoc test with correction for multiple comparisons. Scale bar, 10 μm (A, B, and E). (G) Colocalization of paxillin (red) and arrestins or GFP control (green) was determined using Coloc2 function in ImageJ after background correction in cells expressing HA-arrestins and stained for HA and endogenous paxillin, as described in Materials and Methods.
FIGURE 4:
FIGURE 4:
Arrestins regulate focal adhesion dynamics. (A) DKO and WT cells expressing GFP-paxillin were viewed with DeltaVision Core microscope, and images were captured at 1-min intervals. Representative images at 0, 10, 20, 30, 60, and 90 min. Arrowheads indicate representative focal adhesions. Scale bar, 10 μm. FA lifetimes were determined by counting the number of sequential frames where individual FA (GFP-paxillin) is visible. (B) Histogram distributions of FA lifetimes in 20-min intervals. Data from two or three experiments (150 FAs in 15 cells for each cell type). All distributions are significantly different from each other (p < 0.0001), except for DKO-Arr2 and DKO-Arr3 FA lifetimes, according to nonparametric Kolmogorov–Smirnov test. (C) The distribution of FA lifetimes in indicated cells. *p < 0.001 to DKO; bp < 0.01, #p < 0.001 to WT according to Kruskal–Wallis nonparametric test (H = 170.637, p < 0.0001; H corrected for ties = 170.679, tied p < 0.001). The data were also analyzed with Mann–Whitney test for means (pairwise comparisons: WT–DKO p < 0.0001; DKO–DKO-Arr2 p < 0.0001; DKO–DKO-Arr3 p < 0.0001). (D) Expression of arrestins and tagged paxillin determined by Western blot with bovine arrestin-2 and arrestin-3 (0.1 ng/lane) as standards (Std).
FIGURE 5:
FIGURE 5:
Nocodazole treatment reveals different focal adhesion dynamics in WT and DKO cells. (A) DKO and WT cells were plated for 24 h and treated with or without 10 μM nocodazole for 2 h. Nocodazole was washed out, and microtubules were allowed to regrow for 30, 60, or 120 min. Paxillin and microtubules were visualized with respective antibodies. Scale bar, 10 μm. (B, C) Means ± SD number of FAs in 40–50 cells/condition. Data were analyzed by one-way ANOVA with treatment as the main factor, followed by Bonferroni/Dunn posthoc test with correction for multiple comparisons. (B) DKO cells: ***p < 0.001, 30-min washout compared with untreated cells; #p < 0.05 compared with treated cells; **p < 0.01, 120-min washout compared with untreated cells. (C) WT cells: ***p < 0.001, treated cells compared with all other conditions.
FIGURE 6:
FIGURE 6:
Arrestin interaction with clathrin contributes to arrestin-dependent regulation of cell morphology. (A–E) Representative images of DKO cells expressing HA-tagged arrestin stained with anti-HA antibodies (green) and rhodamine–phalloidin (red). (A) Control DKO MEFs transfected with HA-Rluc. (B) DKO MEFs transfected with WT arrestin-2. (C) DKO MEFs expressing clathrin binding–deficient A2CBD mutant. (D) DKO MEFs expressing WT arrestin-3. (E) DKO MEFS expressing A3CBD mutant. (F) Scatter plot showing the results of cell size analysis. The horizontal bars represent the medians. The cell size data were analyzed by Kruskal–Wallis analysis of variance, followed by posthoc pairwise comparison by Mann–Whitney test with Bonferroni correction for multiple comparisons. Data are from ∼200 cells/condition from four independent experiments. *p < 0.001, **p < 0.01; *p < 0.05, as compared with cells expressing RLuc; ap < 0.05; cp < 0.001, as compared with cells expressing corresponding WT arrestins.
FIGURE 7:
FIGURE 7:
Arrestins are required for normal clathrin dynamics at FA. (A, B) Frames from representative live-cell TIRF imaging sequences of MEFs coexpressing FA marker GFP-paxillin and mCherry-clathrin. (A) WT MEFs. (B) DKO MEFs. Cell overviews are shown on the left. Boxed regions from overviews are enlarged on the right over the time period of 2 min, 45 s. Chevrons indicate clathrin pits, which appear and disappear in WT but are stationary in DKO cell. (C) Velocity of clathrin pit movement at FA is significantly higher in WT than in DKO cells. *p < 0.05 for the track velocity, ★p < 0.001 for instant velocity, according to unpaired Student's t test. (D) DKO and WT MEFs were fractionated as described in Materials and Methods. Aliquots of lysate (L), supernatant (S), and microtubule pellet (P) were analyzed by Western blot using clathrin (top blot) and tubulin (bottom blot) antibodies. (E) The distribution of clathrin between supernatant and microtubule pellet was calculated for two experiments. **p < 0.01, unpaired Student's t test.
FIGURE 8:
FIGURE 8:
Model of the mechanism of focal adhesion disassembly. Focal adhesions are multiprotein complexes organized around clustered active integrins that bind extracellular matrix (shown as fibronectin). FAs are connected to actin filaments and include numerous structural and signaling proteins, such as talin, vinculin, paxillin, focal adhesion kinase (FAK), and so on. FAs are very dynamic, and their disassembly is facilitated by the proximity of microtubules and triggered by clathrin-dependent internalization of integrins. Our data suggest that nonvisual arrestins, known to interact with both microtubules and clathrin, serve as a link between the two, being delivered together with associated clathrin by microtubules to FAs. The delivery of arrestin-bound clathrin to FAs facilitates integrin internalization via clathrin-coated pits (with the help of dynamin, which pinches coated vesicles off of the membrane) and thus FA disassembly.

References

    1. Ahmed MR, Zhan X, Song X, Kook S, Gurevich VV, Gurevich EV. Ubiquitin ligase parkin promotes Mdm2-arrestin interaction but inhibits arrestin ubiquitination. Biochemistry. 2011;50:3749–3763. - PMC - PubMed
    1. Anthony DF, Sin YY, Vadrevu N, Advant N, Day JP, Byrne AM, Lynch MJ, Milligan G, Houslay MD, Baillie GS. b-Arrestin 1 inhibits the GTPase-activating protein function of ARHGAP21, promoting activation of RhoA following angiotensin II type 1A receptor stimulation. Mol Cell Biol. 2011;31:1066–1075. - PMC - PubMed
    1. Barnes WG, Reiter E, Violin JD, Ren XR, Milligan G, Lefkowitz RJ. b-Arrestin 1 and Gaq/11 coordinately activate RhoA and stress fiber formation following receptor stimulation. J Biol Chem. 2004;280:8041–8050. - PubMed
    1. Bhandari D, Trejo J, Benovic JL, Marchese A. Arrestin-2 interacts with the ubiquitin-protein isopeptide ligase atrophin-interacting protein 4 and mediates endosomal sorting of the chemokine receptor CXCR4. J Biol Chem. 2007;282:36971–36979. - PubMed
    1. Breitman M, Kook S, Gimenez LE, Lizama BN, Palazzo MC, Gurevich EV, Gurevich VV. Silent scaffolds: inhibition of JNK3 activity in the cell by a dominant-negative arrestin-3 mutant. J Biol Chem. 2012;287:19653–19664. - PMC - PubMed

Publication types

Grants and funding