. 2015 Feb 15;26(4):740-50.
doi: 10.1091/mbc.E14-08-1307. Epub 2014 Dec 24.

Clathrin-dependent entry and vesicle-mediated exocytosis define insulin transcytosis across microvascular endothelial cells

Affiliations

Clathrin-dependent entry and vesicle-mediated exocytosis define insulin transcytosis across microvascular endothelial cells

Paymon M Azizi et al. Mol Biol Cell. .

Abstract

Transport of insulin across the microvasculature is necessary to reach its target organs (e.g., adipose and muscle tissues) and is rate limiting in insulin action. Morphological evidence suggests that insulin enters endothelial cells of the microvasculature, and studies with large vessel-derived endothelial cells show insulin uptake; however, little is known about the actual transcytosis of insulin and how this occurs in the relevant microvascular endothelial cells. We report an approach to study insulin transcytosis across individual, primary human adipose microvascular endothelial cells (HAMECs), involving insulin uptake followed by vesicle-mediated exocytosis visualized by total internal reflection fluorescence microscopy. In this setting, fluorophore-conjugated insulin exocytosis depended on its initial binding and uptake, which was saturable and much greater than in muscle cells. Unlike its degradation within muscle cells, insulin was stable within HAMECs and escaped lysosomal colocalization. Insulin transcytosis required dynamin but was unaffected by caveolin-1 knockdown or cholesterol depletion. Instead, insulin transcytosis was significantly inhibited by the clathrin-mediated endocytosis inhibitor Pitstop 2 or siRNA-mediated clathrin depletion. Accordingly, insulin internalized for 1 min in HAMECs colocalized with clathrin far more than with caveolin-1. This study constitutes the first evidence of vesicle-mediated insulin transcytosis and highlights that its initial uptake is clathrin dependent and caveolae independent.


Figures

FIGURE 1:
FIGURE 1:
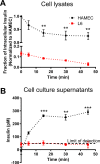
Insulin is stored and secreted in HAMECs but degraded in L6 myoblasts. (A) Insulin levels in lysates after a 5-min insulin pulse; data are normalized to initial levels in HAMECs. **p < 0.01 compared with initial time point. (B) Insulin levels in cell culture supernatants after a 5-min insulin pulse. **p < 0.01, ***p < 0.001 compared with initial time point.
FIGURE 2:
FIGURE 2:
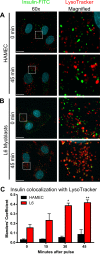
Insulin is not targeted to lysosomes in microvascular endothelial cells. (A) Insulin-FITC (green) does not colocalize significantly with LysoTracker (red) at early or late time points. Dashed box indicates area enlarged on the right; white scale, 15 μm. (B) Insulin and LysoTracker colocalization increases over time in L6 myoblasts. Dashed box indicates area enlarged on right; white scale, 15 μm. (C) Quantification of insulin-FITC colocalizing with LysoTracker over time using the Manders coefficient. *p < 0.05, **p < 0.01 compared with initial time point.
FIGURE 3:
FIGURE 3:
Insulin in microvascular endothelium is retained in a transferrin-positive compartment. (A) Insulin-FITC (green) colocalizes moderately with transferrin (red) at early and late time points in HAMECs. Dashed box indicates area enlarged on the right; white scale, 15 μm. (B) Insulin-FITC colocalization with transferrin-AF555 decreases over time in L6 myoblasts. Dashed box indicates area enlarged on the right; white scale, 15 μm. (C) Quantification of insulin colocalizing with transferrin over time using the Manders coefficient. *p < 0.05, ***p < 0.001 compared with initial time point.
FIGURE 4:
FIGURE 4:
Development of a novel single-cell assay to measure insulin transcytosis. (A) Schematic depicting the TIRF microscopy assay. A vesicle bearing fluorescent insulin is visualized as it enters the excitation zone of the endothelial cell and its signal is lost upon fusion with the basal plasmalemma. (B) Intensity profile of a tracked particle that undergoes exocytosis, causing a rapid loss of signal. (C) Intensity profile of a tracked particle undergoing Brownian diffusion (and photobleaching) but not exocytosis. (D) Varying the penetration depth of the TIRF laser does not affect detection events. (E) Transendothelial electrical resistance (TEER) drops after addition of histamine (2 mM) to top and bottom chambers of endothelial cells grown on Transwells (***p < 0.001 compared with initial time point) but (F) does not affect the average number of transcytosis events (data are normalized to control cells). (G) Addition of excess unlabeled insulin (50-fold) to the membrane-binding step essentially abrogates insulin-AF568 transcytosis, consistent with a receptor-mediated process. **p < 0.01 by one-sample t test; data are normalized to control cells. (H) Time course of insulin transcytosis in single cells using the TIRF assay.
FIGURE 5:
FIGURE 5:
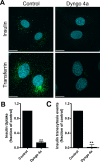
Insulin uptake and transcytosis are dynamin dependent. (A) Cells were treated with insulin-FITC or transferrin-AF555 for 10 min after pretreatment with 30 uM dyngo 4a (right) or vehicle (left) for 30 min to impair dynamin function. White scale, 15 μm. (B) Quantification of insulin-FITC uptake in HAMECs after pretreatment with dyngo 4a. **p < 0.01 by one sample t test; data are normalized to control cells. (C) Average transcytosis events after pretreatment with dyngo 4a. **p < 0.01 by one sample t test; data are normalized to control cells.
FIGURE 6:
FIGURE 6:
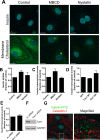
Insulin uptake and transcytosis do not require cholesterol or caveolin-1. (A) Cells were treated with insulin-FITC or D4 membrane cholesterol probe for 10 min after pretreatment with either 1 μM methyl-β-cyclodextrin (MBCD) or 50 μg/ml nystatin to deplete cells of cholesterol. White scale, 15 μm. (B) Quantification of insulin-FITC uptake in HAMECs after pretreatment with MBCD or nystatin; data are normalized to control cells. (C) Average transcytosis events after pretreatment with MBCD or nystatin. (D) Average transcytosis events of insulin-AF568 after transfection with wild-type or dominant-negative (DN) caveolin-1 construct. (E) Average transcytosis events of insulin-AF568 after caveolin-1 was knocked down by siRNA. (F) Immunoblot of caveolin-1 protein after knockdown via siRNA. (G) Insulin-FITC colocalizes only modestly with caveolin-1 (red). Colocalization was quantified via the Manders coefficient, which is 0.196 ± 0.011. Dashed box indicates area enlarged on the right; white scale, 15 μm.
FIGURE 7:
FIGURE 7:
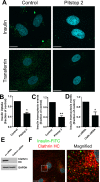
Insulin uptake and transcytosis are clathrin dependent. (A) Cells were treated with insulin-FITC or transferrin-AF555 for 10 min after pretreatment with 10 μM Pitstop 2 to impair clathrin-mediated uptake. White scale, 15 μm. (B) Quantification of insulin-FITC uptake in HAMECs after pretreatment with Pitstop 2. (C) Average insulin-AF568 transcytosis events after pretreatment with Pitstop 2. (D) Average insulin-AF568 transcytosis events after clathrin heavy chain was knocked down by siRNA. (E) Immunoblot of clathrin heavy chain protein after knockdown by siRNA. (F) Insulin-FITC (green) colocalizes with clathrin heavy chain (red). Colocalization was quantified via the Manders coefficient, which is 0.491 ± 0.020. Dashed box indicates area enlarged on the right; white scale, 15 μm.
FIGURE 8:
FIGURE 8:
Insulin colocalizes with caveolin-1 in HAECs. (A) Insulin-FITC (green) colocalizes with caveolin-1 (red) in HAECs. Dashed box indicates area enlarged on the right; white scale, 15 μm. (B) Insulin-FITC (green) colocalizes with clathrin heavy chain (red) to a much lesser extent than caveolin-1 in HAECs. Dashed box indicates area enlarged on the right; white scale, 15 μm. (C) Quantification of colocalization of insulin-FITC with caveolin-1 (0.411 ± 0.068) or clathrin heavy chain (0.196 ± 0.013) via the Manders coefficient.

References

    1. Aird WC. Phenotypic heterogeneity of the endothelium: I. Structure, function, and mechanisms. Circ Res. 2007a;100:158–173. - PubMed
    1. Aird WC. Phenotypic heterogeneity of the endothelium: II. Representative vascular beds. Circ Res. 2007b;100:174–190. - PubMed
    1. Armstrong SM, Khajoee V, Wang C, Wang T, Tigdi J, Yin J, Kuebler WM, Gillrie M, Davis SP, Ho M, et al. Co-regulation of transcellular and paracellular leak across microvascular endothelium by dynamin and Rac. Am J Pathol. 2012;180:1308–1323. - PubMed
    1. Barrett EJ, Wang H, Upchurch CT, Liu Z. Insulin regulates its own delivery to skeletal muscle by feed-forward actions on the vasculature. Am J Physiol Endocrinol Metabol. 2011;301:E252–E263. - PMC - PubMed
    1. Becherer U, Pasche M, Nofal S, Hof D, Matti U, Rettig J. Quantifying exocytosis by combination of membrane capacitance measurements and total internal reflection fluorescence microscopy in chromaffin cells. PLoS One. 2007;2:e505. - PMC - PubMed

Publication types