. 2015 Mar;66(5):1325-37.
doi: 10.1093/jxb/eru485. Epub 2014 Dec 24.

Apoplastic and intracellular plant sugars regulate developmental transitions in witches' broom disease of cacao

Affiliations

Apoplastic and intracellular plant sugars regulate developmental transitions in witches' broom disease of cacao

Joan Barau et al. J Exp Bot. 2015 Mar.

Abstract

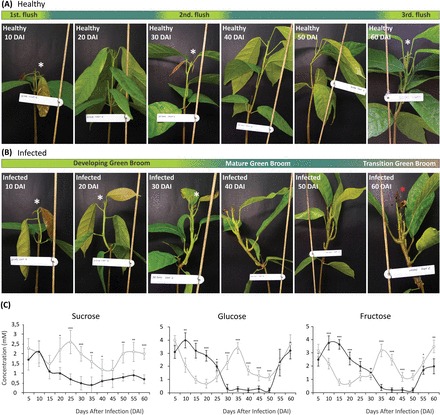
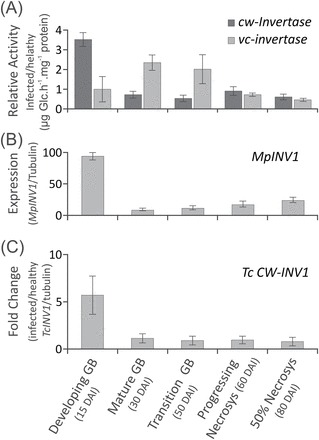
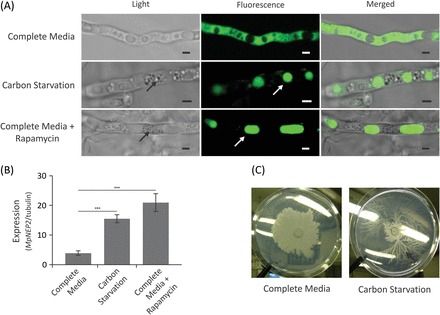
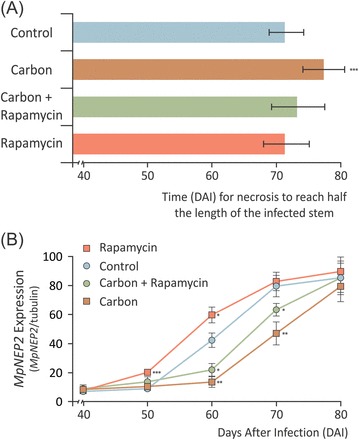
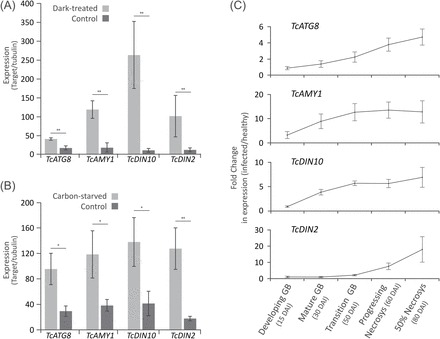
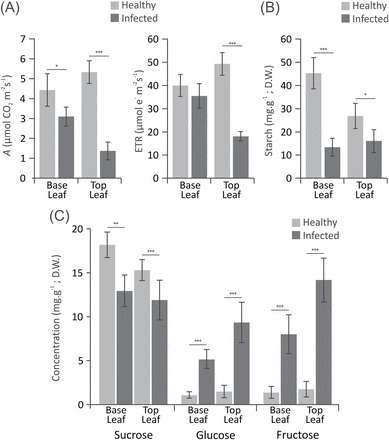
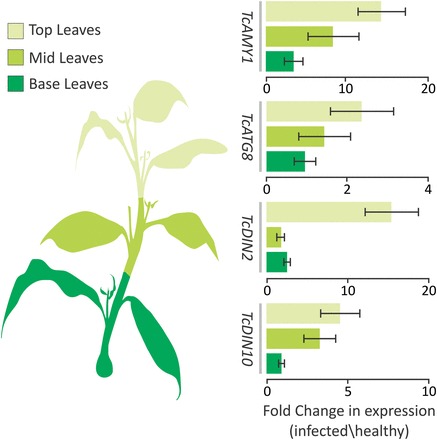
Witches' broom disease (WBD) of cacao differs from other typical hemibiotrophic plant diseases by its unusually long biotrophic phase. Plant carbon sources have been proposed to regulate WBD developmental transitions; however, nothing is known about their availability at the plant-fungus interface, the apoplastic fluid of cacao. Data are provided supporting a role for the dynamics of soluble carbon in the apoplastic fluid in prompting the end of the biotrophic phase of infection. Carbon depletion and the consequent fungal sensing of starvation were identified as key signalling factors at the apoplast. MpNEP2, a fungal effector of host necrosis, was found to be up-regulated in an autophagic-like response to carbon starvation in vitro. In addition, the in vivo artificial manipulation of carbon availability in the apoplastic fluid considerably modulated both its expression and plant necrosis rate. Strikingly, infected cacao tissues accumulated intracellular hexoses, and showed stunted photosynthesis and the up-regulation of senescence markers immediately prior to the transition to the necrotrophic phase. These opposite findings of carbon depletion and accumulation in different host cell compartments are discussed within the frame of WBD development. A model is suggested to explain phase transition as a synergic outcome of fungal-related factors released upon sensing of extracellular carbon starvation, and an early senescence of infected tissues probably triggered by intracellular sugar accumulation.

Keywords: Autophagy; Moniliophthora perniciosa; Theobroma cacao.; hemibiotrophic; senescence; starvation.


Figures

Fig. 1.
Fig. 1.
Development of WBD in cacao seedlings during the first 60 days after infection (DAI) of the time course experiment for assessing apoplastic fluid carbohydrate dynamics. (A) Representative pictures comparing the developmental stages of healthy plants (upper panel) and (B) infected plants (lower panel), highlighting the differences in the periods of apical meristem activity (white asterisks) and the first appearance of necrosis in infected plants (black asterisk). (C) Millimolar concentrations of sucrose, glucose, and fructose in the apoplastic fluid of healthy (open circles) and infected seedlings (filled circles). Data points represent the mean of four biological replicates with calculated standard deviations (unpaired Student’s t-test; *P<0.05; **P<0.005; ***P<0.0005). (This figure is available in colour at JXB online.)
Fig. 2.
Fig. 2.
Whole-tissue invertase enzymes activities and gene expression measured at key developmental stages of WBD, spanning from green broom stages (GB) to early necrosis. (A) Cell wall (cw-), and vacuolar (vac-) invertase activities portrayed as fold increase in infected tissues. (B) Gene expression of a conserved fungal secreted (extracellular) invertase present in the M. perniciosa genome. (C) Gene expression of a conserved cacao cw-invertase present in the T. cacao genome. Data points represent the mean value of three biological replicates with calculated standard deviations.
Fig. 3.
Fig. 3.
MpNEP2 is up-regulated under autophagic conditions triggered by carbon starvation in vitro. (A) Light, fluorescence, and merged microscopy images of a transgenic M. perniciosa strain expressing the autophagy reporter MpATG8-GFP. In complete medium (upper panel), hyphae show uniform cytoplasmic distribution of fluorescent-tagged ATG8 protein. In carbon starvation medium (middle panel) or in complete medium with rapamycin (lower panel), dense cytoplasmic granules (black arrows) and accumulation of protein into autophagic round vesicles are evident (white arrows). Scale bars=2 μm. (B) Relative MpNEP2 gene expression under carbon starvation in vitro and in the presence of carbon with rapamycin. Data points represent a mean value of three biological replicates with calculated standard deviations (unpaired Student’s t-test; ***P<0.0005). (C) M. perniciosa grows as dense colonies in complete defined medium in vitro, while under carbon starvation growth is stunted, with the occasional appearance of fast-growing sectors showing hyaline hyphae with pronounced branching (black arrow). (This figure is available in colour at JXB online.)
Fig. 4.
Fig. 4.
Manipulation of apoplastic fluid carbon availability alters MpNEP2 expression and the necrosis rate of infected tissues. (A) Time (in days ater infection) that necrotic symptoms took to cover 50% of the length of infected stems after infiltrations with solutions containing carbon (sucrose, glucose, and fructose at 10mM each), carbon with 400ng ml–1 rapamycin, and rapamycin only. (B) MpNEP2 gene expression assayed at 10 d intervals after infiltration of infected stems. Data points represent the mean of four biological replicates with calculated standard deviations (unpaired Student’s t-test; *P<0.05; **P<0.005; ***P<0.0005). (This figure is available in colour at JXB online.)
Fig. 5.
Fig. 5.
Cacao orthologues of markers of plant carbon starvation, TcATG8i (autophagy-related protein 8i), TcAMY1 (α-amylase), TcDIN10 (raffinose galactosyltransferase), and TcDIN2 (β-glucosidase) are up-regulated upon carbon starvation in both tissues and cells as well as during WBD development. (A) Expression of carbon starvation markers in cacao leaves upon whole-plant dark treatment for 7 d. (B) Expression of marker genes in cacao cell suspension cultures without sucrose for 48h. (C) Expression of marker genes in whole infected tissues collected at key stages of WBD development, spanning from green broom stages (GB) to early necrosis. Data points represent the mean value of three biological replicates with calculated standard deviations (unpaired Student’s t-test; *P<0.05; **P<0.005; ***P<0.0005).
Fig. 6.
Fig. 6.
A spatial pattern of photosynthesis down-regulation and soluble sugar accumulation in leaves of mature green brooms. (A) Mean photosynthesis (A) and electron transport rate (ETR) levels in the first (older, at the base) and last (younger, at the top) fully expanded leaves of mature green brooms (30 DAI). (B) Mean levels of starch, and (C) sucrose, glucose, and fructose measured in the same leaves assayed for photosynthesis. Data points represent the mean value of eight biological replicates with calculated standard deviation (unpaired Student’s t-test; *P<0.05; **P<0.005; ***P<0.0005).
Fig. 7.
Fig. 7.
Cocoa orthologues of markers of plant carbon starvation are up-regulated following a spatial pattern in mature brooms. Fold increase of marker genes assayed at three different positions (shading) within mature brooms, showing either a gradual increase towards the top (early responsive genes TcATG8, TcAMY1, and TcDIN10), or specific up-regulation at the top leaves (late responsive gene TcDIN10). Data points represent the mean value of three biological replicates with calculated standard deviations. (This figure is available in colour at JXB online.)

References

    1. Alvim FC, Mattos EM, Pirovani CP, Gramacho K, Pungartnik C, Brendel M, Cascardo JC, Vincentz M. 2009. Carbon source-induced changes in the physiology of the cacao pathogen Moniliophthora perniciosa (Basidiomycetes) affect mycelial morphology and secretion of necrosis-inducing proteins. Genetics and Molecular Research 8, 1035–1050. - PubMed
    1. Berger S, Sinha AK, Roitsch T. 2007. Plant physiology meets phytopathology: plant primary metabolism and plant–pathogen interactions. Journal of Experimental Botany 58, 4019–4026. - PubMed
    1. Bolton MD, Thomma BPHJ. 2008. The complexity of nitrogen metabolism and nitrogen-regulated gene expression in plant pathogenic fungi. Physiological and Molecular Plant Pathology 72, 104–110.
    1. Breeze E, Harrison E, McHattie S, et al. 2011. High-resolution temporal profiling of transcripts during Arabidopsis leaf senescence reveals a distinct chronology of processes and regulation. The Plant Cell 23, 873–894. - PMC - PubMed
    1. Brouwer B, Ziolkowska A, Bagard M, Keech O, Gardeström P. 2012. The impact of light intensity on shade-induced leaf senescence. Plant, Cell and Environment 35, 1084–1098. - PubMed

Publication types

LinkOut - more resources