. 2014 Dec 10:5:1431.
doi: 10.3389/fpsyg.2014.01431. eCollection 2014.

Reduced visual surround suppression in schizophrenia shown by measuring contrast detection thresholds

Affiliations

Reduced visual surround suppression in schizophrenia shown by measuring contrast detection thresholds

Ignacio Serrano-Pedraza et al. Front Psychol. .

Abstract

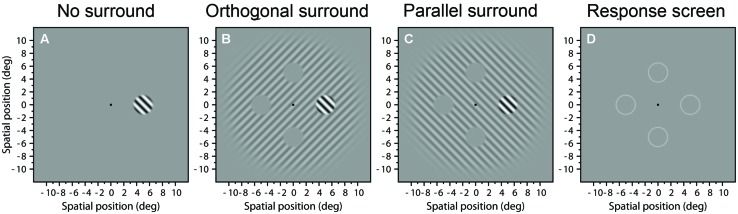
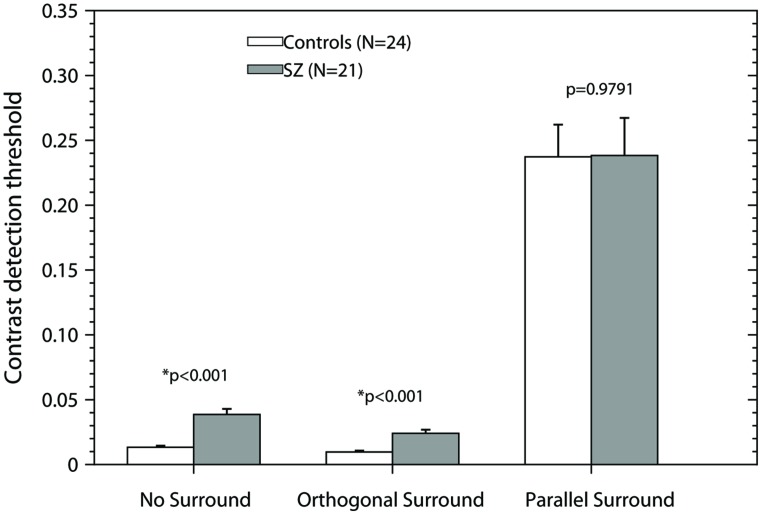
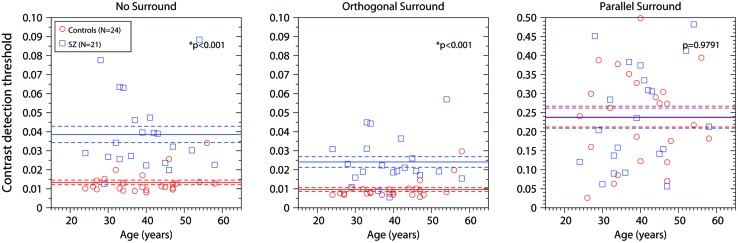
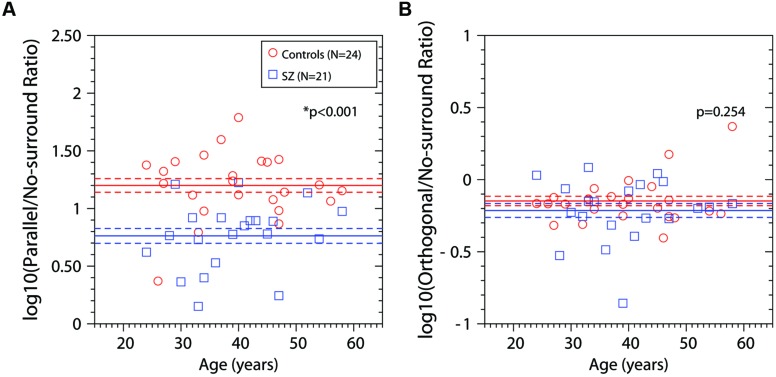
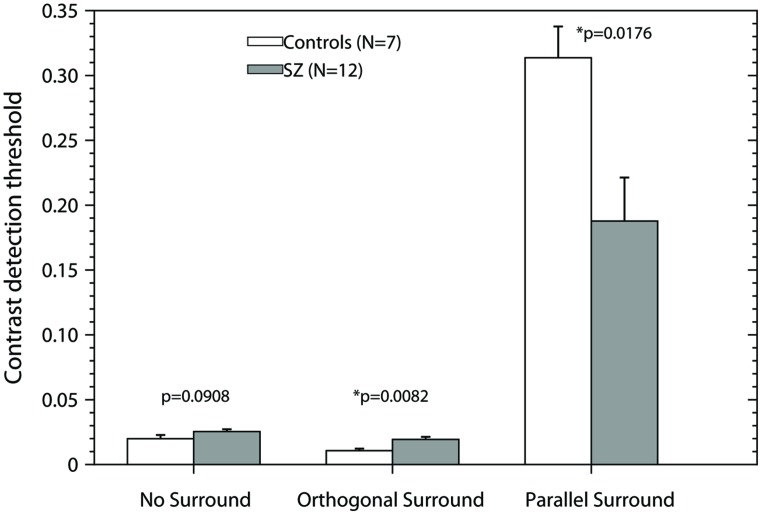
Visual perception in schizophrenia is attracting a broad interest given the deep knowledge that we have about the visual system in healthy populations. One example is the class of effects known collectively as visual surround suppression. For example, the visibility of a grating located in the visual periphery is impaired by the presence of a surrounding grating of the same spatial frequency and orientation. Previous studies have suggested abnormal visual surround suppression in patients with schizophrenia. Given that schizophrenia patients have cortical alterations including hypofunction of NMDA receptors and reduced concentration of GABA neurotransmitter, which affect lateral inhibitory connections, then they should be relatively better than controls at detecting visual stimuli that are usually suppressed. We tested this hypothesis by measuring contrast detection thresholds using a new stimulus configuration. We tested two groups: 21 schizophrenia patients and 24 healthy subjects. Thresholds were obtained using Bayesian staircases in a four-alternative forced-choice detection task where the target was a grating within a 3∘ Butterworth window that appeared in one of four possible positions at 5∘ eccentricity. We compared three conditions, (a) target with no-surround, (b) target embedded within a surrounding grating of 20∘ diameter and 25% contrast with same spatial frequency and orthogonal orientation, and (c) target embedded within a surrounding grating with parallel (same) orientation. Previous results with healthy populations have shown that contrast thresholds are lower for orthogonal and no-surround (NS) conditions than for parallel surround (PS). The log-ratios between parallel and NS thresholds are used as an index quantifying visual surround suppression. Patients performed poorly compared to controls in the NS and orthogonal-surround conditions. However, they performed as well as controls when the surround was parallel, resulting in significantly lower suppression indices in patients. To examine whether the difference in suppression was driven by the lower NS thresholds for controls, we examined a matched subgroup of controls and patients, selected to have similar thresholds in the NS condition. Patients performed significantly better in the PS condition than controls. This analysis therefore indicates that a PS raised contrast thresholds less in patients than in controls. Our results support the hypothesis that inhibitory connections in early visual cortex are impaired in schizophrenia patients.

Keywords: GABA; inhibitory connections; psychophysics; schizophrenia; visual surround suppression.


Figures

FIGURE 1
FIGURE 1
Example stimuli. Images (A–C) show examples of stimuli presented in the three experimental conditions: (A) No surround; (B) Orthogonal surround; and (C) Parallel surround. (D) Response screen with four circles signaling the possible positions where the target appeared.
FIGURE 2
FIGURE 2
Contrast detection thresholds as a function of the experimental condition. Bars represent the mean + SEM. Gray bars, data of patients; white bars, data of controls. p-values were obtained using the Smith-Welch-Satterthwaite test or unequal variance t-test when Bartlett’s test was significant and a t-test in other case (two-tailed, α = 0.05). Asterisks (*) correspond to significant differences between the means of the contrast detection thresholds.
FIGURE 3
FIGURE 3
Contrast detection thresholds as a function of age (years) for the three conditions (No-Surround, Orthogonal Surround, and Parallel Surround). Blue squares, contrast detection thresholds for patients; red circles, contrast detection thresholds for control group. The blue horizontal line represents the mean ± SEM for patients; the red horizontal line represents the mean ± SEM for the control group. p-values are the same as in Figure 2. Asterisks (*) correspond to significant differences between the means of the contrast detection thresholds.
FIGURE 4
FIGURE 4
Log ratios of contrast detection thresholds as a function of age (years). (A) panel shows the log ratios between the contrast detection threshold in the condition Parallel Surround and the condition No-Surround. (B) panel shows the log ratios between the contrast detection threshold in the condition Orthogonal Surround and the condition No-Surround. Blue squares, ratios for patients; red circles, ratios for control group. The blue horizontal line represents the mean ± SEM for patients; the red horizontal line represents the mean ± SEM for the control group. p-values were obtained using two-tailed t-test. Asterisks (*) correspond to significant differences between the means of the log ratios.
FIGURE 5
FIGURE 5
Contrast detection thresholds as a function of the experimental condition. For this analysis, we selected the controls in which contrast detection thresholds in the condition No-Surround were higher that the mean of the group for that condition, and the patients, in which contrast detection thresholds for No-Surround condition, were lower that the mean of the group. Bars represent the mean + SEM. Gray bars, data of patients; white bars, data of controls. p-values were obtained using two-tailed t-test (α = 0.05). Asterisks (*) correspond to significant differences between the means of the contrast detection thresholds. Note that in the condition Parallel Surround the patients have significant lower thresholds than controls.

References

    1. Anderson A. J. (2003). Utility of a dynamic termination criterion in the ZEST adaptive threshold method. Vision Res. 43 165–170 10.1016/S0042-6989(02)00396-6 - DOI - PubMed
    1. Andreasen N. C., Pressler M., Nopoulos P., Miller D., Ho B. C. (2010). Antipsychotic dose equivalents and dose-years: a standardized method for comparing exposure to different drugs. Biol. Psychiatry 67 255–262 10.1016/j.biopsych.2009.08.040 - DOI - PMC - PubMed
    1. Angelucci A., Bressloff P. (2006). Contribution of feedforward, lateral and feedback connections to the classical receptive field center and extraclassical receptive field surround of primate V1 neurons. Prog. Brain Res. 154 93–120 10.1016/S0079-6123(06)54005-1 - DOI - PubMed
    1. Angelucci A., Levitt J., Lund J. (2002). Anatomical origins of the classical receptive field and modulatory surround field of single neurons in macaque visual cortical area V1. Prog. Brain Res. 136 373–388 10.1016/S0079-6123(02)36031-X - DOI - PubMed
    1. APA. (1994). Diagnostic and Statistical Manual of Mental Disorders: DSM-IV 4th Edn. Washington, DC: American Psychiatric Association.

LinkOut - more resources