

Evolutionary history of a widespread tree species Acer mono in East Asia
- PMID: 25540694
- PMCID: PMC4267871
- DOI: 10.1002/ece3.1278
Evolutionary history of a widespread tree species Acer mono in East Asia
Abstract
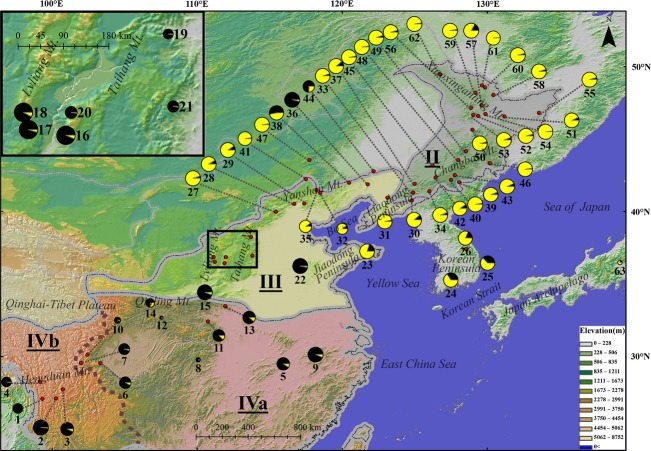
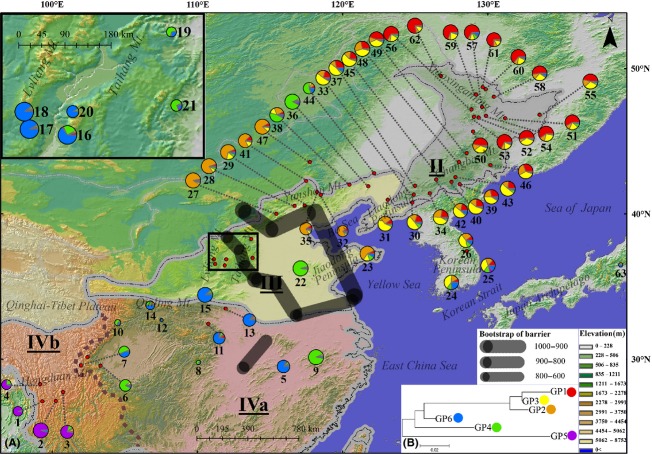
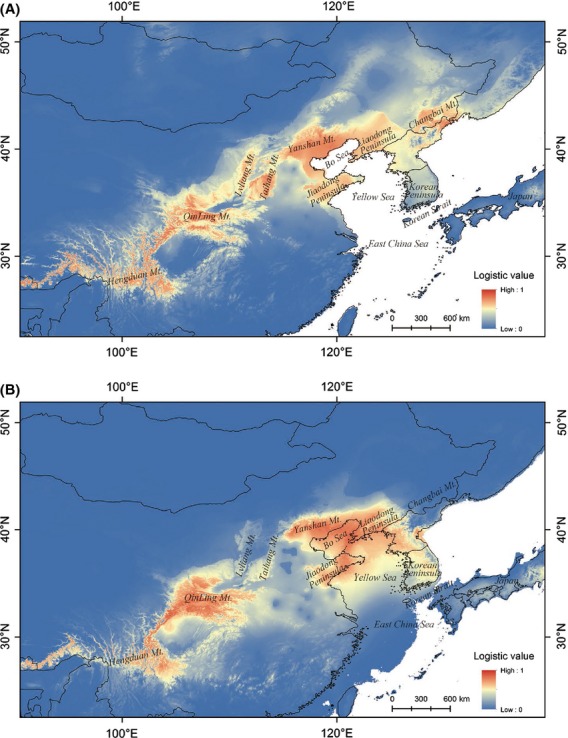
East Asia has the most diverse temperate flora in the world primarily due to the lack of Pleistocene glaciation and the geographic heterogeneity. Although increasing phylogeography studies in this region provided more proofs in this issue, discrepancies and uncertainty still exist, especially in northern temperate deciduous broad-leaved and coniferous mixed forest region (II). And a widespread plant species could reduce the complexity to infer the relationship between diversity and physiographical pattern. Hence, we studied the evolution history of a widespread temperate tree, Acer mono, populations in region II and the influence of physiographic patterns on intraspecific genetic diversity. Analyses of chloroplast sequences and nuclear microsatellites indicated high levels of genetic diversity. The diversity distribution was spatially heterogeneous and a latitudinal cline existed in both markers. The spatial distribution pattern between genetic diversity within A. mono and the diversity at species level was generally consistent. Western subtropical evergreen broad-leaved forest subregion (IVb) had a unique ancient chloroplast clade (CP3) and a nuclear gene pool (GP5) with dominance indicating the critical role of this area in species diversification. Genetic data and ecological niche model results both suggested that populations in region II disappeared during the last glacial maximum (LGM) and recovered from south of Changbai Mt. and the Korean Peninsula. Two distribution centers were likely during the LGM, one in the north edge of warm temperate deciduous broad-leaved forest region (III) and another in the south edge of region III. This was reflected by the genetic pattern with two spatially independent genetic groups. This study highlights the key role of region III in sustaining genetic diversity in the northern range and connecting diversity between southern and northern range. We elucidated the diversity relationship between vegetation regions which could facilitate the understanding of biodiversity origin and maintenance in East Asia.
Keywords: Acer mono; community assemblage; phylogeography; temperate mixed forests.
Figures
Similar articles
-
Multiple glacial refugia for cool-temperate deciduous trees in northern East Asia: the Mongolian oak as a case study.Mol Ecol. 2015 Nov;24(22):5676-91. doi: 10.1111/mec.13408. Epub 2015 Oct 30. Mol Ecol. 2015. PMID: 26439083
-
Molecular phylogeography and ecological niche modelling of a widespread herbaceous climber, Tetrastigma hemsleyanum (Vitaceae): insights into Plio-Pleistocene range dynamics of evergreen forest in subtropical China.New Phytol. 2015 Apr;206(2):852-67. doi: 10.1111/nph.13261. Epub 2015 Jan 15. New Phytol. 2015. PMID: 25639152
-
A strong 'filter' effect of the East China Sea land bridge for East Asia's temperate plant species: inferences from molecular phylogeography and ecological niche modelling of Platycrater arguta (Hydrangeaceae).BMC Evol Biol. 2014 Mar 4;14(1):41. doi: 10.1186/1471-2148-14-41. BMC Evol Biol. 2014. PMID: 24593236 Free PMC article.
-
Plant molecular phylogeography in China and adjacent regions: Tracing the genetic imprints of Quaternary climate and environmental change in the world's most diverse temperate flora.Mol Phylogenet Evol. 2011 Apr;59(1):225-44. doi: 10.1016/j.ympev.2011.01.012. Epub 2011 Feb 1. Mol Phylogenet Evol. 2011. PMID: 21292014 Review.
-
The Origin of Evergreen Broad-Leaved Forests in East Asia from the Evidence of Floristic Elements.Plants (Basel). 2024 Apr 16;13(8):1106. doi: 10.3390/plants13081106. Plants (Basel). 2024. PMID: 38674515 Free PMC article. Review.
Cited by
-
Recent Fragmentation May Not Alter Genetic Patterns in Endangered Long-Lived Species: Evidence From Taxus cuspidata.Front Plant Sci. 2018 Oct 31;9:1571. doi: 10.3389/fpls.2018.01571. eCollection 2018. Front Plant Sci. 2018. PMID: 30429863 Free PMC article.
-
A Genomewide Scan for Genetic Structure and Demographic History of Two Closely Related Species, Rhododendron dauricum and R. mucronulatum (Rhododendron, Ericaceae).Front Plant Sci. 2020 Jul 17;11:1093. doi: 10.3389/fpls.2020.01093. eCollection 2020. Front Plant Sci. 2020. PMID: 32765570 Free PMC article.
-
The Application and Limitation of Universal Chloroplast Markers in Discriminating East Asian Evergreen Oaks.Front Plant Sci. 2018 May 8;9:569. doi: 10.3389/fpls.2018.00569. eCollection 2018. Front Plant Sci. 2018. PMID: 29868047 Free PMC article.
-
Evolutionary history of endangered and relict tree species Dipteronia sinensis in response to geological and climatic events in the Qinling Mountains and adjacent areas.Ecol Evol. 2020 Nov 11;10(24):14052-14066. doi: 10.1002/ece3.6996. eCollection 2020 Dec. Ecol Evol. 2020. PMID: 33391701 Free PMC article.
-
Genetic structure and trait variation within a maple hybrid zone underscore North China as an overlooked diversity hotspot.Sci Rep. 2022 Aug 17;12(1):13949. doi: 10.1038/s41598-022-17538-9. Sci Rep. 2022. PMID: 35977961 Free PMC article.
References
-
- Aizawa M, Kim Z. Yoshimaru H. Phylogeography of the Korean pine (Pinus koraiensis) in northeast Asia: inferences from organelle gene sequences. J. Plant. Res. 2012;125:713–723. - PubMed
-
- Bai W-N, Liao W-J. Zhang D-Y. Nuclear and chloroplast DNA phylogeography reveal two refuge areas with asymmetrical gene flow in a temperate walnut tree from East Asia. New Phytol. 2010;188:892–901. - PubMed
-
- Bandelt H-J, Forster P. Röhl A. Median-joining networks for inferring intraspecific phylogenies. Mol. Biol. Evol. 1999;16:37–48. - PubMed
-
- Dieringer D. Schlötterer C. Microsatellite analyser (MSA): a platform independent analysis tool for large microsatellite data sets. Mol. Ecol. Notes. 2003;3:167–169.
LinkOut - more resources
Full Text Sources
Other Literature Sources
Miscellaneous
