

Network meta-analysis using R: a review of currently available automated packages
- PMID: 25541687
- PMCID: PMC4277278
- DOI: 10.1371/journal.pone.0115065
Network meta-analysis using R: a review of currently available automated packages
Erratum in
-
Correction: Network meta-analysis using R: a review of currently available automated packages.PLoS One. 2015 Apr 2;10(4):e0123364. doi: 10.1371/journal.pone.0123364. eCollection 2015. PLoS One. 2015. PMID: 25836669 Free PMC article. No abstract available.
Abstract
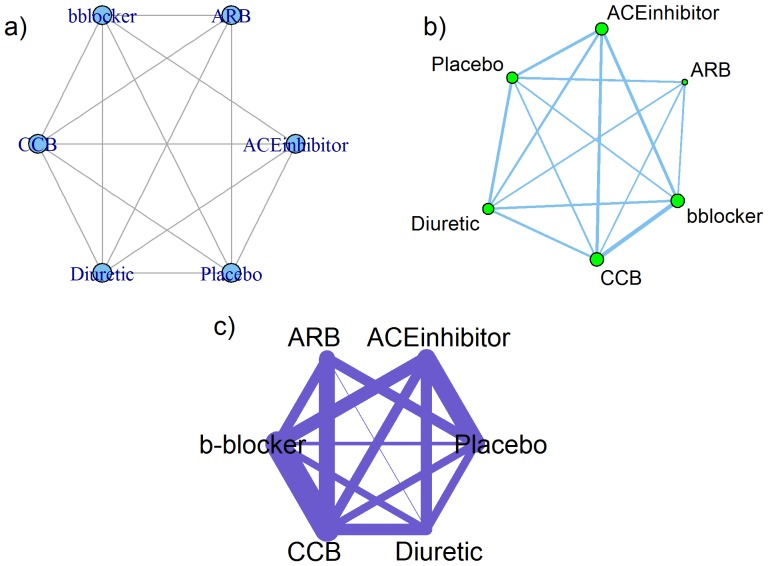
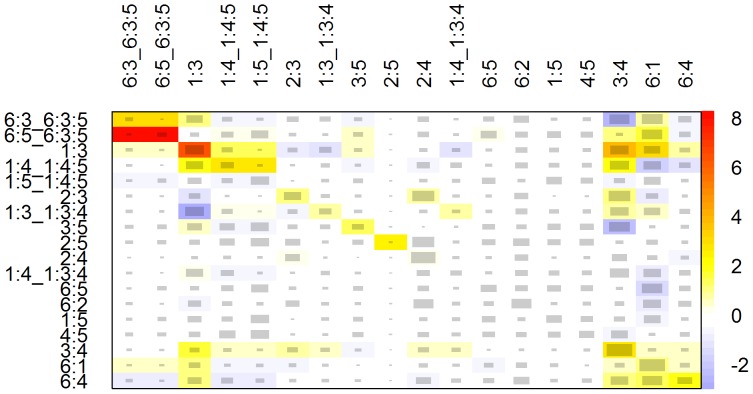
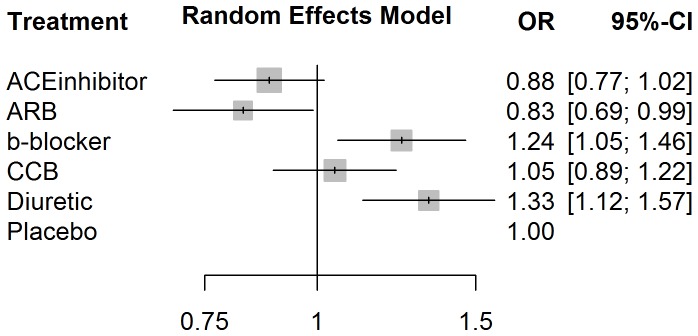
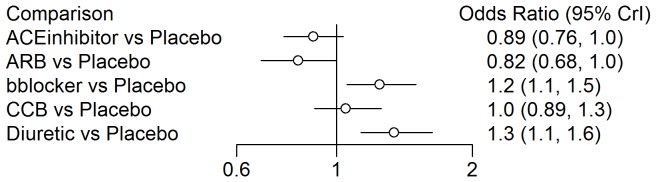
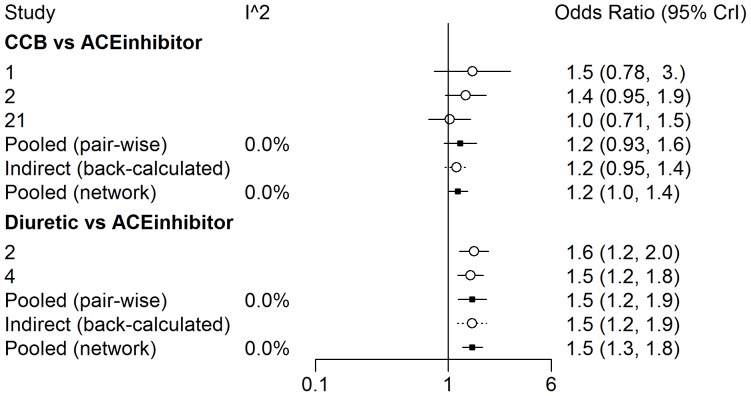
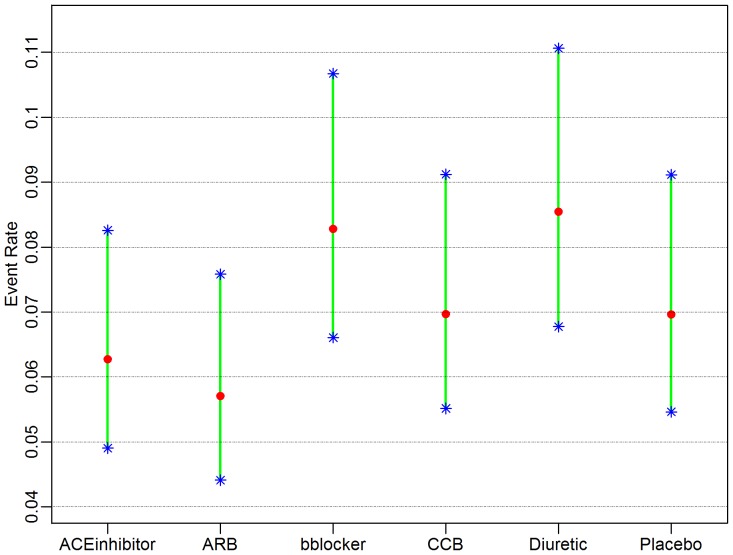
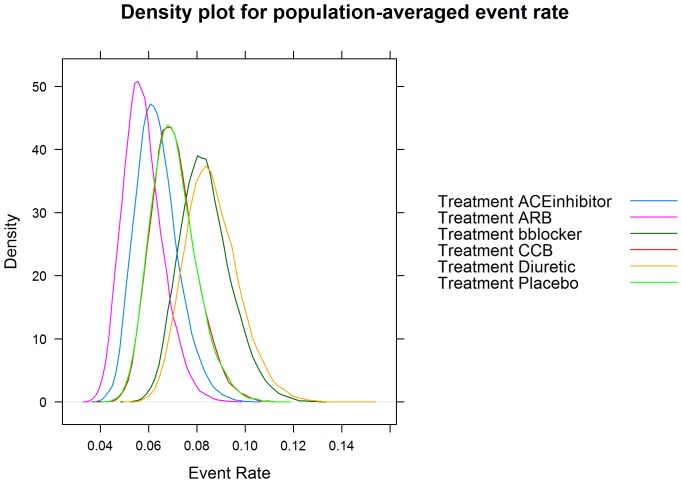
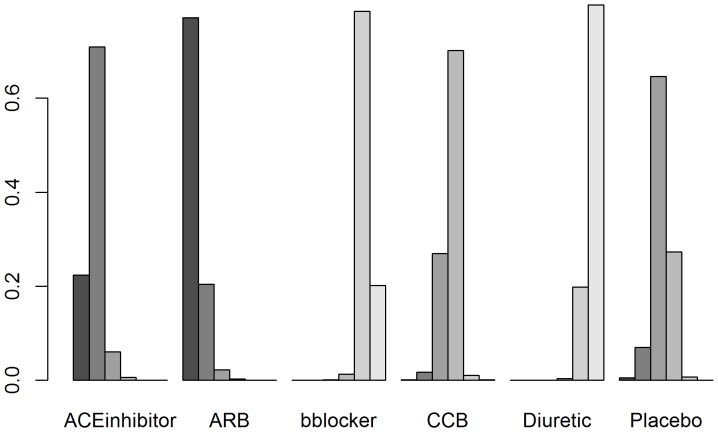
Network meta-analysis (NMA)--a statistical technique that allows comparison of multiple treatments in the same meta-analysis simultaneously--has become increasingly popular in the medical literature in recent years. The statistical methodology underpinning this technique and software tools for implementing the methods are evolving. Both commercial and freely available statistical software packages have been developed to facilitate the statistical computations using NMA with varying degrees of functionality and ease of use. This paper aims to introduce the reader to three R packages, namely, gemtc, pcnetmeta, and netmeta, which are freely available software tools implemented in R. Each automates the process of performing NMA so that users can perform the analysis with minimal computational effort. We present, compare and contrast the availability and functionality of different important features of NMA in these three packages so that clinical investigators and researchers can determine which R packages to implement depending on their analysis needs. Four summary tables detailing (i) data input and network plotting, (ii) modeling options, (iii) assumption checking and diagnostic testing, and (iv) inference and reporting tools, are provided, along with an analysis of a previously published dataset to illustrate the outputs available from each package. We demonstrate that each of the three packages provides a useful set of tools, and combined provide users with nearly all functionality that might be desired when conducting a NMA.
Conflict of interest statement
Figures
References
-
- Hoaglin DC, Hawkins N, Jansen JP, Scott DA, Itzler R, et al. (2011) Conducting indirect-treatment-comparison and network-meta-analysis studies: report of the ISPOR Task Force on Indirect Treatment Comparisons Good Research Practices: part 2. Value Health 14:429–437. - PubMed
-
- Lee AW (2014) Review of mixed treatment comparisons in published systematic reviews shows marked increase since 2009. J Clin Epidemiol 67:138–143. - PubMed
-
- Bucher HC, Guyatt GH, Griffith LE, Walter SD (1997) The results of direct and indirect treatment comparisons in meta-analysis of randomized controlled trials. J Clin Epidemiol 50:683–691. - PubMed
Publication types
MeSH terms
Grants and funding
LinkOut - more resources
Full Text Sources
Other Literature Sources
