The transcriptomic and proteomic landscapes of bone marrow and secondary lymphoid tissues
- PMID: 25541736
- PMCID: PMC4277406
- DOI: 10.1371/journal.pone.0115911
The transcriptomic and proteomic landscapes of bone marrow and secondary lymphoid tissues
Abstract
Background: The sequencing of the human genome has opened doors for global gene expression profiling, and the immense amount of data will lay an important ground for future studies of normal and diseased tissues. The Human Protein Atlas project aims to systematically map the human gene and protein expression landscape in a multitude of normal healthy tissues as well as cancers, enabling the characterization of both housekeeping genes and genes that display a tissue-specific expression pattern. This article focuses on identifying and describing genes with an elevated expression in four lymphohematopoietic tissue types (bone marrow, lymph node, spleen and appendix), based on the Human Protein Atlas-strategy that combines high throughput transcriptomics with affinity-based proteomics.
Results: An enriched or enhanced expression in one or more of the lymphohematopoietic tissues, compared to other tissue-types, was seen for 693 out of 20,050 genes, and the highest levels of expression were found in bone marrow for neutrophilic and erythrocytic genes. A majority of these genes were found to constitute well-characterized genes with known functions in lymphatic or hematopoietic cells, while others are not previously studied, as exemplified by C19ORF59.
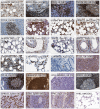
Conclusions: In this paper we present a strategy of combining next generation RNA-sequencing with in situ affinity-based proteomics in order to identify and describe new gene targets for further research on lymphatic or hematopoietic cells and tissues. The results constitute lists of genes with enriched or enhanced expression in the four lymphohematopoietic tissues, exemplified also on protein level with immunohistochemical images.
Conflict of interest statement
Figures


Similar articles
-
Defining the human gallbladder proteome by transcriptomics and affinity proteomics.Proteomics. 2014 Nov;14(21-22):2498-507. doi: 10.1002/pmic.201400201. Epub 2014 Oct 9. Proteomics. 2014. PMID: 25175928
-
RNA- and antibody-based profiling of the human proteome with focus on chromosome 19.J Proteome Res. 2014 Apr 4;13(4):2019-27. doi: 10.1021/pr401156g. Epub 2014 Mar 12. J Proteome Res. 2014. PMID: 24579871
-
Defining the Human Brain Proteome Using Transcriptomics and Antibody-Based Profiling with a Focus on the Cerebral Cortex.PLoS One. 2015 Jun 15;10(6):e0130028. doi: 10.1371/journal.pone.0130028. eCollection 2015. PLoS One. 2015. PMID: 26076492 Free PMC article.
-
Linking transcriptomics and proteomics in spermatogenesis.Reproduction. 2015 Nov;150(5):R149-57. doi: 10.1530/REP-15-0073. Reproduction. 2015. PMID: 26416010 Review.
-
High-throughput gene and protein expression analysis in pulp biologic research: review.J Endod. 2010 Feb;36(2):179-89. doi: 10.1016/j.joen.2009.10.016. Epub 2009 Dec 4. J Endod. 2010. PMID: 20113773 Review.
Cited by
-
Dynamic Intracellular Metabolic Cell Signaling Profiles During Ag-Dependent B-Cell Differentiation.Front Immunol. 2021 Mar 30;12:637832. doi: 10.3389/fimmu.2021.637832. eCollection 2021. Front Immunol. 2021. PMID: 33859640 Free PMC article.
-
Multi-omics analyses reveal aberrant differentiation trajectory with WNT1 loss-of-function in type XV osteogenesis imperfecta.J Bone Miner Res. 2024 Sep 2;39(9):1253-1267. doi: 10.1093/jbmr/zjae123. J Bone Miner Res. 2024. PMID: 39126373 Free PMC article.
-
Distinct molecular profiles of skull bone marrow in health and neurological disorders.Cell. 2023 Aug 17;186(17):3706-3725.e29. doi: 10.1016/j.cell.2023.07.009. Epub 2023 Aug 9. Cell. 2023. PMID: 37562402 Free PMC article.
-
Duplex sequencing identifies genomic features that determine susceptibility to benzo(a)pyrene-induced in vivo mutations.BMC Genomics. 2022 Jul 28;23(1):542. doi: 10.1186/s12864-022-08752-w. BMC Genomics. 2022. PMID: 35902794 Free PMC article.
-
The Human Protein Atlas-Spatial localization of the human proteome in health and disease.Protein Sci. 2021 Jan;30(1):218-233. doi: 10.1002/pro.3987. Epub 2020 Nov 13. Protein Sci. 2021. PMID: 33146890 Free PMC article.
References
-
- Ponten F, Jirstrom K, Uhlen M (2008) The Human Protein Atlas–a tool for pathology. J Pathol 216:387–393. - PubMed
-
- Uhlen M, Bjorling E, Agaton C, Szigyarto CA, Amini B, et al. (2005) A human protein atlas for normal and cancer tissues based on antibody proteomics. Mol Cell Proteomics 4:1920–1932. - PubMed
-
- Bain BJ, Clark DM, Lampert IA (1996) Bone marrow pathology. Oxford; Cambridge, Mass., USA: Blackwell Science. viii, 328 p. p.
-
- (2014) The Human Protein Atlas.
Publication types
MeSH terms
Substances
LinkOut - more resources
Full Text Sources
Other Literature Sources

