

Impact of groundwater table and plateau zokors (Myospalax baileyi) on ecosystem respiration in the Zoige Peatlands of China
- PMID: 25542023
- PMCID: PMC4277300
- DOI: 10.1371/journal.pone.0115542
Impact of groundwater table and plateau zokors (Myospalax baileyi) on ecosystem respiration in the Zoige Peatlands of China
Abstract
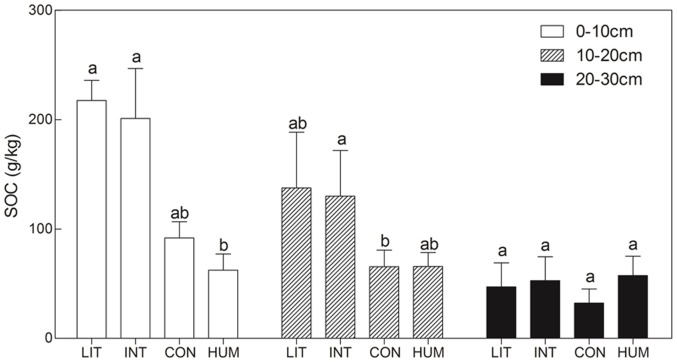
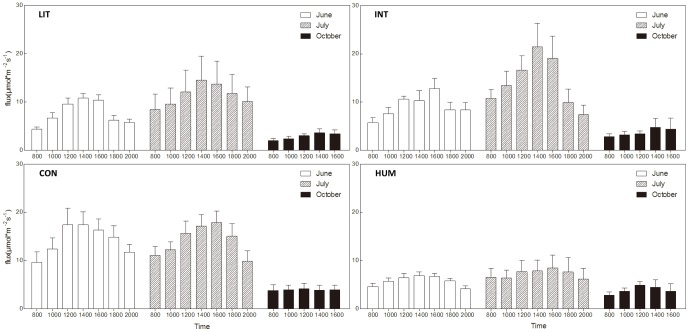
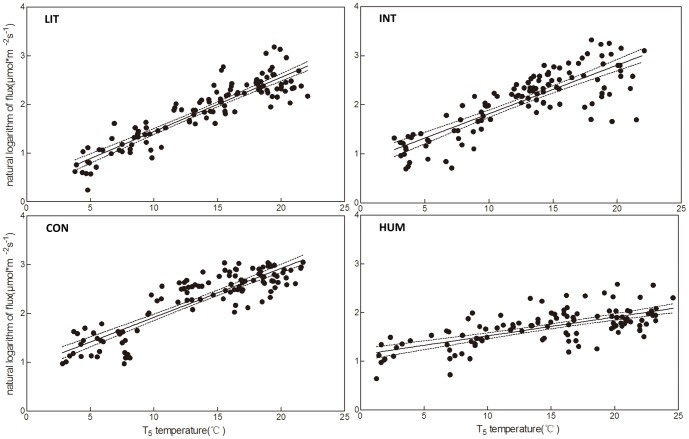
Peatlands contain large amount of carbon stock that is vulnerable to release into the atmosphere. Mostly because of human impact, the peatlands at Zoige Wetlands face severe degradation, and the groundwater table is now lower than before, which has increased the population of the plateau zokor, a burrowing rodent. However, the impact of these changes on ecosystem carbon flows has not been studied. To investigate how the plateau zokor and the groundwater level alter the ecosystem respiration of the Zoige peatlands, we sampled the CO2 flux of hummocks shaped by the zokors and compared it with the CO2 flux of undisturbed sites with different groundwater table levels. The soil organic carbon (SOC), soil water content (SWC) and soil temperature at 5 cm (T5) were measured. SOC showed no significant difference among the four sampling sites and did not correlate with the CO2 flux, while SWC was found to partly determine the CO2 flux. A linear equation could adequately describe the relationship between the natural logarithm of the ecosystem respiration and the soil temperature. It is demonstrated that descending groundwater table might accelerate ecosystem respiration and the CO2 flux from hummocks was higher than the CO2 flux from the control site in the non-growing season. With rising temperature, the CO2 flux from the control site accelerated faster than that from the hummocks. Our results show that ecosystem respiration was significantly lower from hummocks than at the control site in the growing season. The results on the impact of zokors on greenhouse gas emissions presented in this paper provide a useful reference to help properly manage not only this, but other litter-burrowing mammals at peatland sites.
Conflict of interest statement
Figures
Similar articles
-
Dynamics of greenhouse gas emission induced by different burrowing activities of fossorial vertebrates in the Qinghai-Tibetan Plateau alpine meadow ecosystem.Int J Biometeorol. 2020 Jan;64(1):115-122. doi: 10.1007/s00484-019-01802-1. Epub 2019 Oct 25. Int J Biometeorol. 2020. PMID: 31654197
-
Impact of fertiliser, water table, and warming on celery yield and CO2 and CH4 emissions from fenland agricultural peat.Sci Total Environ. 2019 Jun 1;667:179-190. doi: 10.1016/j.scitotenv.2019.02.360. Epub 2019 Feb 26. Sci Total Environ. 2019. PMID: 30826678
-
CO2 emissions from an undrained tropical peatland: Interacting influences of temperature, shading and water table depth.Glob Chang Biol. 2019 Sep;25(9):2885-2899. doi: 10.1111/gcb.14702. Epub 2019 Jul 5. Glob Chang Biol. 2019. PMID: 31100190
-
Rising sea level, temperature, and precipitation impact plant and ecosystem responses to elevated CO2 on a Chesapeake Bay wetland: review of a 28-year study.Glob Chang Biol. 2014 Nov;20(11):3329-43. doi: 10.1111/gcb.12631. Epub 2014 Jun 11. Glob Chang Biol. 2014. PMID: 24820033 Review.
-
Measurement of CO2 exchange between Boreal forest and the atmosphere.SEB Exp Biol Ser. 2005:151-85. SEB Exp Biol Ser. 2005. PMID: 17633035 Review.
Cited by
-
Dynamics of Soil Respiration in Alpine Wetland Meadows Exposed to Different Levels of Degradation in the Qinghai-Tibet Plateau, China.Sci Rep. 2019 May 16;9(1):7469. doi: 10.1038/s41598-019-43904-1. Sci Rep. 2019. PMID: 31097739 Free PMC article.
-
Dynamics of greenhouse gas emission induced by different burrowing activities of fossorial vertebrates in the Qinghai-Tibetan Plateau alpine meadow ecosystem.Int J Biometeorol. 2020 Jan;64(1):115-122. doi: 10.1007/s00484-019-01802-1. Epub 2019 Oct 25. Int J Biometeorol. 2020. PMID: 31654197
-
Impact of plateau pikas (Ochotona curzoniae) on soil properties and nitrous oxide fluxes on the Qinghai-Tibetan Plateau.PLoS One. 2018 Sep 27;13(9):e0203691. doi: 10.1371/journal.pone.0203691. eCollection 2018. PLoS One. 2018. PMID: 30260971 Free PMC article.
References
-
- Gorham E (1991) Northern peatlands - role in the carbon-cycle and probable responses to climatic warming. Ecol Appl 1:182–195. - PubMed
-
- Turunen J, Tomppo E, Tolonen K, Reinikainen A (2002) Estimating carbon accumulation rates of undrained mires in Finland-Application to boreal and subarctic regions. Holocene 12:69–80.
-
- Yu ZC, Loisel J, Brosseau DP, Beilman DW, Hunt SJ (2010) Global peatland dynamics since the Last Glacial Maximum. Geophys Res Lett 37.
-
- IPCC (2007) Climate Change 2007: the Physical Science Basis.
-
- Raich JW, Schlesinger WH (1992) The global carbon-dioxide flux in soil respiration and its relationship to vegetation and climate. Tellus Ser B-Chem Phys Meteorol 44:81–99.
Publication types
MeSH terms
Substances
LinkOut - more resources
Full Text Sources
Other Literature Sources
