. 2015 Jan;16 Suppl 10(Suppl 10):x1-x36.
doi: 10.1093/neuonc/nou327.

Alex's Lemonade Stand Foundation Infant and Childhood Primary Brain and Central Nervous System Tumors Diagnosed in the United States in 2007-2011

Affiliations

Alex's Lemonade Stand Foundation Infant and Childhood Primary Brain and Central Nervous System Tumors Diagnosed in the United States in 2007-2011

Quinn T Ostrom et al. Neuro Oncol. 2015 Jan.

Abstract

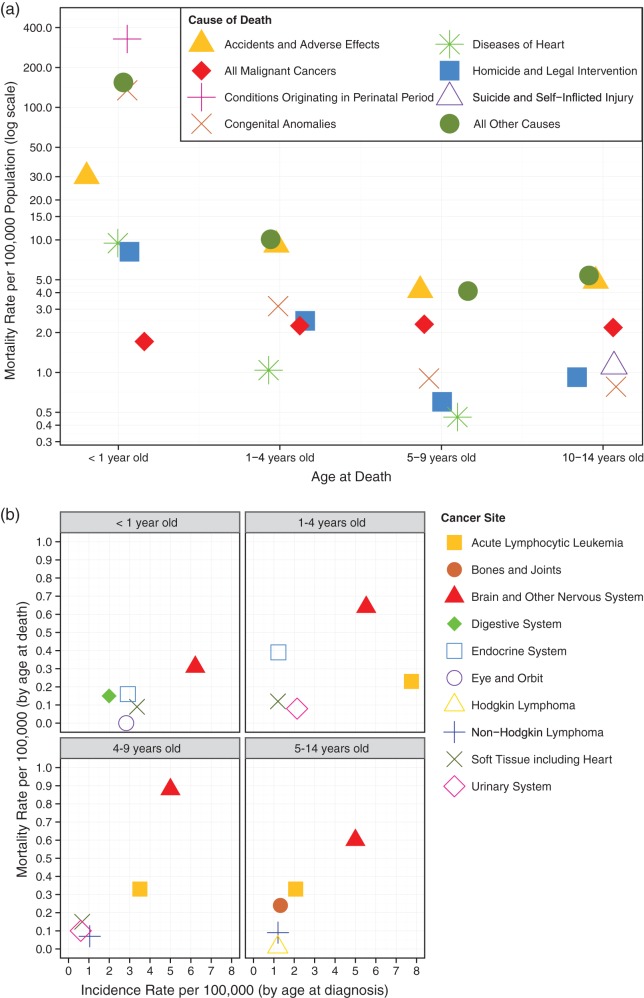
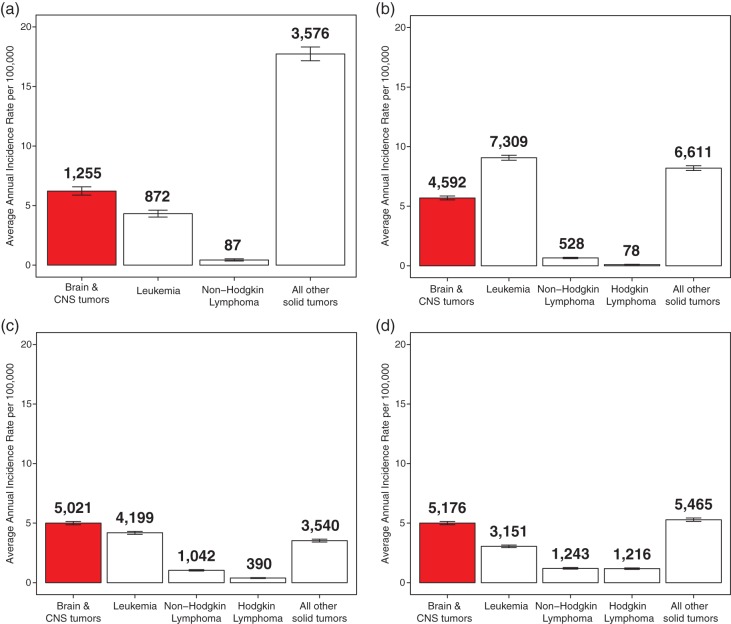
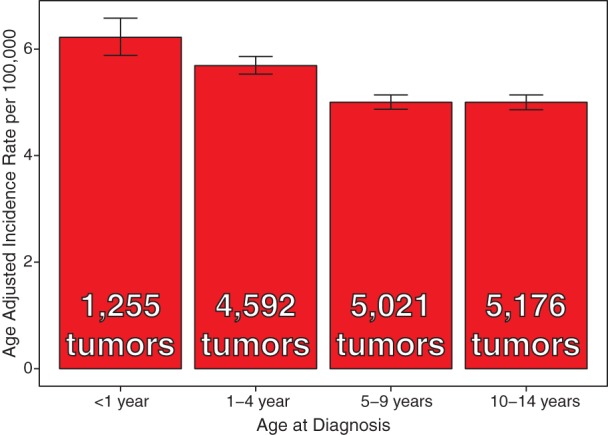
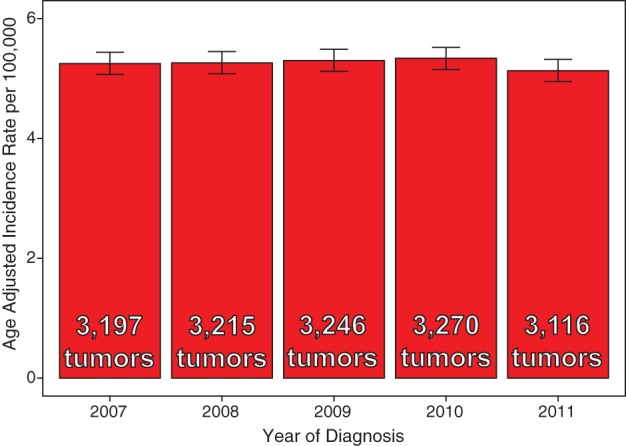
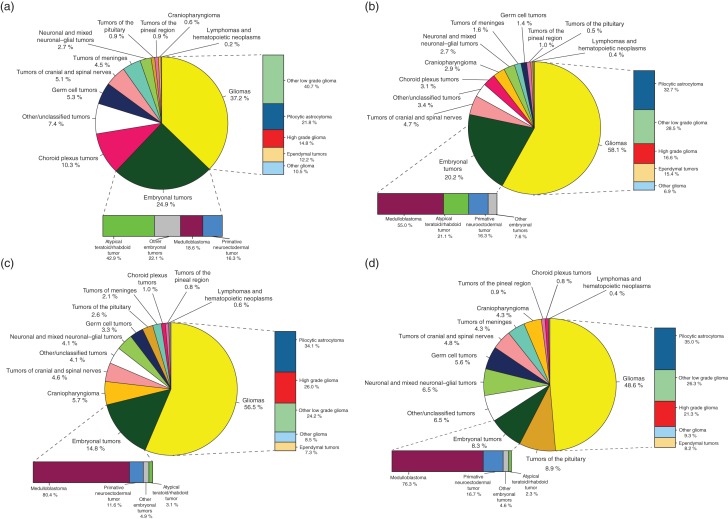
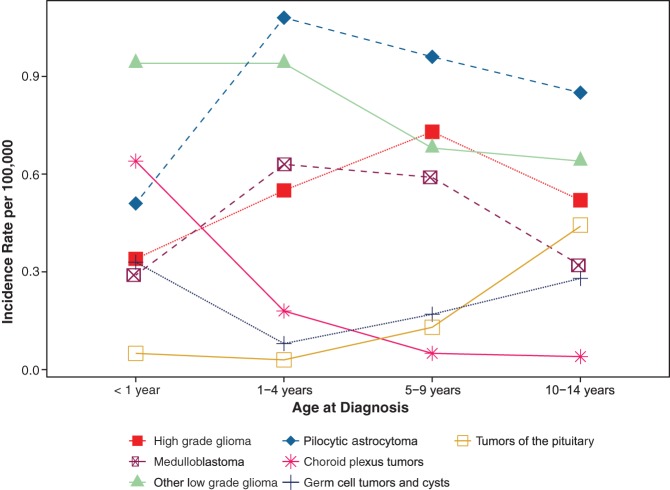
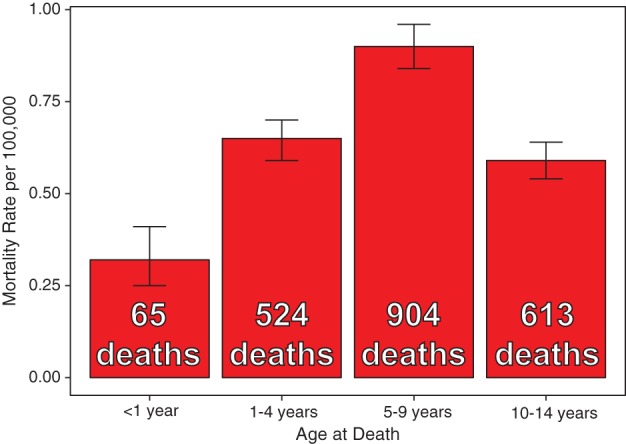
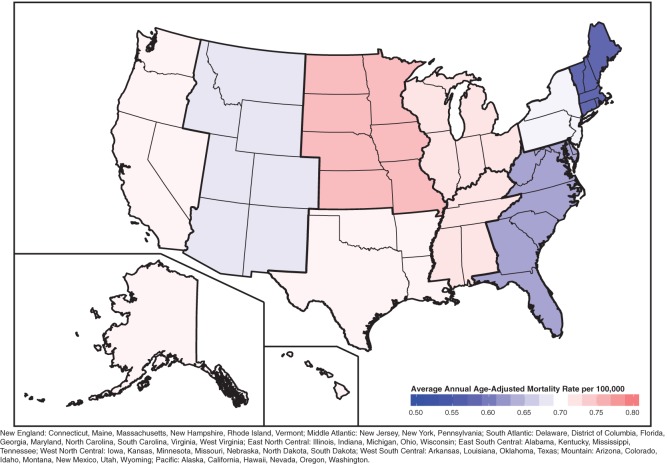
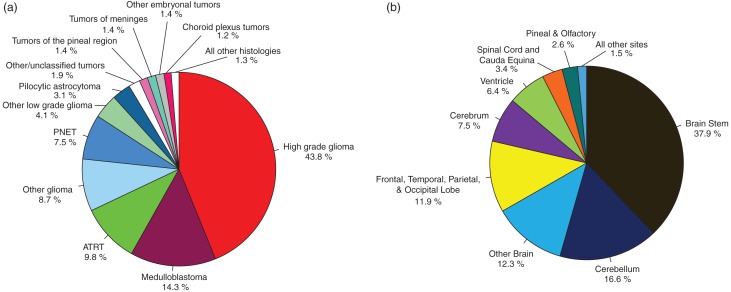
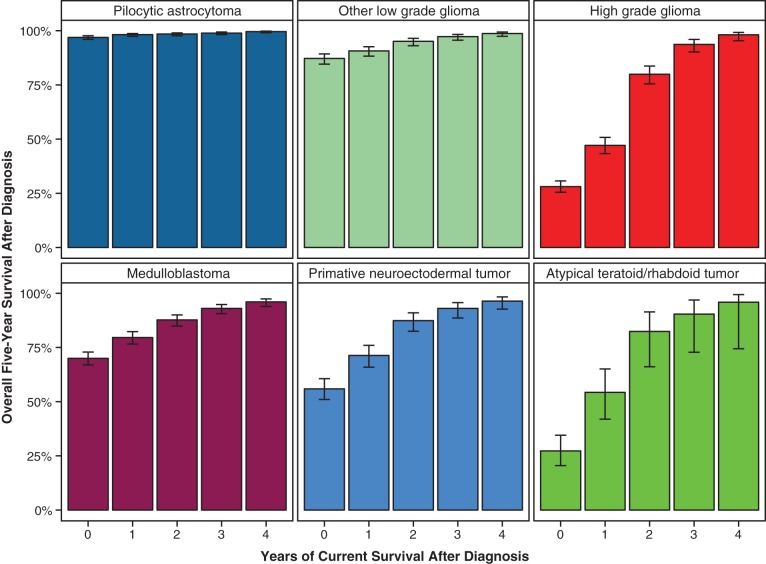
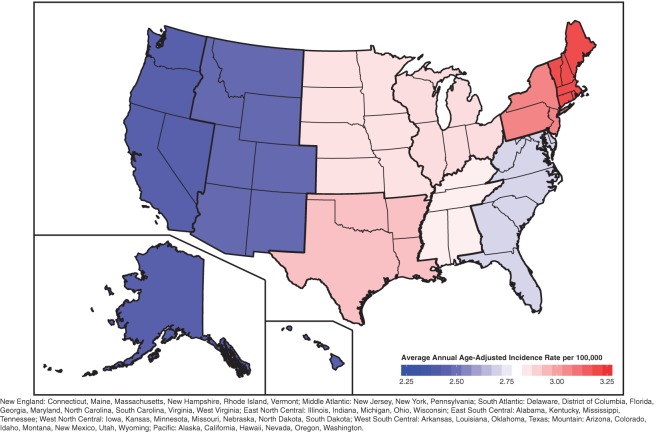
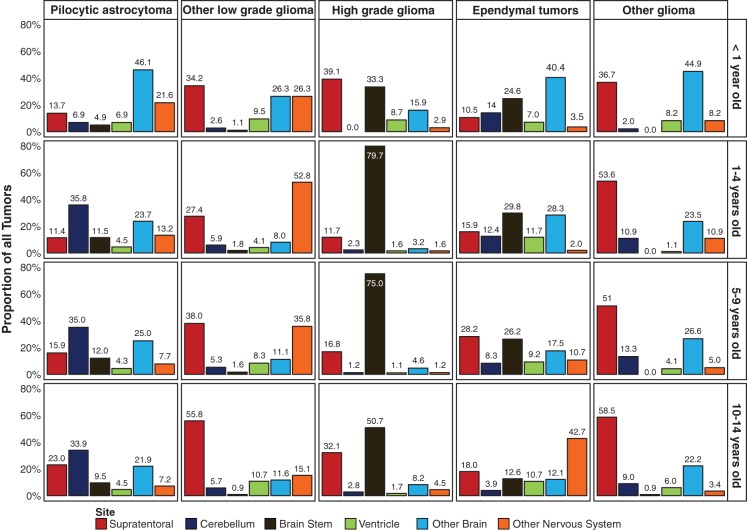
The CBTRUS Statistical Report: Alex's Lemonade Stand Foundation Infant and Childhood Primary Brain and Central Nervous System Tumors Diagnosed in the United States in 2007–2011 comprehensively describes the current population-based incidence of primary malignant and non-malignant brain and CNS tumors in children ages 0–14 years, collected and reported by central cancer registries covering approximately 99.8% of the United States population (for 2011 only, data were available for 50 out of 51 registries). Overall, brain and CNS tumors are the most common solid tumor, the most common cancer, and the most common cause of cancer death in infants and children 0–14 years. This report aims to serve as a useful resource for researchers, clinicians, patients, and families.


Figures

Fig. 1.
Fig. 1.
(a) Average Annual Mortality Rates and Total Deaths for Top 5 Causes of Death and Death Due To Malignant Neoplasms for Children 0–14 by Age Groups (NVSS 2007–2011), (b) Average Annual Mortality Rates and Total Deaths for Top 5 Causes of Death Due to Cancer for Children 0–14 by Age Groups, 2007–2011 (NVSS 2007–2011, CBTRUS 2007–2011, USCS 2007–2011)
Fig. 2.
Fig. 2.
Average Annual Age-Adjusted Incidence Rates of All Primary Brain And CNS Tumors in Comparison to Leukemias And Lymphomas in (a) Infants (<1 Year Old), (b) Children 1–4 Years, (c) Children 5–9 Years, and (d) Children 10–14 Years (CBTRUS 2007–2011, USCS 2007–2011)
Fig. 3.
Fig. 3.
Average Annual Age-Adjusted Incidence Rates of Primary Brain and CNS Tumors by Age Group (N = 16,044) (CBTRUS 2007–2011)
Fig. 4.
Fig. 4.
Annual Age-Adjusted Incidence Rates of Primary Brain and CNS Tumors by Year of Diagnosis (N = 16,044) (CBTRUS 2007–2011)
Fig. 5.
Fig. 5.
Average Annual Age-Adjusted Incidence Rates of All Primary Brain and CNS Tumors by Region of the United States (0–14 Years) (N = 16,044) (CBTRUS 2007–2011)
Fig. 6.
Fig. 6.
Distribution of All Primary Brain and CNS Tumors by Site (0–14 Years) (N = 16,044) (CBTRUS 2007–2011)
Fig. 7.
Fig. 7.
Distribution of all Primary Brain and CNS Tumors by Site for (a) Infants <1 Year Old (N = 1,255), (b) Children 1–4 Years (N = 4,592), (c) Children 5–9 Years (N = 5,021), and (d) Children 10–14 Years (N = 5,176) (CBTRUS 2007–2011)
Fig. 8.
Fig. 8.
Distribution of All Primary Brain and CNS Tumors by Histology Groupings (0–14 Years) (N = 16,044) (CBTRUS 2007–2011)
Fig. 9.
Fig. 9.
Distribution of All Primary Brain and CNS Tumors by Histology Groupings for (a) Infants <1 Year Old (N = 1,255), (b) Children 1–4 Years (N = 4,592), (c) Children 5–9 Years (N = 5,021), and (d) Children 10–14 Years (N = 5,176) (CBTRUS 2007–2011)
Fig. 10.
Fig. 10.
Age-Adjusted Incidence Rates of Brain and CNS Tumors by Selected Histologies and Age Groups (CBTRUS 2007–2011)
Fig. 11.
Fig. 11.
Average Annual Age-Adjusted Mortality Rates for Malignant Primary Brain and CNS Tumors by Age Groups (N = 2,106) (NVSS 2007–2011)
Fig. 12.
Fig. 12.
Average Annual Age-adjusted Mortality Rates for Malignant Primary Brain and CNS Tumors by Region of the United States (N = 2,106) (NVSS 2007–2011)
Fig. 13.
Fig. 13.
Distribution of Total Deaths Due to Primary Malignant Brain and CNS Tumor in Children 0–14 at Time of Death from 2007–2011 by (a) Histology Groupings (N = 734), and (b) Site (N = 734) (SEER 1995–2011)
Fig. 14.
Fig. 14.
Five-Year Conditional Survival by Age Groups and Selected Glioma and Embryonal Histology Groupings (SEER 1995–2011)
Fig. 15.
Fig. 15.
Average Annual Age-Adjusted Incidence Rates of All Gliomas by Region of the United States (0–14 Years) (N = 8,487) (CBTRUS 2007–2011)
Fig. 16.
Fig. 16.
Number and Distribution of Sites by Specific Glioma Histology Groupings and Age Groups (N = 8,487) (CBTRUS 2007–2011)
Fig. 17.
Fig. 17.
Average Annual Age-Adjusted Incidence Rates of All Embryonal Tumors by Region of the United States (0–14 Years) (N = 2,413) (CBTRUS 2007–2011)

References

    1. National Cancer Institute. Overview of the SEER Program. http://seer.cancer.gov/about/overview.html.
    1. Ostrom QT, Gittleman H, Liao P, et al. CBTRUS Statistical Report: Primary Brain and Central Nervous System Tumors Diagnosed in the United States in 2007–2011. Neuro Oncol. 2014;16(s4):iv1 – iv63. - PMC - PubMed
    1. Centers for Disease Control and Prevention and National Cancer Institute. United States Cancer Statistics: 1999–2010 Incidence, WONDER Online Database. 2013; Unite http://wonder.cdc.gov/cancer-v2010.html.
    1. Surveillance Research Program - National Cancer Institute. SEER … as a Research Resource. 2010; http://seer.cancer.gov/about/factsheets/SEER_Research_Brochure.pdf.
    1. Surveillance Epidemiology and End Results (SEER) Program. SEER*Stat Database: Populations - Total U.S. (1990–2012) - Linked To County Attributes - Total U.S., 1969–2012 Counties, National Cancer Institute, DCCPS, Surveillance Research Program, Surveillance Systems Branch, released December 2013. http://seer.cancer.gov/popdata/.

Publication types

MeSH terms