. 2015 Mar:265:69-83.
doi: 10.1016/j.expneurol.2014.12.012. Epub 2014 Dec 24.

Voltage-gated Ca2+ entry promotes oligodendrocyte progenitor cell maturation and myelination in vitro

Affiliations

Voltage-gated Ca2+ entry promotes oligodendrocyte progenitor cell maturation and myelination in vitro

V T Cheli et al. Exp Neurol. 2015 Mar.

Abstract

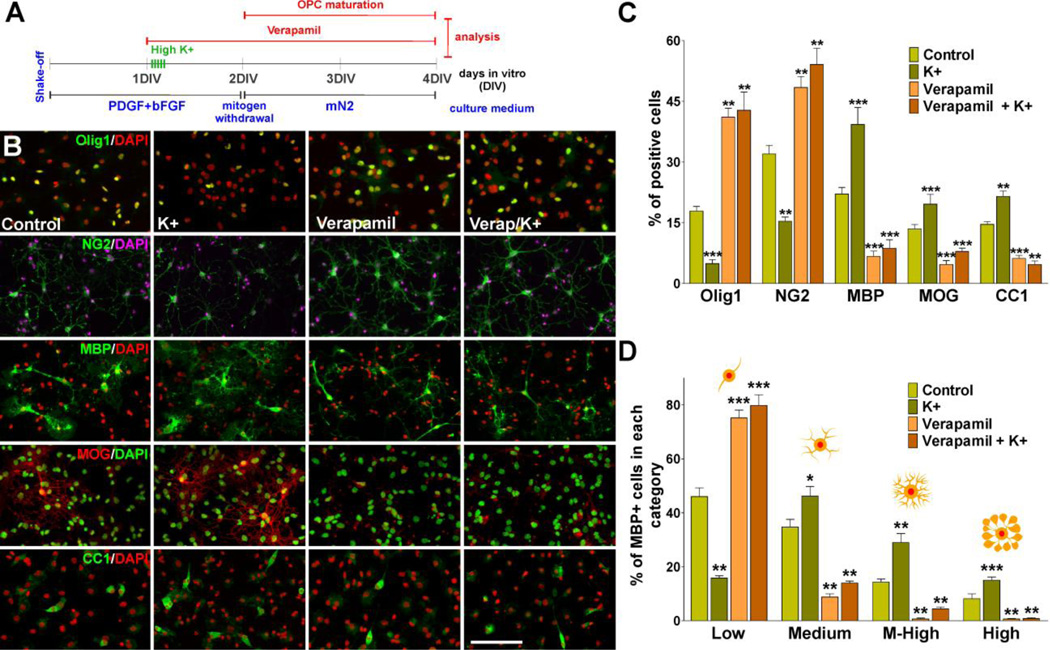
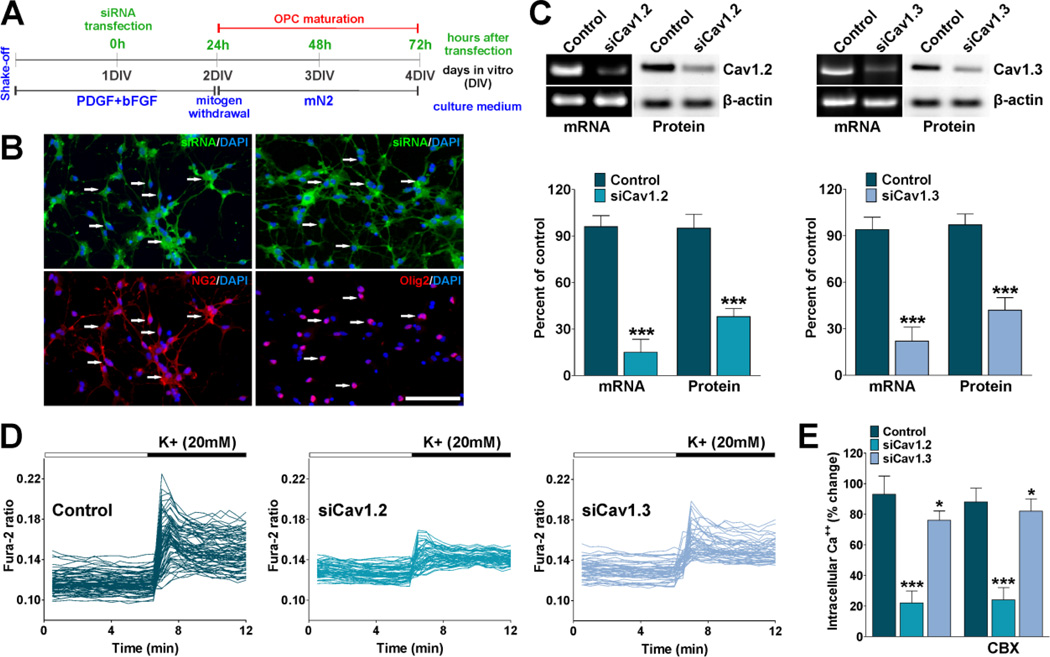
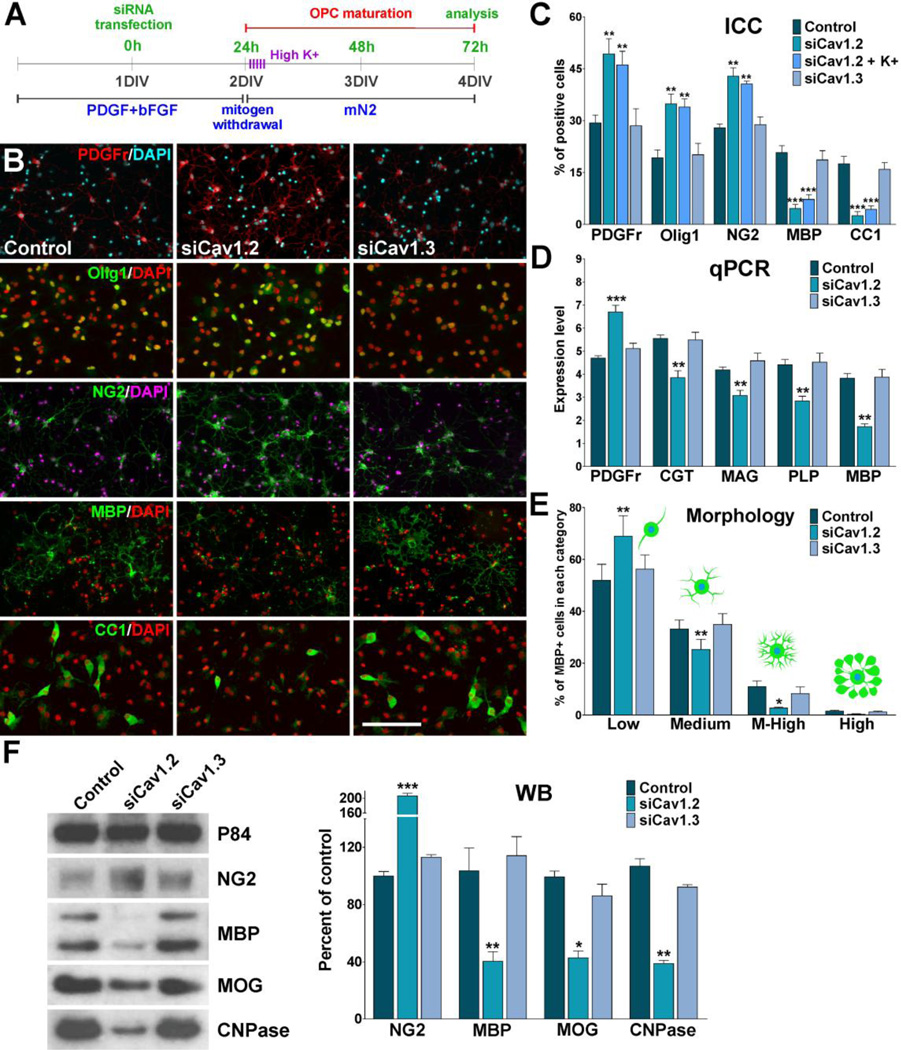
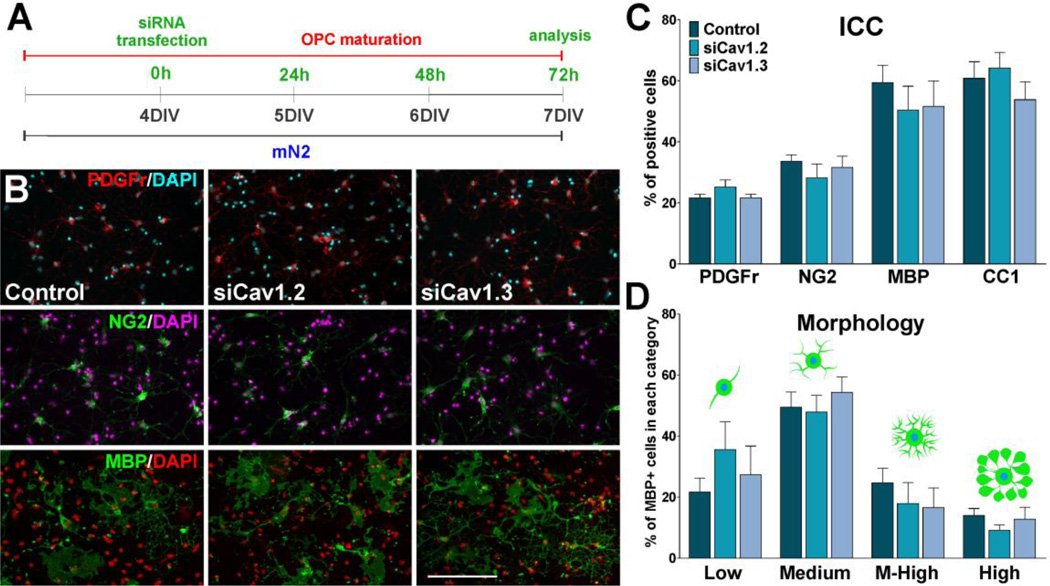
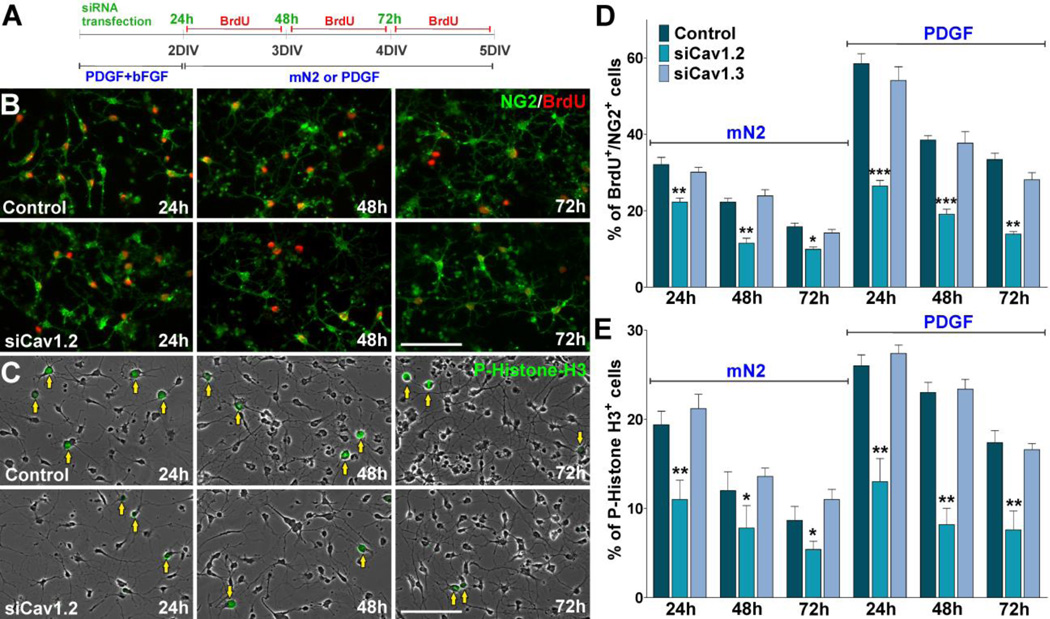
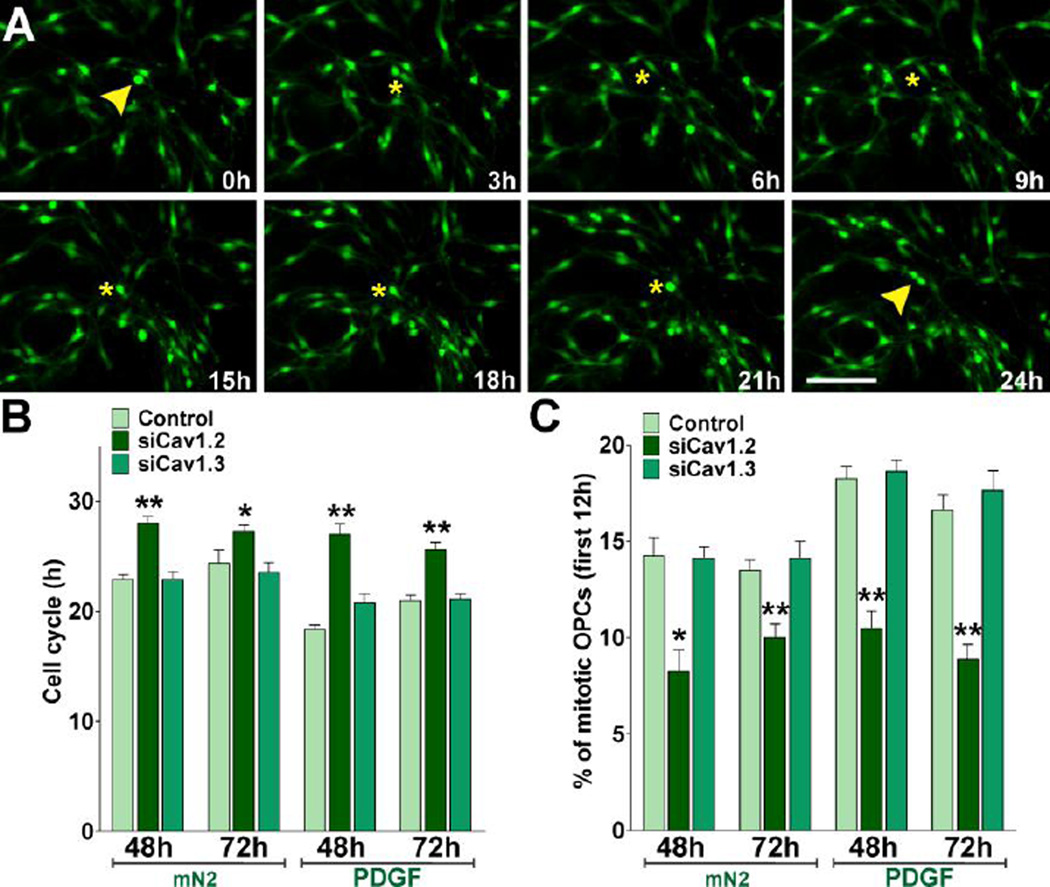
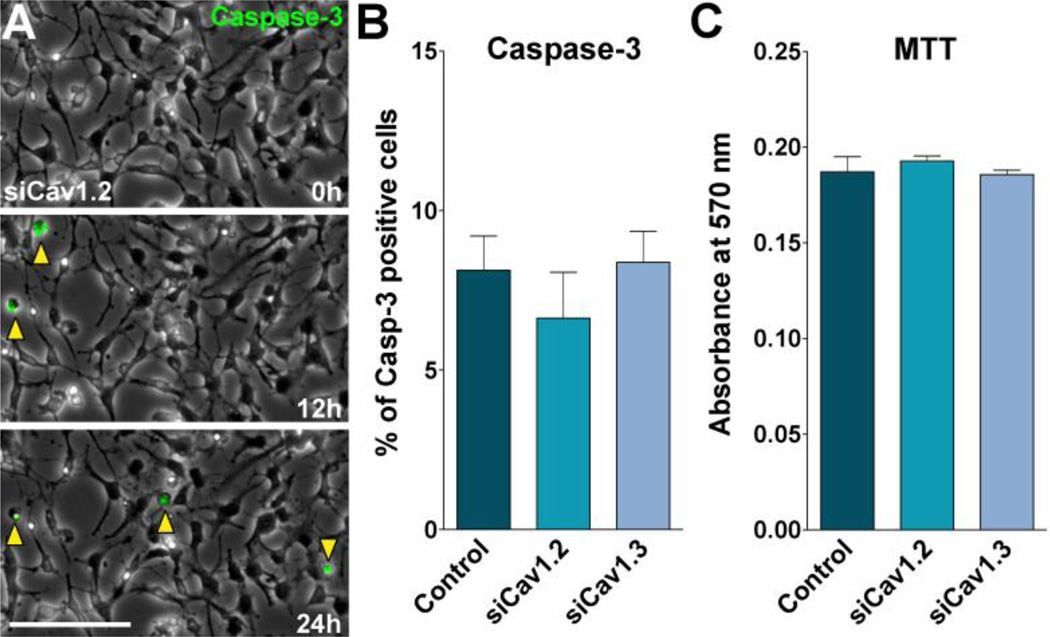
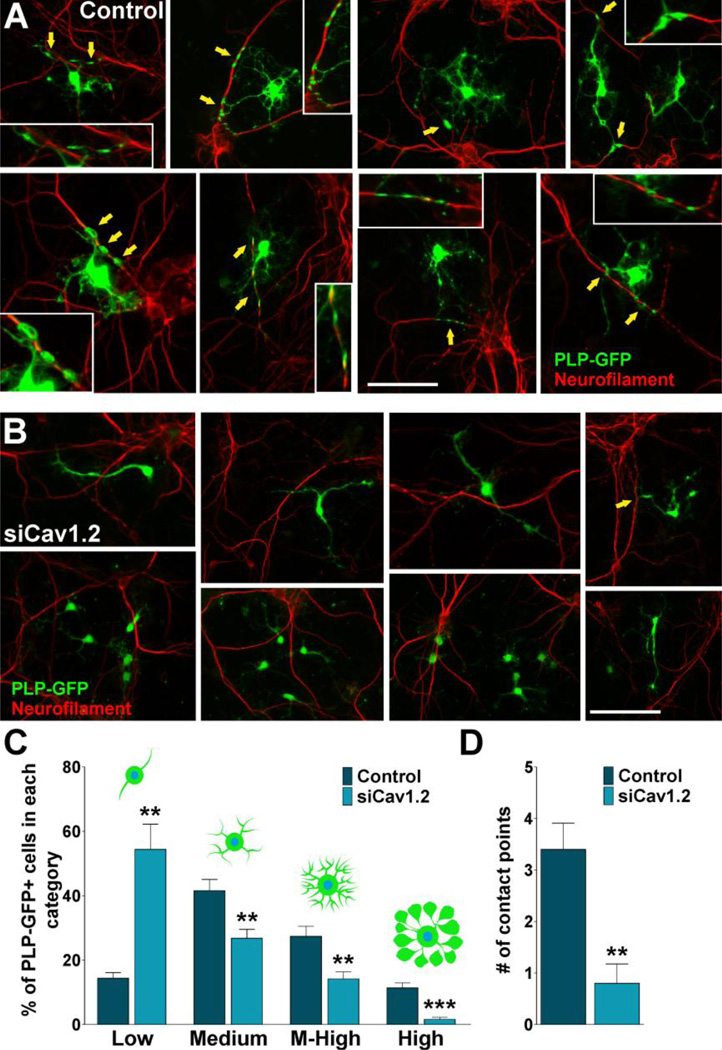
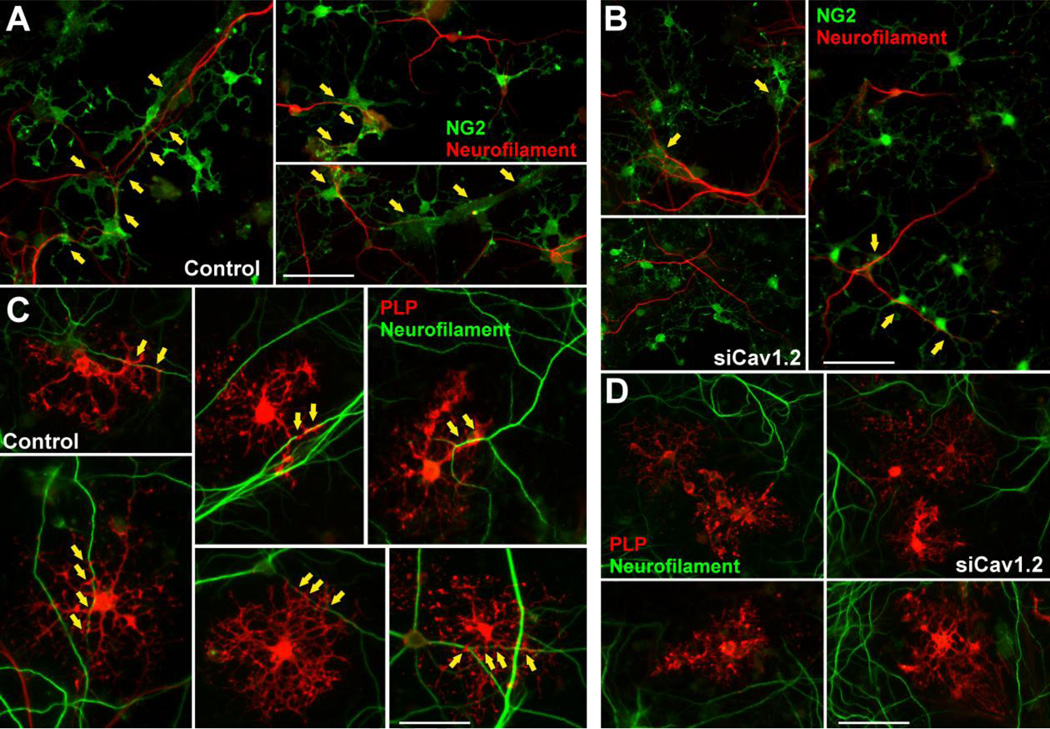
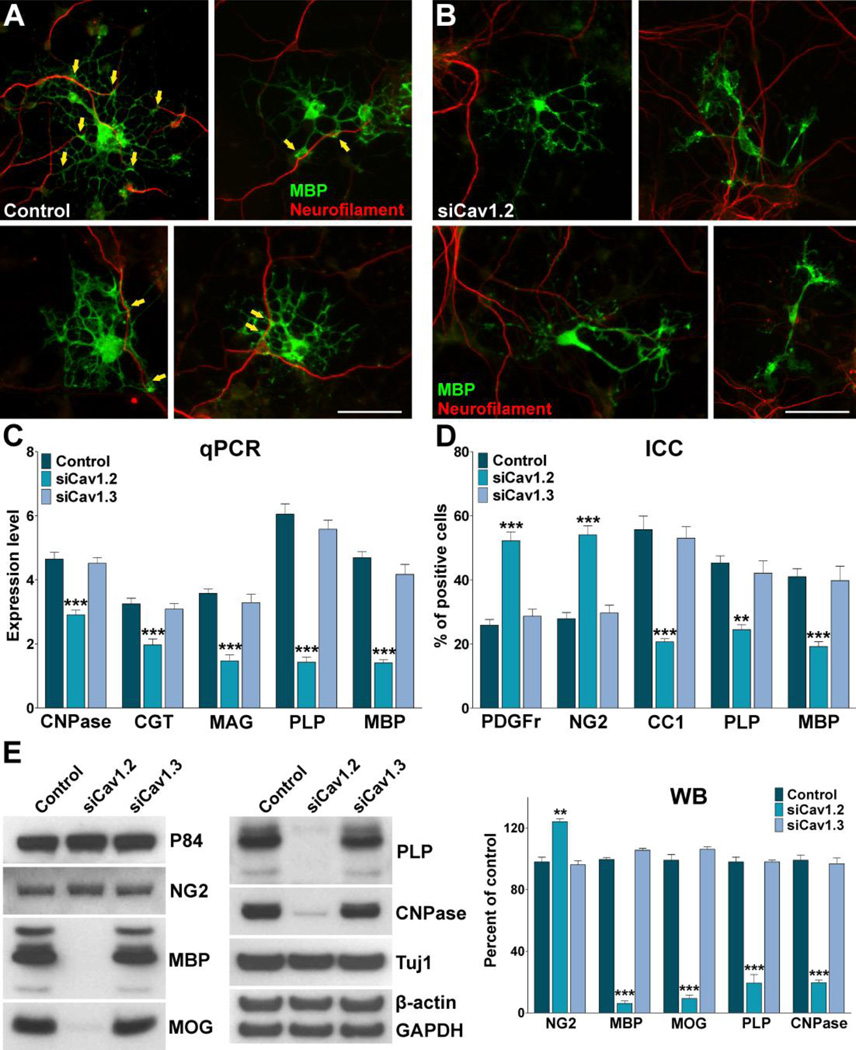
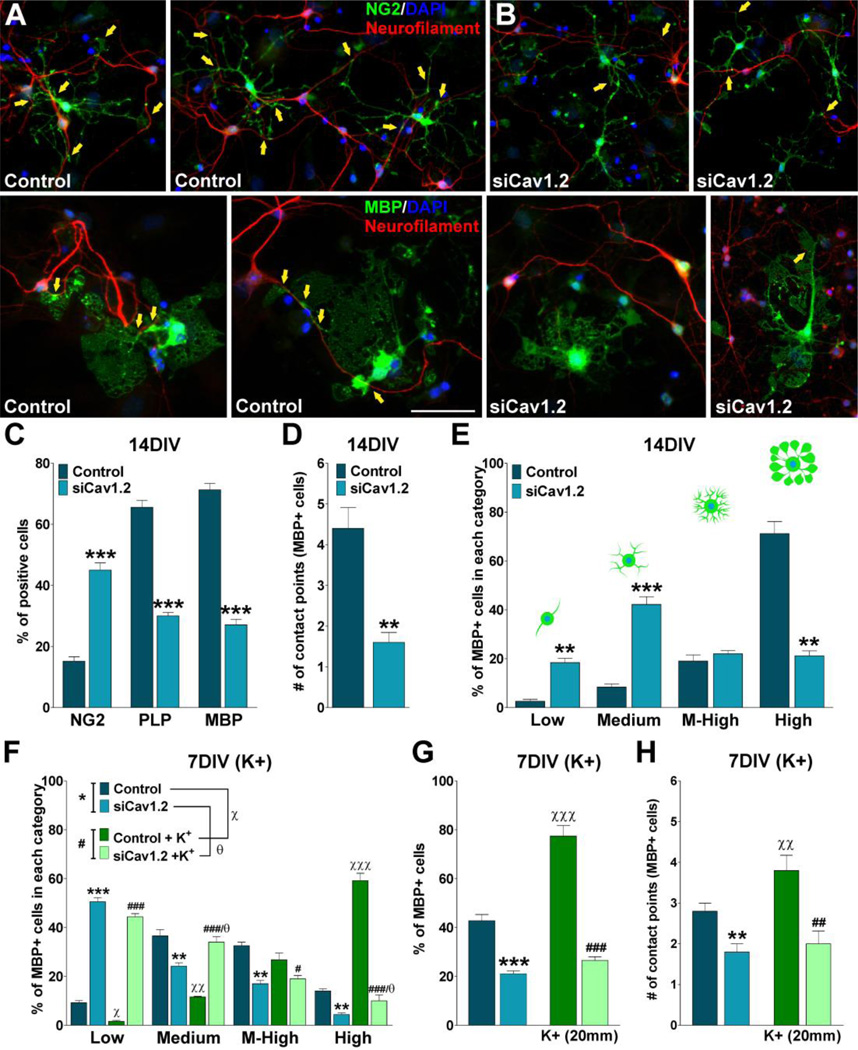
We have previously shown that the expression of voltage-operated Ca(++) channels (VOCCs) is highly regulated in the oligodendroglial lineage and is essential for proper oligodendrocyte progenitor cell (OPC) migration. Here we assessed the role of VOCCs, in particular the L-type, in oligodendrocyte maturation. We used pharmacological treatments to activate or block voltage-gated Ca(++) uptake and siRNAs to specifically knock down the L-type VOCC in primary cultures of mouse OPCs. Activation of VOCCs by plasma membrane depolarization increased OPC morphological differentiation as well as the expression of mature oligodendrocyte markers. On the contrary, inhibition of L-type Ca(++) channels significantly delayed OPC development. OPCs transfected with siRNAs for the Cav1.2 subunit that conducts L-type Ca(++) currents showed reduce Ca(++) influx by ~75% after plasma membrane depolarization, indicating that Cav1.2 is heavily involved in mediating voltage-operated Ca(++) entry in OPCs. Cav1.2 knockdown induced a decrease in the proportion of oligodendrocytes that expressed myelin proteins, and an increase in cells that retained immature oligodendrocyte markers. Moreover, OPC proliferation, but not cell viability, was negatively affected after L-type Ca(++) channel knockdown. Additionally, we have tested the ability of L-type VOCCs to facilitate axon-glial interaction during the first steps of myelin formation using an in vitro co-culture system of OPCs with cortical neurons. Unlike control OPCs, Cav1.2 deficient oligodendrocytes displayed a simple morphology, low levels of myelin proteins expression and appeared to be less capable of establishing contacts with neurites and axons. Together, this set of in vitro experiments characterizes the involvement of L-type VOCCs on OPC maturation as well as the role played by these Ca(++) channels during the early phases of myelination.

Keywords: Calcium influx; Myelination; Oligodendrocyte; Voltage-operated Ca(++) channels.


Figures

FIGURE 1
FIGURE 1. L-type VOCC activation stimulates OPC maturation
(A) One day after plating, OPCs were treated with high K+ and the L-type VOCC inhibitor verapamil. Verapamil (5µM) was added to the culture media for three consecutive days and high K+ (20mM) was applied in five consecutive pulses (5min/each) distributed during the first 5h of the second day in vitro. (B–C) After treatment OPCs were stained with antibodies against Olig1, NG2, MBP, MOG and CC1 and the percentage of positive cells in each experimental condition was examined by confocal microscopy. Scale bar = 60µm (Olig1, MOG, CC1); 80µm (NG2, MBP). (D) Morphological complexity of MBP-positive cells was scored in four categories. Values are expressed as mean ± SEM of four independent experiments. *p<0.05, **p<0.01, ***p<0.001 vs. respective controls.
FIGURE 2
FIGURE 2. siRNA knockdown of L-type VOCCs in OPCs
(A) One day after plating, OPCs were transfected with a combination of three different siRNA duplexes specific for Cav1.2 and Cav1.3 (siCav1.2/1.3). After transfection OPCs were further cultured for 24h in defined culture media plus PDGF and bFGF and then induced to exit from the cell cycle and differentiate by switching the cells to a mitogen-free medium (mN2). (B) OPCs were treated with fluorescein-labeled dsRNA oligomers to determine siRNA transfection efficiency. 24h after transfection the cells were stained with antibodies against NG2 and Olig2. Scale bar = 80µm. (C) 72h after siRNA transfection semi-quantitative RT-PCR and western blot analysis of Cav1.2 and Cav1.3 expression in OPCs was performed using β-actin as internal standard. Data from three independent experiments are summarized based on the relative spot intensities and plotted as percent of controls. (D) 72h after siRNA transfection VOCC activity was examined in cultured OPCs using Fura-2 as intracellular Ca++ indicator. Note that each trace corresponds to a single cell and the horizontal bars indicate the time of addition of external solution containing high K+. (E) The bar graph shows the average amplitude of the Ca++ response, calculated from the responding cells expressed as a percentage of change of the emission intensities. The same experiment was performed in the presence of carbenoxolone (200µM) (CBX). Values are expressed as mean ± SEM of at least six independent experiments. *p<0.05, ***p<0.001 vs. control.
FIGURE 3
FIGURE 3. Cav1.2 knockdown prevents OPC maturation
(A) OPCs were transfected with siRNA duplexes specific for Cav1.2 and Cav1.3 (siCav1.2/1.3) and grown as described in Figure 2. 24h after siRNA transfection, a group Cav1.2 deficient OPCs were treated with high K+. High K+ (20mM) was applied in five consecutive pulses (5min/each) distributed during the first 5h of the third day in vitro. (B–C) 72h after siRNA transfection, OPCs were stained with antibodies against PDGFr, Olig1, NG2, MBP and CC1 and the percentage of positive cells in each experimental condition was examined by confocal microscopy. Scale bar = 60µm (Olig1, CC1); 80µm (PDGFr, NG2, MBP). (D) Real-time PCR experiments were performed using total mRNA extracted from primary cultures of OPCs and specific primers for PDGFr, CGT, MAG, PLP and MBP (Table II). (E) Morphological complexity of MBP-positive cells was scored in four categories. (F) Western blot analysis of myelin proteins expression in OPC primary cultures was performed 72h after siRNA transfection using P84 as internal standard. Data from three independent experiments are summarized based on the relative spot intensities and plotted as percent of controls. Values are expressed as mean ± SEM of four independent experiments. *p<0.05, **p<0.01, ***p<0.001 vs. respective controls. ICC: Immunocytochemistry, qPCR: quantitative real-time PCR, WB: Western blot.
FIGURE 4
FIGURE 4. Cav1.2 knockdown has no effect on the development of more mature premyelinating oligodendrocytes
(A) OPCs were transfected with Cav1.2/1.3 siRNAs after being induced to differentiate by mitogen deprivation. (B–C) Premyelinating oligodendrocytes were stained with antibodies against PDGFr, NG2, MBP and CC1 and the percentage of positive cells in each experimental condition was examined by confocal microscopy. Scale bar = 80µm. (D) Morphological complexity of MBP-positive cells was scored in four categories. Values are expressed as mean ± SEM of four independent experiments. ICC: Immunocytochemistry.
FIGURE 5
FIGURE 5. Decreased cell division in OPCs lacking Cav1.2
(A) OPCs were transfected with siRNA duplexes specific for Cav1.2 and Cav1.3 (siCav1.2/1.3) and grown either in the presence or absence of PDGF. 24h pulses of BrdU were begun at 24h, 48h and 72h after siRNA transfection. After each BrdU pulse, cells were fixed and immunostained with anti-BrdU and anti-NG2 antibodies. (B–C) Microphotographs showing NG2+/BrdU+ and P-Histone H3+ cells grown in mN2 at different time points after siRNA transfection. Arrows indicate P-Histone H3+ cells. Scale bar = 60µm. (D–E) The percentage of NG2+/BrdU+ and P-Histone H3+ cells in each experimental condition was compared with respective controls. Values are expressed as mean ± SEM of four independent experiments. *p<0.05, **p<0.01, ***p<0.001 vs. respective controls.
FIGURE 6
FIGURE 6. Cav1.2 knockdown increases the cell cycle time of mouse OPCs
Primary cultures of PLP-GFP labeled OPCs were transfected with siRNA duplexes specific for Cav1.2 and Cav1.3 (siCav1.2/1.3) and cultured as described in Figure 5. 48h and 72h after transfection, OPCs were incubated in a chamber with 5% CO2 at 37°C, which was placed on the stage of a spinning disc confocal microscope. GFP-labeled OPC clones were imaged with a specific GFP filter at 6min intervals for a period of 30h. (A) Time-lapse series of OPCs from control cultures. Yellow arrowheads designate cytokinesis events. Tracking of cells between birth cytokinesis and division cytokinesis was noted with a yellow asterisk near the cell, which was generated from frame to frame. Each frame represents a single section of a time lapse video sequence. Time is denoted in hours in the bottom right corner. Scale bar = 60µm. (B–C) Estimated cell cycle times and percentage of mitotic OPCs for each experimental condition. Values are expressed as mean ± SEM of four independent experiments. *p<0.05, **p<0.01, vs. respective controls.
FIGURE 7
FIGURE 7. OPC viability after L-type VOCC knockdown
OPCs were transfected with siRNA duplexes specific for Cav1.2 and Cav1.3 (siCav1.2/1.3) and grown as described in Figure 2. (A) Real-time Caspase-3 assay, using NucView 488 Caspase-3 substrate, was performed as described in Materials and Methods. Fluorescent field images were obtained with a specific GFP filter at 6min intervals for a period of 24h beginning 48h after siRNA transfection. Bright field images were superimposed to show the cell morphology. Yellow arrowheads designate some apoptotic OPCs (Caspase-3+ cells). Time is denoted in hours in the bottom right corner. Scale bar = 60µm. (B) OPCs death were evaluated by measuring the percentage of Caspase-3+ cells in each experimental group for a period of 24h. (C) Evaluation of OPCs viability by the MTT assay 48h after siRNA transfection. Values are expressed as mean ± SEM of five independent experiments.
FIGURE 8
FIGURE 8. Co-culture of cortical neurons and VOCC deficient OPCs
(A–B) PLP-GFP labeled OPCs were transfected with siRNA duplexes specific for Cav1.2 (siCav1.2). 24h after siRNA transfection, control and transfected OPCs were co-cultured with cortical neurons for 7 days. Arrows indicate oligodendrocyte-neurite contact points (see insets for high magnification pictures). Scale bar = (A) 60µm; (B, upper panel) 60µm, (B, lower panel) 80µm. (C) Morphological complexity of control and siCav1.2 transfected PLP-GFP+ cells in co-culture was scored in 4 categories. (D) The number of contact points with neurites was analyzed in control and Cav1.2 transfected cells. Results are the means ± SEM for three independent experiments. >200 cells were analyzed per experimental condition.**p<0,01 and ***p<0,001 vs. respective controls.
FIGURE 9
FIGURE 9. VOCC deficient oligodendrocytes fail to interact with neurons at different developmental stages
OPCs were transfected with siRNA duplexes specific for Cav1.2 (siCav1.2). 24h after siRNA transfection, control and transfected OPCs were co-cultured with cortical neurons for 7 days. (A–B) Examples of NG2 immunostaining in 7 days old co-cultures. Scale bar = (A) 40µm; (B) 60µm. (C–D) Examples of PLP immunostaining in 7 days old co-cultures. Scale bar = 40µm. Yellow arrows indicate oligodendrocyte-neurite contact points.
FIGURE 10
FIGURE 10. L-type VOCCs are necessary for neuron-glia interaction and myelination in vitro
Co-cultures were prepared as described in Figure 9. (A–B) Examples of MBP immunostaining in 7 days old co-cultures. Scale bar = 40µm. Yellow arrows indicate oligodendrocyte-neurite contact points. (C) Real-time PCR experiments were performed using total mRNA extracted from 7 days old co-cultures and specific primers for CNPase, CGT, MAG, PLP and MBP (Table II). (D) Immunocytochemical analysis of oligodendrocyte differentiation markers and myelin protein expression in 7 days old co-cultures. OPCs were stained with antibodies against PDGFr, NG2, CC1, PLP and MBP and the percentage of positive cells in each experimental condition was examined by confocal microscopy. (E) Western blot analysis of myelin proteins expression in 7 days old co-cultures was performed using P84, GAPDH and β-actin as internal standards. Data from three independent experiments are summarized based on the relative spot intensities and plotted as percent of controls. Values are expressed as mean ± SEM of four independent experiments. **p<0.01, ***p<0.001 vs. respective controls. ICC: Immunocytochemistry, qPCR: quantitative real-time PCR, WB: Western blot.
FIGURE 11
FIGURE 11. Two weeks of co-culture did not significantly improve the maturation of OPCs lacking L-type VOCCs
Co-cultures were prepared as described in Figure 9. (A–B) Examples of NG2 and MBP immunostaining in 14 days old co-cultures. Scale bar = (NG2) 60µm; (MBP) 40µm. Yellow arrows indicate oligodendrocyte-neurite contact points. (C) Percentage of NG2, PLP and MBP positive cells in 14 days old co-cultures. (D) The number of contact points with neurites was analyzed in control and siCav1.2 MBP+ cells. (E) Morphological complexity of control and siCav1.2 MBP+ cells was scored in 4 categories. Co-cultures were treated with high K+. Potassium was applied in three consecutive pulses (5min/each) distributed during the first 3h of the second, third and fourth day in vitro. After treatment, the morphological complexity (F), the percentage (G) and the number of contact points with neurites (H) of MBP+ cells was analyzed in each experimental condition. Values are expressed as mean ± SEM of four independent experiments. *p<0.05, **p<0.01, ***p<0.001 vs. respective controls.

References

    1. Agresti C, Meomartini ME, Amadio S, Ambrosini E, Volonté C, Aloisi F, Visentin S. ATP regulates oligodendrocyte progenitor migration, proliferation, and differentiation: involvement of metabotropic P2 receptors. Brain Res Rev. 2005;48:157–165. - PubMed
    1. Agresti C, D’Urso D, Levi G. Reversible inhibitory effects of interferon-γ and tumour necrosis factor-α on oligodendroglial lineage cell proliferation and differentiation in vitro. Eur J Neurosci. 1996;8:1106–1116. - PubMed
    1. Alberdi E, Sanchez-Gomez MV, Matute C. Calcium and glial cell death. Cell Calcium. 2005;38:417–425. - PubMed
    1. Amur-Umarjee S, Phan T, Campagnoni AT. Myelin basic protein mRNA translocation in oligodendrocytes is inhibited by astrocytes in vitro. J Neurosci Res. 1993;36:99–110. - PubMed
    1. Belachew S, Malgrange B, Rigo JM, Rogister B, Leprince P, Hans G, Nguyen L, Moonen G. Glycine triggers an intracellular calcium influx in oligodendrocyte progenitor cells which is mediated by the activation of both the ionotropic glycine receptor and Na+-dependent transporters. Eur J Neurosci. 2000;12:1924–1930. - PubMed

Publication types

Substances