. 2015 Jan 12;32(1):54-67.
doi: 10.1016/j.devcel.2014.10.026. Epub 2014 Dec 24.

Profilin-1 serves as a gatekeeper for actin assembly by Arp2/3-dependent and -independent pathways

Affiliations

Profilin-1 serves as a gatekeeper for actin assembly by Arp2/3-dependent and -independent pathways

Jeremy D Rotty et al. Dev Cell. .

Abstract

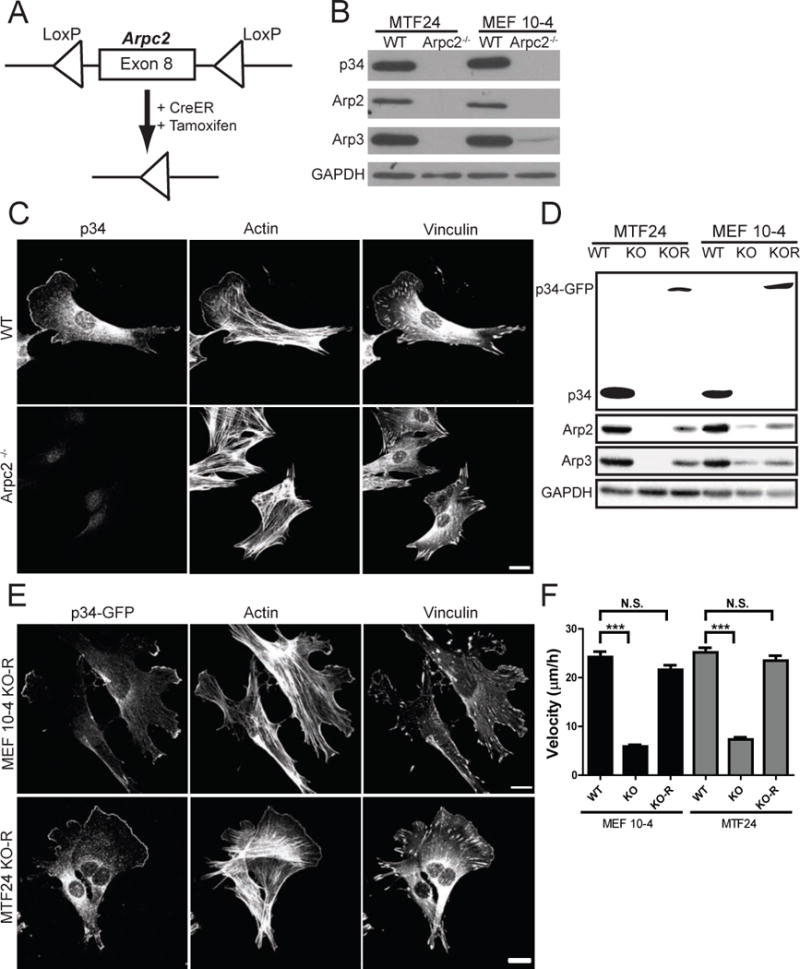
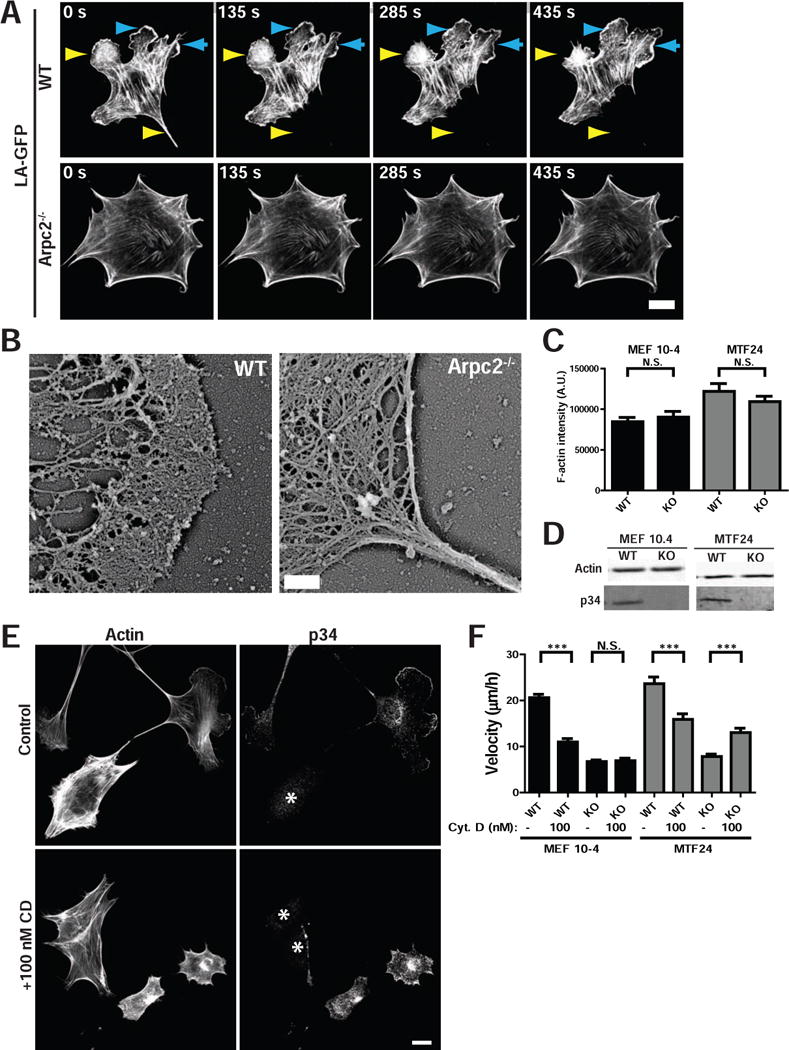
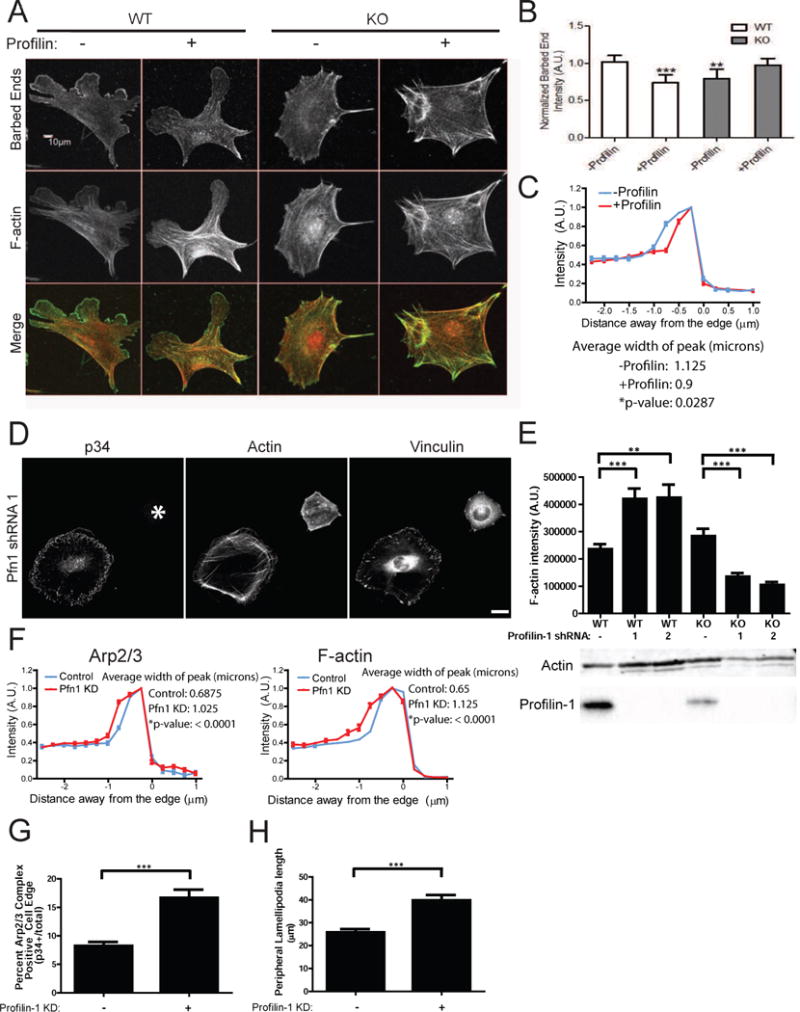
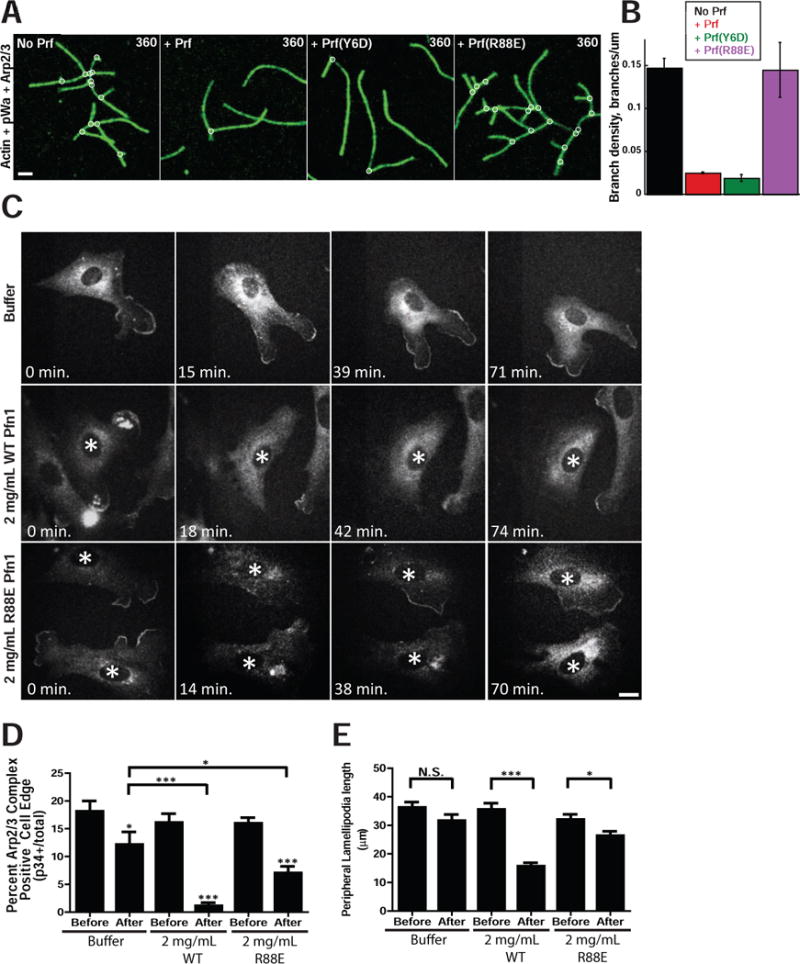
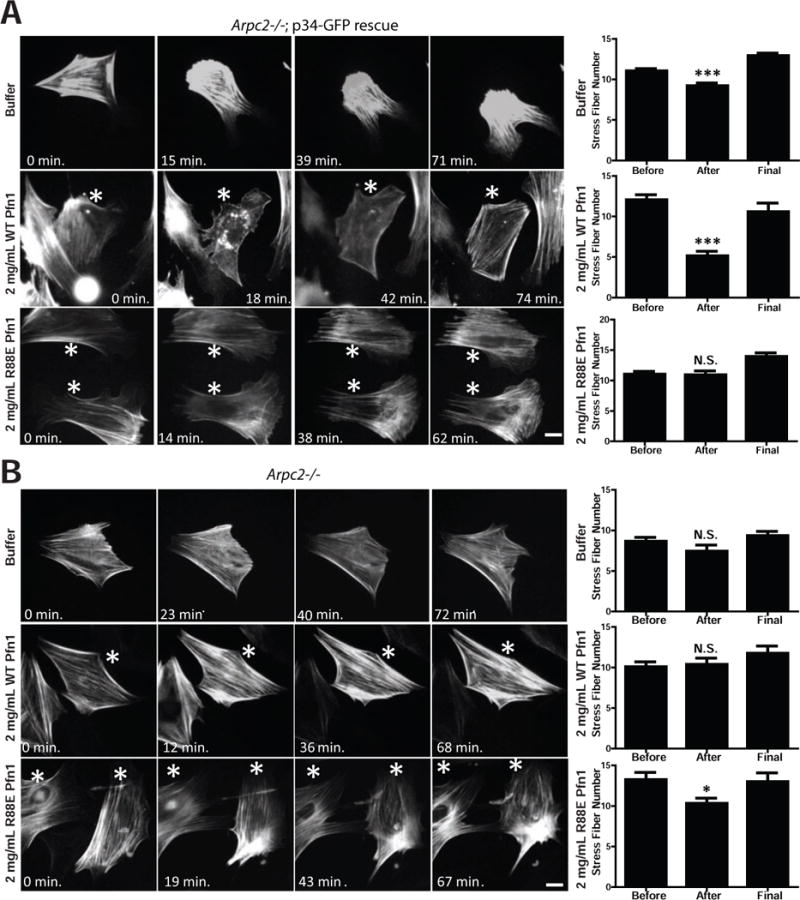
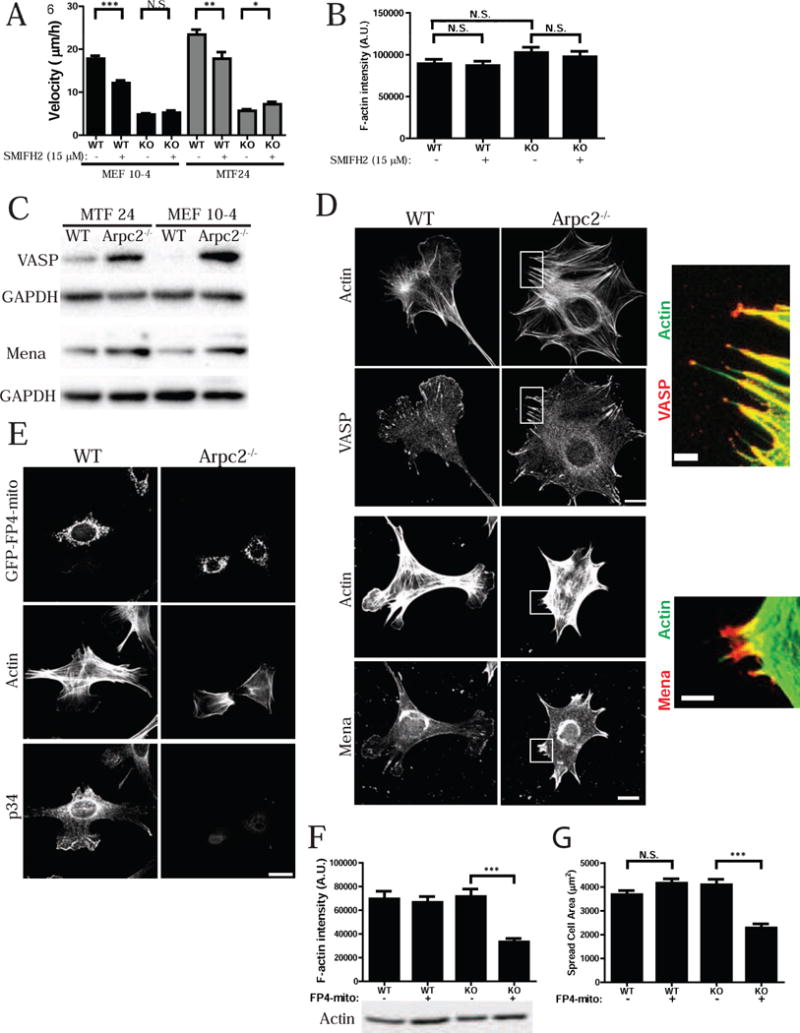
Cells contain multiple F-actin assembly pathways, including the Arp2/3 complex, formins, and Ena/VASP, which have largely been analyzed separately. They collectively generate the bulk of F-actin from a common pool of G-actin; however, the interplay and/or competition between these pathways remains poorly understood. Using fibroblast lines derived from an Arpc2 conditional knockout mouse, we established matched-pair cells with and without the Arp2/3 complex. Arpc2(-/-) cells lack lamellipodia and migrate more slowly than WT cells but have F-actin levels indistinguishable from controls. Actin assembly in Arpc2(-/-) cells was resistant to cytochalasin-D and was highly dependent on profilin-1 and Ena/VASP but not formins. Profilin-1 depletion in WT cells increased F-actin and Arp2/3 complex in lamellipodia. Conversely, addition of exogenous profilin-1 inhibited Arp2/3 complex actin nucleation in vitro and in vivo. Antagonism of the Arp2/3 complex by profilin-1 in cells appears to maintain actin homeostasis by balancing Arp2/3 complex-dependent and -independent actin assembly pathways.


Conflict of interest statement

The authors declare no conflicts of interest.

Figures

Figure 1
Figure 1. Generation and characterization of Arpc2−/− fibroblast cell lines
A) Schematic representation of tamoxifen-inducible CreER activation and Arpc2 (p34) deletion. B) Blot analysis of two mouse fibroblast cell lines without (WT) or with (Arpc2−/−) tamoxifen treatment. C) Staining of MTF24 WT and Arpc2−/− fibroblasts; scale bar = 20 microns. D) Blot analysis of cell lines without (WT), with (KO) tamoxifen treatment, or KO cells stably rescued with p34-GFP (KO-R). E) Staining of MEF 10-4 KO-R and MTF24 KO-R fibroblasts; GFP indicates p34-GFP; scale bars = 20 microns. F) Random migration velocity of WT, KO, and KO-R MEF 10-4 (black bars) and MTF24 (grey bars) fibroblasts; N = at least 54 cells per condition; error bars represent standard error of the mean; ***p-value < 0.0001. See also Figure S1.
Figure 2
Figure 2. Comparison of actin structure and dynamics in WT and Arpc2−/− cells
A) Still frames from live cell imaging of MEF 10-4 WT and Arpc2−/− cells stably transfected with the live cell actin probe LifeAct (LA)-GFP showing dynamic F-actin behavior in each cell type. Cyan arrowheads denote protrusion, yellow arrowheads denote retraction; scale bar = 20 microns. B) Cryo-shadowing EM of F-actin networks in MTF24 WT and Arpc2−/− cellular protrusions; scale bar = 500 nm. C) Integrated pixel density of phalloidin staining in fixed WT and KO cells from both lines plotted as average F-actin intensity/cell. N = 100 cells per condition; error bars represent standard error of the mean; N.S. = Not Significant. D) Blots of whole cell lysates loaded by cell equivalents for both lines. E) Staining of MTF24 WT and Arpc2−/− fibroblasts in mixed culture (KO cells marked with *) after addition of 100 nM cytochalasin D (CD) for 2h; scale bar = 20 microns. F) Random migration velocity of MEF 10-4 (black bars) and MTF24 (grey bars) WT and KO control (−) cells or cells treated with 100 nM CD (+); N = at least 30 cells per condition; error bars represent standard error of the mean; ***p-value ≤ 0.0001. See also Figure S1.
Figure 3
Figure 3. Actin assembly in Arpc2−/− cells is highly dependent upon profilin
A) Barbed end assay relating the distribution of labeled barbed ends to total F-actin in MEF 10-4 WT or KO cells in the absence (−) or presence (+) of profilin; scale bar = 10 microns. B) Quantification of barbed end staining. Barbed end fluorescence intensity normalized to F-actin, with each condition plotted relative to control cells (WT minus profilin). **p-value = 0.0036, ***p-value = 0.0001. C) Barbed end distribution at the periphery of WT MEF 10-4 cells in the presence (+) or absence (−) of profilin in barbed end assay (cell edge = 0, negative values = intracellular distance from edge). Plotted as mean ± SEM. The mean width of the peak intensity was also quantified, analyzed by T-test and is presented numerically alongside the graph. D) Staining of MEF 10-4 WT and Arpc2−/− Profilin-1 KD fibroblasts (Pfn1 KD) in mixed culture (KO cell marked with *); scale bar = 20 microns. E) Integrated pixel density of phalloidin staining in fixed MEF 10-4 WT and KO cells ± Pfn1 KD plotted as average F-actin intensity/cell, with SEM. N = 50 cells per condition, ***p-value < 0.0001, **p-value = 0.0003. Blots of whole cell lysate matched by cell number directly below. F) Distribution of p34 and F-actin at the periphery of control or Pfn1 KD MEF 10-4 cells (cell edge = 0, negative values = intracellular distance from edge). Plotted as mean ± SEM. The mean width of the peak intensity was also quantified, analyzed by T-test and is presented numerically alongside the graph. G) Comparison of Arp2/3 positive edge in MEF 10-4 control or Pfn1 KD cells. High Arp2/3 complex signal in a narrow band along the perimeter was detected and divided by total cell perimeter to yield Arp2/3 complex enriched edge, plotted as average percent Arp2/3 complex positive edge with SEM. N = 29 for WT, 24 for WT Pfn1 KD cells, ***p < 0.0001. H) Peripheral lamellipodia length. The length of p34 positive edge was determined by outlining the periphery of each protrusion in ImageJ to yield the peripheral length in microns. N = at least 128 lamellipodia. ***p < 0.0001. See also Figure S2, S3.
Figure 4
Figure 4. Profilin inhibits Arp2/3 complex actin nucleation, disrupts Arp2/3 complex leading edge localization and impedes lamellipodia generation
A) Time-lapse TIRF microscopy of 1.5 μM Oregon green-labeled actin polymerized in the presence of 40 nM Arp2/3 complex, 150 nM pWA in the absence (No Prf) or presence of either 5 μM WT (+ Prf), Y6D, or R88E hProfilin-1. Scale bar = 2 microns. B) Effect of WT, Y6D or R88E hProfilin-1 on branch density, quantified from time-lapse TIRF experiments in A. Plotted as mean plus SEM. C) Representative images of p34-GFP localization before (0 min) and at various times after microinjection of buffer, 2 mg/mL WT hProfilin-1, or 2 mg/mL R88E hProfilin-1. Scale bar = 20 microns. Asterisks denote microinjected cells in images with multiple cells. D) Percent of p34-GFP positive edge. Quantified as positive edge/total edge × 100% based on measurements done by hand in ImageJ. Measurements were made before and directly after microinjection for each condition, plotted as mean with SEM. N = at least 31 cells per condition. ***p-value < 0.0001, *p-value < 0.05; p-values for each post-injection mean are to pre-injected cells of same condition, unless explicitly noted otherwise. E) Peripheral lamellipodia length. The length of p34-GFP positive edge was determined by outlining the periphery of each protrusion in ImageJ to yield the peripheral length in microns, plotted as mean with SEM. N = at least 66 lamellipodia in pre-injection for each condition; N = 67 for buffer post-injection, 58 for R88E post-injection and 11 for WT post-injection. ***p-value = 0.0006, *p-value = 0.0426. See also Figure S3.
Figure 5
Figure 5. Profilin affects overall F-actin structure in cells with functional Arp2/3 complex
A) Representative images of Lifeact-RFP labeling in p34 knockout-rescue cells (Arpc2−/−; p34-GFP rescue) before (0 min.) and at various times after microinjection of buffer, 2 mg/mL WT hProfilin-1, or 2 mg/mL R88E hProfilin-1. Scale bar = 20 microns. Asterisks denote microinjected cells in images with multiple cells. Right: Quantification of stress fiber number from images before, after and at the end (‘final’) of the post-injection time course. Counted as number of stress fibers across a line drawn perpendicular to the predominant stress fiber orientation, plotted as mean with SEM; N = 198 measurements from 66 buffer-injected cells, 78 measurements from 26 WT hProfilin-1 injected cells, 60 measurements from 20 R88E hProfilin-1 injected cells. ***p-value < 0.0001. B) Representative images of Lifeact-RFP labeling in Arpc2−/− cells before (0 min.) and at various times after microinjection of buffer, 2 mg/mL WT hProfilin-1, or 2 mg/mL R88E hProfilin-1. Scale bar = 20 microns. Asterisks denote microinjected cells in images with multiple cells. Right: Quantification of stress fiber number, plotted as mean with SEM; N = 36 measurements from 12 buffer-injected cells, 60 measurements from 20 WT hProfilin-1 injected cells, or 42 measurements from 14 R88E hProfilin-1 injected cells. *p-value = 0.0103. See also Figure S3.
Figure 6
Figure 6. Formin and Ena/VASP differentially affect actin homeostasis depending on cellular Arp2/3 complex status
A) Random migration velocity of MEF 10-4 (black bars) and MTF24 (grey bars) WT and KO control (−) cells or cells treated with 15 μM SMIFH2 (+), plotted as mean and SEM; N = at least 48 cells per condition. ***p-value < 0.0001, **p-value = 0.0040, *p-value = 0.0219, N.S. = Not Significant. B) Integrated pixel density of phalloidin staining in fixed MEF 10-4 WT and KO cells in the presence or absence of 15 μM SMIFH2, plotted as average F-actin intensity/cell, with SEM. N = at least 120 cells per condition. C) Blots of WT and Arpc2−/− cells. D) Staining of MEF 10-4 WT and Arpc2−/− fibroblasts; scale bar = 20 microns. Boxed regions are magnified and merged with VASP or Mena in red and F-actin in green; scale bar of magnified image is 5 microns. E) Staining of MEF 10-4 WT and Arpc2−/− cells expressing GFP-FP4-mito; scale bar = 20 microns. F) Integrated pixel density of phalloidin staining in fixed MEF 10-4 WT and KO cells, or WT/KO cells stably expressing GFP-FP4-mito (FP4-mito +), plotted as average F-actin intensity/cell, with standard error of the mean. N = at least 38 cells per condition; ***p-value < 0.0001. Blots of whole cell lysate matched by cell number directly below. G) Spread cell area in sq. microns of MEF 10-4 WT, WT FP4-mito, KO and KO FP4-mito cells plotted as average area/cell with SEM. N = at least 140 cells per condition; ***p-value < 0.0001. See also Figures S4–S6.

Comment in

References

    1. Barzik M, Kotova TI, Higgs HN, Hazelwood L, Hanein D, Gertler FB, Schafer DA. Ena/VASP proteins enhance actin polymerization in the presence of barbed end capping proteins. J Biol Chem. 2005;280:28653–28662. - PMC - PubMed
    1. Bear J, Loureiro J, Libova I, Fassler R, Wehland J, Gertler F. Negative regulation of fibroblast motility by Ena/VASP proteins. Cell. 2000;101:717–728. - PubMed
    1. Bear JE, Gertler FB. Ena/VASP: towards resolving a pointed controversy at the barbed end. J Cell Sci. 2009;122:1947–1953. - PMC - PubMed
    1. Bear JE, Svitkina TM, Krause M, Schafer DA, Loureiro JJ, Strasser GA, Maly IV, Chaga OY, Cooper JA, Borisy GG, et al. Antagonism between Ena/VASP Proteins and Actin Filament Capping Regulates Fibroblast Motility. Cell. 2002;109:509–521. - PubMed
    1. Bilancia CG, Winkelman JD, Tsygankov D, Nowotarski SH, Sees JA, Comber K, Evans I, Lakhani V, Wood W, Elston TC, et al. Enabled negatively regulates diaphanous-driven actin dynamics in vitro and in vivo. Dev Cell. 2014;28:394–408. - PMC - PubMed

Publication types