. 2015 Jan 12;32(1):43-53.
doi: 10.1016/j.devcel.2014.10.027. Epub 2014 Dec 24.

Profilin regulates F-actin network homeostasis by favoring formin over Arp2/3 complex

Affiliations

Profilin regulates F-actin network homeostasis by favoring formin over Arp2/3 complex

Cristian Suarez et al. Dev Cell. .

Abstract

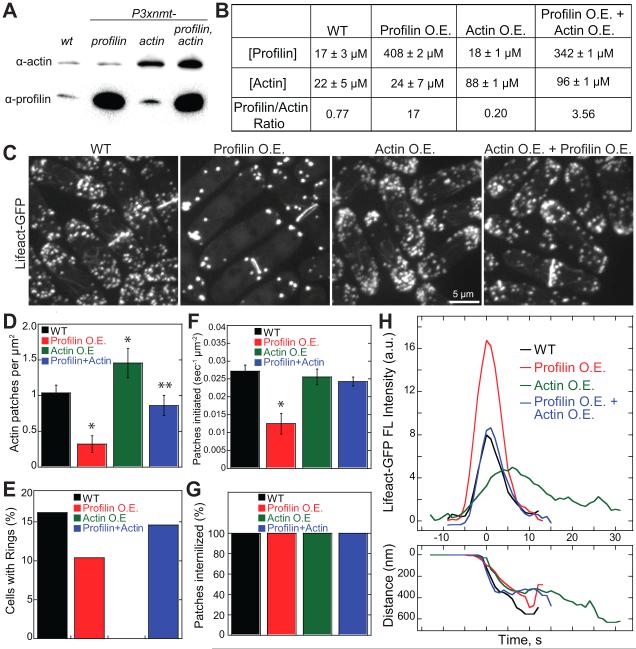
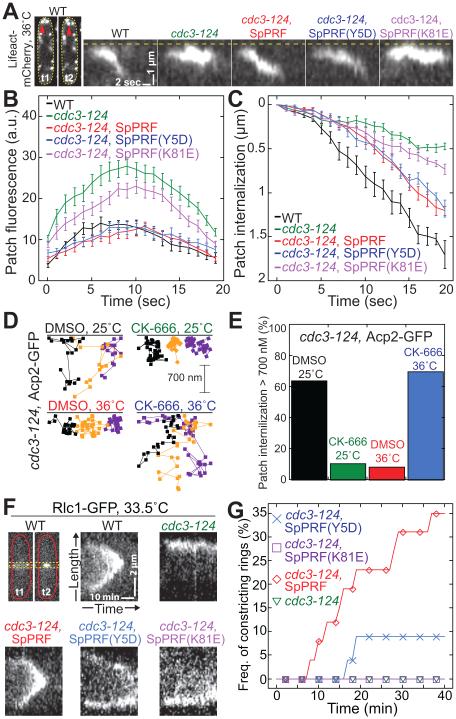
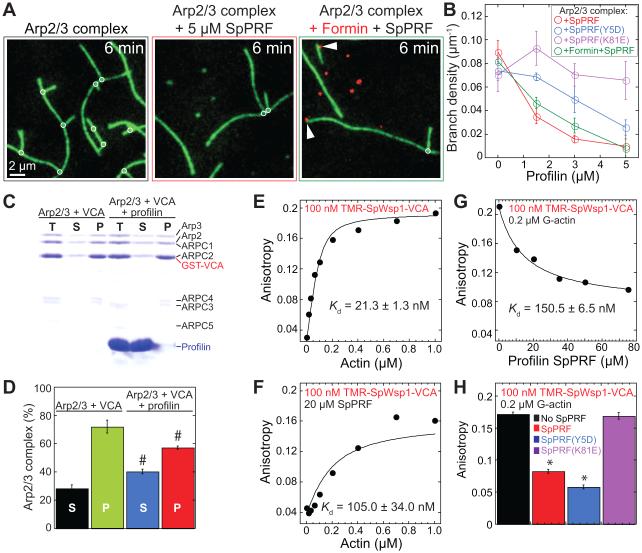
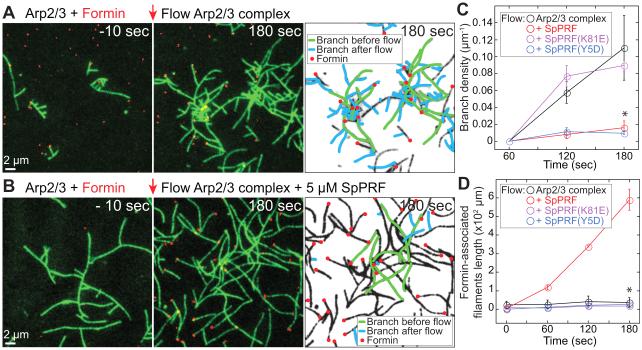
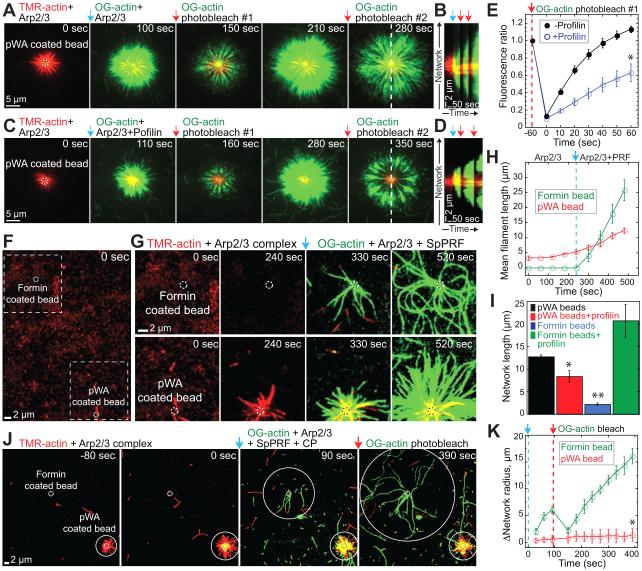
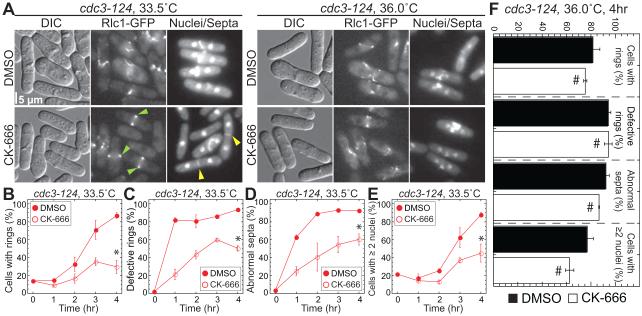
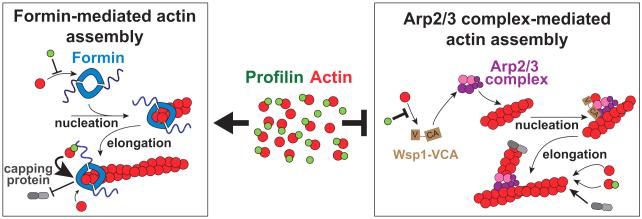
Fission yeast cells use Arp2/3 complex and formin to assemble diverse filamentous actin (F-actin) networks within a common cytoplasm for endocytosis, division, and polarization. Although these homeostatic F-actin networks are usually investigated separately, competition for a limited pool of actin monomers (G-actin) helps to regulate their size and density. However, the mechanism by which G-actin is correctly distributed between rival F-actin networks is not clear. Using a combination of cell biological approaches and in vitro reconstitution of competition between actin assembly factors, we found that the small G-actin binding protein profilin directly inhibits Arp2/3 complex-mediated actin assembly. Profilin is therefore required for formin to compete effectively with excess Arp2/3 complex for limited G-actin and to assemble F-actin for contractile ring formation in dividing cells.


Figures

Figure 1
Figure 1. The ratio of profilin to actin facilitates F-actin network diversity in fission yeast
(A and B) Soluble actin and profilin levels in WT cells, and cells overexpressing (O.E.) actin, profilin SpPRF or both at 22 hours without thiamine. (A) Immunoblot analysis of equally loaded total soluble extracts. (B) Quantification of cytoplasmic actin and profilin concentrations (mean±s.d., n=2–4), and their ratio. (C-H) Comparison of Lifeact-GFP-labeled F-actin structures in WT cells, and cells O.E. profilin, O.E. actin, or O.E. both actin and profilin at 22 hours without thiamine. (C) Fluorescence micrographs of actin structures labeled with Lifeact-GFP. Scale bar, 5 μm. (D–G) Comparison of (D) actin patch density, n=6 cells per strain, (E) percentage of cells with contractile actin rings, n≥43 cells, (F) rates of patch initiation, n=3 cells per strain, and (G) percentage of patches internalized, n=5 cells. Error bars, s.d. Asterisks indicate statistical significance compared to wild type, T-test: * p<0.002, ** p<0.05. (H) Average time courses of the fluorescence intensity (top) and the distance from origin (bottom) for actin patches labeled with Lifeact-GFP. Raw time courses for 10 patches for each strain were aligned to initiation of patch movement (time=0), and averaged at each time point. See also Figure S1.
Figure 2
Figure 2. Profilin has roles in both endocytic actin patches and cytokinetic contractile rings
(A–C) Profilin decreases actin incorporation into actin patches. Lifeact-mCherry labeled actin patches in WT (black), cdc3-124 (green), or cdc3-124 cells expressing WT SpPRF (red), SpPRF(Y5D) (blue), or SpPRF(K81E) (purple) at 36°C. See also Movie S1. (A) Kymographs of representative patch internalization from the cortex (dashed line). Far-left images correspond to patches (red arrow) in a WT cell, where t2 is 1.8 sec after t1. (B) Actin patch fluorescence intensity over time. Error bars, s.d.; n=10 patches per strain. (C) Actin patch internalization from the cortex over time. Error bars, s.d.; n=10 patches per strain. (D and E) Actin capping protein Acp2-GFP labeled actin patches in cdc3-124 cells at 25 or 36°C with and without 50 μM CK-666. (D) Trajectories of three representative patches over time. (E) ercent of patches that internalize at least 700 nm. n=50 patches per strain. (F and G) Cytokinesis defects at 33.5°C in WT (black), cdc3-124 (green), or cdc3-124 cells expressing WT SpPRF (red), SpPRF(Y5D) (blue), or SpPRF(K81E) (purple). (F) Kymographs of representative contractile rings labeled with Rlc1-GFP. Single Z-plane images were acquired every 1 min. Top-left images correspond to a constricting ring in a WT cell, where t1=12 min and t2=29 min after ring formation. Yellow dotted lines mark the region used for kymographs. (G) umulative frequency of constricting contractile rings over time. n≥18 cells per strain.
Figure 3
Figure 3. Profilin inhibits Arp2/3 complex branch formation
(A–B) TIRFM visualization of 1.5 μM Mg-ATP-actin (15% Oregon Green-actin) with 40 nM SpArp2/3 complex and 80 nM SpWsp1(VCA), 10 pM formin SNAP-549(red)-SpCdc12(FH11PFH2), and 5 μM profilin SpPRF. See also Figure S2 and Movie S2. (A) F-actin after six minutes of assembly, with marked Arp2/3 complex branches (circles) and formin-associated barbed ends (arrowheads). (B) Dependence of Arp2/3 complex branch density on the concentration of WT SpPRF (red), SpPRF(K81E) (purple), SpPRF(Y5D) (blue), or formin and WT SpPRF (green). Error bars, s.e.; n=2 reactions. (C–D) Pull down of 0.3 μM SpArp2/3 complex with 2 μM GST-Wsp1(VCA) by Glutathione-Sepharose in the absence or presence of 58 μM profilin SpPRF. (C) Coomassie Blue stained SDS-PAGE gel of the total reaction before centrifugation (T), supernatant (S), and pellet (P). (D) Percentage of Arp2/3 complex in the supernatant (S) and pellet (P). Error bars, s.e.; n=2 reactions. Pound signs indicate no statistical differences in the absence and presence of profilin, T-test: # p>0.05. (E-H) Fluorescence anisotropy assays of 100 nM TMR-SpWsp1(VCA) equilibrium binding to (E) G-actin, (F) G-actin with 20 μM WT profilin SpPRF, (G) 0.2 μM G-actin over a range of profilin SpPRF concentrations, or (H) 0.2 μM G-actin in the absence or presence of 35 μM WT SpPRF, SpPRF(Y5D), or SpPRF(K81E). Curve fits yielded apparent equilibrium constants (Kd) for TMR-SpWsp1(VCA) binding G-actin. Anisotropy experiments were performed in duplicate. Error bars, s.e.; n=2 reactions. Asterisks indicate statistical significance compared to no profilin or SpPRF(K81E), T-test: * p<0.002.
Figure 4
Figure 4. Profilin favors formin-over Arp2/3 complex-mediated actin assembly in vitro
(A–D) TIRFM visualization of 1.5 μM Mg-ATP-actin (15% Oregon Green-actin) with 40 nM SpArp2/3 complex and 80 nM SpWsp1(VCA), 100 pM formin SNAP-549(red)-SpCdc12(FH11PFH2), and 5 μM profilin SpPRF. See also Figure S3 and Movie S3. (A and B) Addition of profilin into mixtures of Arp2/3 complex and formin. Initial reactions contained Mg-ATP-actin, Arp2/3 complex, SpWsp1(VCA) and formin. At t=0 sec (red arrow) additional Mg-ATP-actin, Arp2/3 complex and SpWsp1(VCA) were flowed into the chamber in the (A) absence or (B) presence of WT SpPRF. Inverted micrographs indicate formin-associated filaments (red dots), and Arp2/3 complex branches initiated before (green) and after (blue) flow. (C) The branch density and (D) length of total formin-associated F-actin over time are plotted in the absence and presence of WT and mutant profilin. Error bars, s.e.; n=2 reactions. Asterisks indicate statistical significance compared to (C) SpPRF(K81E) and (D) SpPRF, T-test: * p<0.02.
Figure 5
Figure 5. Biomimetic reconstitution of the effect of profilin on competition between formin and Arp2/3 complex
(A–E) TIRFM visualization of the assembly of 1.5 μM Mg-ATP-actin monomers from beads coated with mammalian Arp2/3 complex activator GST-pWA. Initial reactions contained 10% TMR(red)-actin and (A-D) 10 nM or (E) 50 nM mArp2/3 complex. At t=0 sec (blue arrow) 15% Oregon green-actin was flowed into the reaction chamber with mArp2/3 complex in the (A,B,E) absence and (C,D,E) presence of 5 μM profilin HPRO1. Oregon green was globally bleached twice (red arrows) to visualize incorporation of new G-actin. See also Figure S4 and Movie S4. (A, C) Fluorescent micrographs of time series. (B, D) Kymographs of merged TMR and Oregon green F-actin fluorescence (dashed white line in (A, C)) over the course of two rounds of photobleaching in (B) the absence or (D) the presence of 5 μM profilin HPRO1. (E) Oregon-green-actin fluorescence recovery after photobleach #1. Error bars, s.e.; n=4 beads. Asterisk indicates statistical significance, T-test: * p<0.004. (F–K) TIRFM visualization of 1.5 μM Mg-ATP-actin assembly from beads coated with either mArp2/3 complex activator GST-pWA or formin SNAP-mDia2(FH1FH2). See also Movie S5. (F–I) Initial reactions contained 10% TMR(red)-actin with 2 nM mArp2/3 complex. After 240 seconds (blue arrow) 15% Oregon green-actin, 2 nM mArp2/3 complex, and 5 μM profilin were flowed into the chamber. (F) Full field containing GST-pWA-and formin-associated beads (dashed circles). (G) Time-lapse of magnified boxed regions in (F). (H) Mean filament length from the GST-pWA-(red circle) and formin-coated (green circle) beads shown in (F) and (G) over time. Profilin addition is marked by a blue arrow and dashed line. Error bars, s.d.; n=4 filaments. (I) Mean length of F-actin networks assembled from GST-pWA-or formin-coated beads after >300 seconds. Error bars, s.e.; n=20 formin beads and 26 pWA beads from 3 different experiments. Asterisks indicate statistical significance, T-test: * p<0.03 (pWA beads) ** p<0.007 (formin beads). (J–K) Initial reactions contained 10% TMR(red)-actin with 5 nM mArp2/3 complex. At t=0 second (blue arrow) 15% Oregon green-actin, 5 nM mArp2/3 complex, 5 μM profilin, and 10 nM capping protein (CP) were flowed into the chamber. Oregon green was bleached (red arrow) to visualize incorporation of new G-actin. (J) Fluorescent micrographs of time series. White solid circles mark expanding networks generated from beads (dashed circles). (K) Increase in network radius over time from formin-and pWA-coated beads. Error bars, s.e.; n=3 beads. Asterisk indicates statistical significance, T-test: * p<0.002.
Figure 6
Figure 6. Profilin antagonizes Arp2/3 complex in fission yeast
(A–F) Profilin mutant cdc3-124 fission yeast expressing the contractile ring marker Rlc1-GFP at semi-restrictive 33.5°C or fully restrictive 36°C, in the absence and presence of 50 μM Arp2/3 complex inhibitor CK-666. See also Table S1. (A) Representative micrographs. Normal Rlc1-GFP labeled contractile rings and Calcofluor stained septa are marked with green and yellow arrowheads. (B-E) Quantification of cytokinesis defects over time at 33.5°C in the absence (filled symbols) and presence (open symbols) of CK-666. Error bars, s.e.; n=3 experiments with ≥200 cells per strain. Asterisks indicate statistical significance, T-test: * p<0.02. (B) ercentage of cells with rings. (C) Percent of rings that are defective. (D) ercent of abnormal (broad, misplaced, misoriented, and/or partial) septa. (E) ercent of cells with ≥2 nuclei. (F) Quantification of cytokinesis defects described in (B-E) after 4 hr at 36.0°C. Error bars, s.e.; n≥50 cells per strain. Pound signs indicate no statistical difference, T-test: # p≥0.1.
Figure 7
Figure 7. Cartoon model for profilin’s role in regulating F-actin network homeostasis
The majority of G-actin in cells is bound to profilin, which helps distribute actin assembly between diverse F-actin networks. Profilin inhibits nucleation by formin but dramatically increases the elongation rate of formin-associated filaments. Profilin inhibits Arp2/3 complex-mediated daughter branch formation by disrupting the association of its activator WASP VCA with actin, but has little effect on their elongation rate. Furthermore, formin-associated filaments continue to elongate in the presence of capping protein, whereas Arp2/3 complex-branched filaments are rapidly capped. Therefore, profilin is necessary for formin to rapidly assemble unbranched actin filaments in the presence of excess Arp2/3 complex.

Comment in

References

    1. Bahler J, Wu JQ, Longtine MS, Shah NG, McKenzie A, 3rd, Steever AB, Wach A, Philippsen P, Pringle JR. Heterologous modules for efficient and versatile PCR-based gene targeting in Schizosaccharomyces pombe. Yeast. 1998;14:943–951. - PubMed
    1. Balasubramanian MK, Feoktistova A, McCollum D, Gould KL. Fission yeast Sop2p: a novel and evolutionarily conserved protein that interacts with Arp3p and modulates profilin function. Embo J. 1996;15:6426–6437. - PMC - PubMed
    1. Balasubramanian MK, Hirani BR, Burke JD, Gould KL. The Schizosaccharomyces pombe cdc3+ gene encodes a profilin essential for cytokinesis. J Cell Biol. 1994;125:1289–1301. - PMC - PubMed
    1. Blanchoin L, Amann KJ, Higgs HN, Marchand JB, Kaiser DA, Pollard TD. Direct observation of dendritic actin filament networks nucleated by Arp2/3 complex and WASP/Scar proteins. Nature. 2000;404:1007–1011. - PubMed
    1. Blanchoin L, Boujemaa-Paterski R, Sykes C, Plastino J. Actin dynamics, architecture, and mechanics in cell motility. Physiol Rev. 2014;94:235–263. - PubMed

Publication types

MeSH terms