

Stratifying patients at the risk of heart failure hospitalization using existing device diagnostic thresholds
- PMID: 25543319
- PMCID: PMC4390994
- DOI: 10.1016/j.hrtlng.2014.07.007
Stratifying patients at the risk of heart failure hospitalization using existing device diagnostic thresholds
Abstract
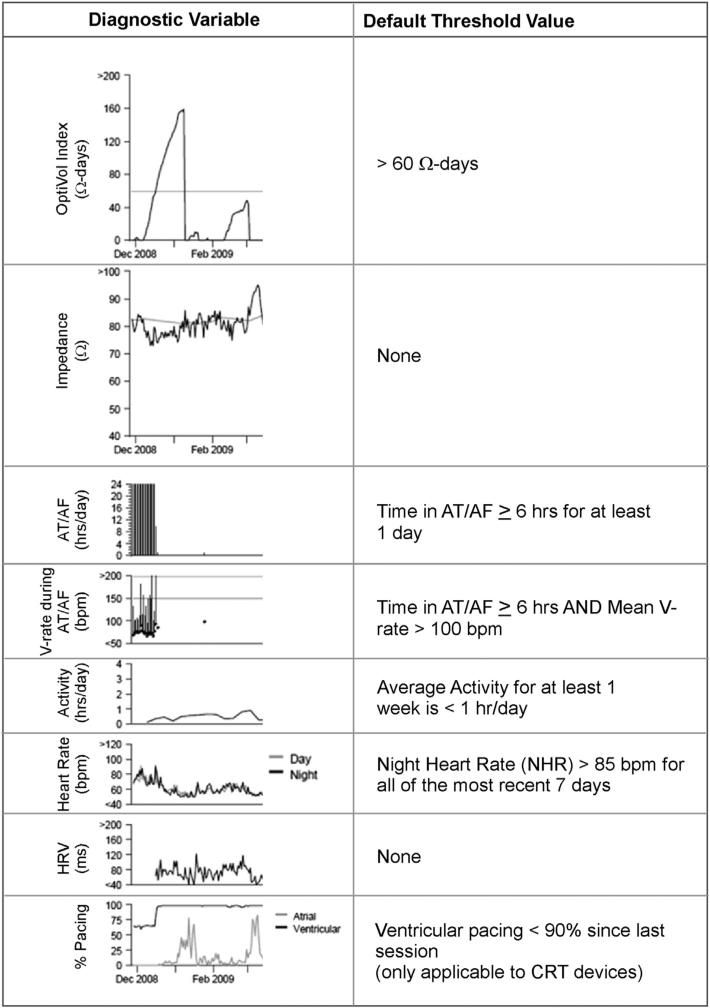
Background: Heart failure hospitalizations (HFHs) cost the US health care system ∼$20 billion annually. Identifying patients at risk of HFH to enable timely intervention and prevent expensive hospitalization remains a challenge. Implantable cardioverter defibrillators (ICDs) and cardiac resynchronization devices with defibrillation capability (CRT-Ds) collect a host of diagnostic parameters that change with HF status and collectively have the potential to signal an increasing risk of HFH. These device-collected diagnostic parameters include activity, day and night heart rate, atrial tachycardia/atrial fibrillation (AT/AF) burden, mean rate during AT/AF, percent CRT pacing, number of shocks, and intrathoracic impedance. There are thresholds for these parameters that when crossed trigger a notification, referred to as device observation, which gets noted on the device report. We investigated if these existing device observations can stratify patients at varying risk of HFH.
Methods: We analyzed data from 775 patients (age: 69 ± 11 year, 68% male) with CRT-D devices followed for 13 ± 5 months with adjudicated HFHs. HFH rate was computed for increasing number of device observations. Data were analyzed by both excluding and including intrathoracic impedance. HFH risk was assessed at the time of a device interrogation session, and all the data between previous and current follow-up sessions were used to determine the HFH risk for the next 30 days.
Results: 2276 follow-up sessions in 775 patients were evaluated with 42 HFHs in 37 patients. Percentage of evaluations that were followed by an HFH within the next 30 days increased with increasing number of device observations. Patients with 3 or more device observations were at 42× HFH risk compared to patients with no device observation. Even after excluding intrathoracic impedance, the remaining device parameters effectively stratified patients at HFH risk.
Conclusion: Available device observations could provide an effective method to stratify patients at varying risk of heart failure hospitalization.
Keywords: Ambulatory monitoring; Heart failure; Heart failure hospitalization; Implantable device diagnostics; Intrathoracic impedance.
Copyright © 2015 The Authors. Published by Elsevier Inc. All rights reserved.
Figures


References
-
- Hohnloser SH, Israel CW. Current evidence base for use of the implantable cardioverter-defibrillator. Circulation. 2013;128:172–183. - PubMed
-
- Goldenberg I, Moss AJ. Implantable device therapy. Prog Cardiovasc Dis. 2008;50:449–474. http://dx.doi.org/10.1016/j.pcad.2007.09.002. - DOI - PubMed
-
- Adamson PB, Smith AL, Abraham WT, et al. Continuous autonomic assessment in patients with symptomatic heart failure: prognostic value of heart rate variability measured by an implanted cardiac resynchronization device. Circulation. 2004;110:2389–2394. - PubMed
-
- Pressler A, Danner M, Esefeld K, et al. Validity of cardiac implantable electronic devices in assessing daily physical activity. Int J Cardiol. 2013;168:1127–1130. - PubMed
Publication types
MeSH terms
Grants and funding
LinkOut - more resources
Full Text Sources
Other Literature Sources
Medical
Research Materials
Miscellaneous
